Increase in Suicide in the United States, 1999–2014
- Key findings
- Suicide rates increased from 1999 through 2014, with greater annual percent increases after 2006.
- Suicide rates for females were higher in 2014 than in 1999 for all age groups under 75 years.
- Suicide rates for males were higher in 2014 than in 1999 for all age groups under 75 years.
- Percentages of suicides involving firearms and poisoning declined from 1999 through 2014, while suicides involving suffocation increased.
- Summary
- Data sources and methods
- About the authors
- References
- Suggested citation
NCHS Data Brief No. 241, April 2016
Sally C. Curtin, M.A., Margaret Warner, Ph.D., and Holly Hedegaard, M.D., M.S.P.H.
Key findings
Data from the National Vital Statistics System, Mortality
- From 1999 through 2014, the age-adjusted suicide rate in the United States increased 24%, from 10.5 to 13.0 per 100,000 population, with the pace of increase greater after 2006.
- Suicide rates increased from 1999 through 2014 for both males and females and for all ages 10–74.
- The percent increase in suicide rates for females was greatest for those aged 10–14, and for males, those aged 45–64.
- The most frequent suicide method in 2014 for males involved the use of firearms (55.4%), while poisoning was the most frequent method for females (34.1%).
- Percentages of suicides attributable to suffocation increased for both sexes between 1999 and 2014.
Suicide is an important public health issue involving psychological, biological, and societal factors (1,2). After a period of nearly consistent decline in suicide rates in the United States from 1986 through 1999 (3), suicide rates have increased almost steadily from 1999 through 2014. While suicide among adolescents and young adults is increasing and among the leading causes of death for those demographic groups (4), suicide among middle-aged adults is also rising (5). This report presents an overview of suicide mortality in the United States from 1999 through 2014. Suicide rates in 1999 are compared with 2014 for both females and males across age groups, and percentages are compared by method (firearms, poisoning, suffocation, and other means).
Keywords: death certificates, underlying cause of death, intentional self-harm, National Vital Statistics System
Suicide rates increased from 1999 through 2014, with greater annual percent increases after 2006.
- The age-adjusted suicide rate in 2014, 13.0 per 100,000 population, was 24% higher than the rate in 1999 (10.5) (Figure 1).
- The average annual percent increase in the age-adjusted suicide rate was about 1% per year from 1999 through 2006 but increased to 2% per year from 2006 through 2014.
- In 2014, the age-adjusted rate for males (20.7) was more than three times that for females (5.8).
- From 1999 through 2014, the percent increase in the age-adjusted suicide rate was greater for females (45% increase) than males (16% increase), resulting in a narrowing of the gender gap in suicide rates (as measured by rate ratios). The ratio of male to female suicide rates was lower in 2014 (3.6) than in 1999 (4.5).
Figure 1. Age-adjusted suicide rates, by sex: United States, 1999–2014
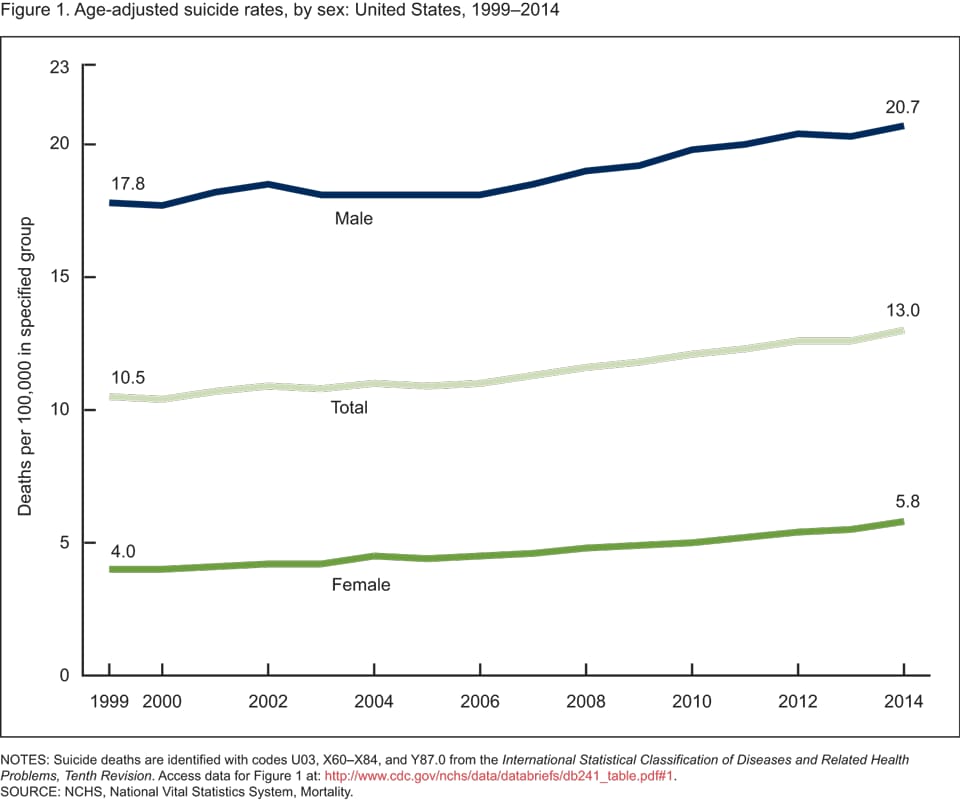
NOTES: Suicide deaths are identified with codes U03, X60–X84, and Y87.0 from the International Statistical Classification of Diseases and Related Health Problems, Tenth Revision. Access data table for Figure 1.
SOURCE: NCHS, National Vital Statistics System, Mortality.
Suicide rates for females were higher in 2014 than in 1999 for all age groups under 75 years.
- Suicide rates for females were highest for those aged 45–64 in both 1999 (6.0 per 100,000) and 2014 (9.8) (Figure 2). This age group also had the second-largest percent increase (63%) since 1999.
- Although based on a small number of suicides compared with other age groups (150 in 2014), the suicide rate for females aged 10–14 had the largest percent increase (200%) during the time period, tripling from 0.5 per 100,000 in 1999 to 1.5 in 2014.
- Percent increases in suicide rates since 1999 for females aged 15–24, 25–44, and 65–74 ranged between 31% and 53%.
- In contrast to other age groups, the suicide rate for women aged 75 and over decreased by 11% from 1999 through 2014, declining from 4.5 to 4.0 per 100,000.
Figure 2. Suicide rates for females, by age: United States, 1999 and 2014
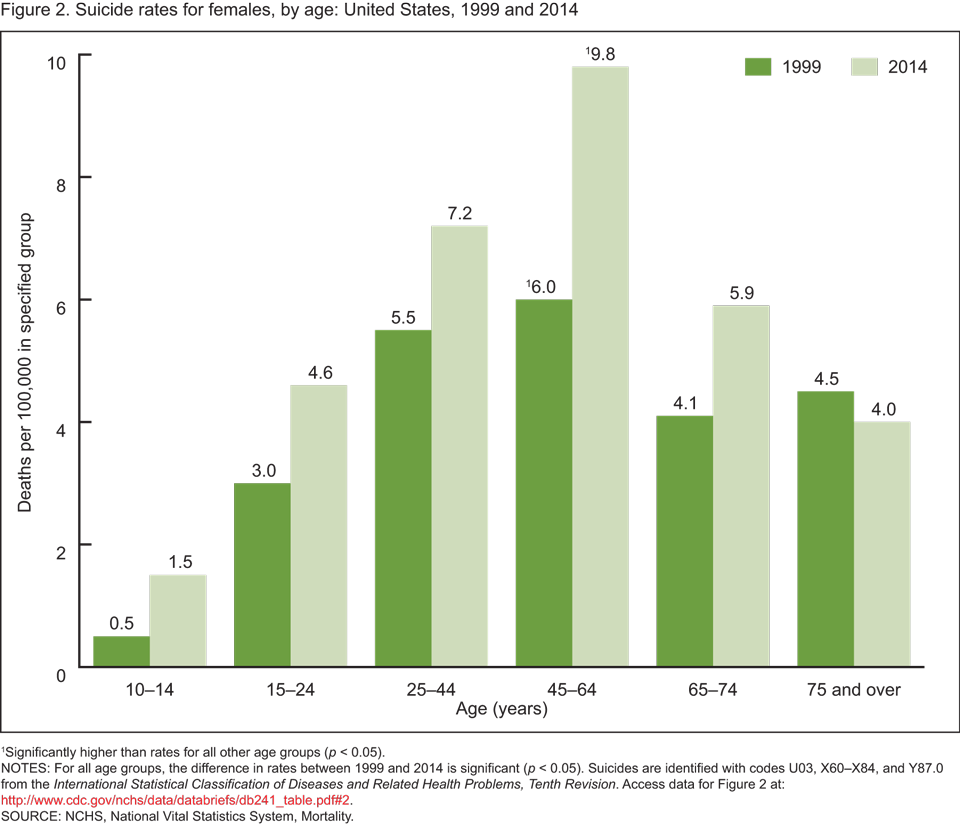
1Significantly higher than rates for all other age groups (p < 0.05).
NOTES: For all age groups, the difference in rates between 1999 and 2014 is significant (p < 0.05). Suicides are identified with codes U03, X60–X84, and Y87.0 from the International Statistical Classification of Diseases and Related Health Problems, Tenth Revision. Access data table for Figure 2.
SOURCE: NCHS, National Vital Statistics System, Mortality.
Suicide rates for males were higher in 2014 than in 1999 for all age groups under 75 years.
- In both 1999 and 2014, suicide rates were highest among men aged 75 and over (Figure 3). In contrast to other age groups, the suicide rate for this demographic group decreased by 8%, from 42.4 per 100,000 in 1999 to 38.8 in 2014.
- Men aged 45–64 had the second-highest suicide rate for males in 2014 and the largest percent increase (43%) in rates, increasing from 20.8 in 1999 to 29.7 in 2014.
- While males aged 10–14 had the lowest suicide rate of all age groups, this group experienced the second-largest percent increase (37%) from 1999 through 2014 (from 1.9 to 2.6).
Figure 3. Suicide rates for males, by age: United States, 1999 and 2014
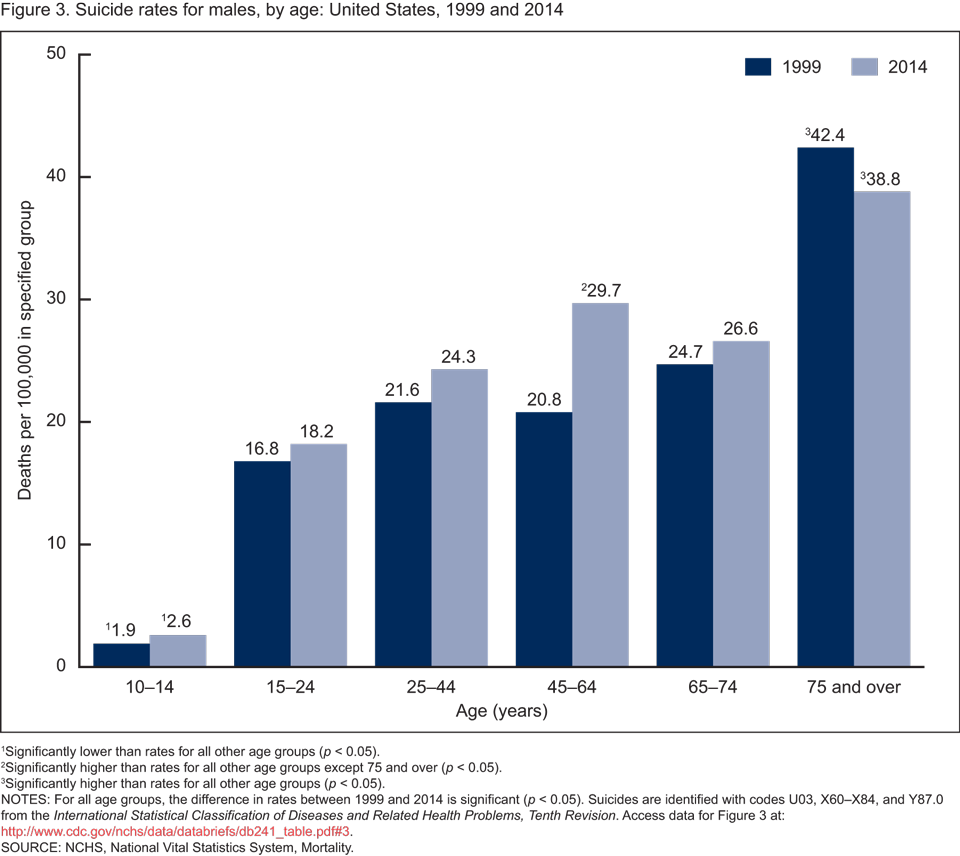
1Significantly lower than rates for all other age groups (p < 0.05).
2Significantly higher than rates for all other age groups except 75 and over (p < 0.05).
3Significantly higher than rates for all other age groups (p < 0.05).
NOTES: For all age groups, the difference in rates between 1999 and 2014 is significant (p < 0.05). Suicides are identified with codes U03, X60–X84, and Y87.0 from the International Statistical Classification of Diseases and Related Health Problems, Tenth Revision. Access data table for Figure 3.
SOURCE: NCHS, National Vital Statistics System, Mortality.
Percentages of suicides involving firearms and poisoning declined from 1999 through 2014, while suicides involving suffocation increased.
- For both females and males, about one in four suicides in 2014 were attributable to suffocation (includes hanging, strangulation, and suffocation), an increase from 1999, when fewer than one in five were by this method (Figure 4).
- The percentages of suicides attributable to firearms and poisoning were lower in 2014 than in 1999 for both females and males.
- Poisoning was the most common method of suicide for females in 2014, accounting for about one-third (34.1%) of all female suicides. This was a change from 1999, when firearms were the most common suicide method for women (36.9%), slightly more likely than poisoning (36.0%).
- More than one-half of male suicides (55.4%) in 2014 were firearm-related, although the percentage of suicides by this method was lower than in 1999 (61.7%).
- The most frequent “other” suicide methods in 2014 (not shown separately) for females were falls (2.8%) and drowning (1.4%). For males, the most frequent “other” methods were falls (2.2%) and cutting or piercing (1.9%).
Figure 4. Suicide deaths, by method and sex: United States, 1999 and 2014
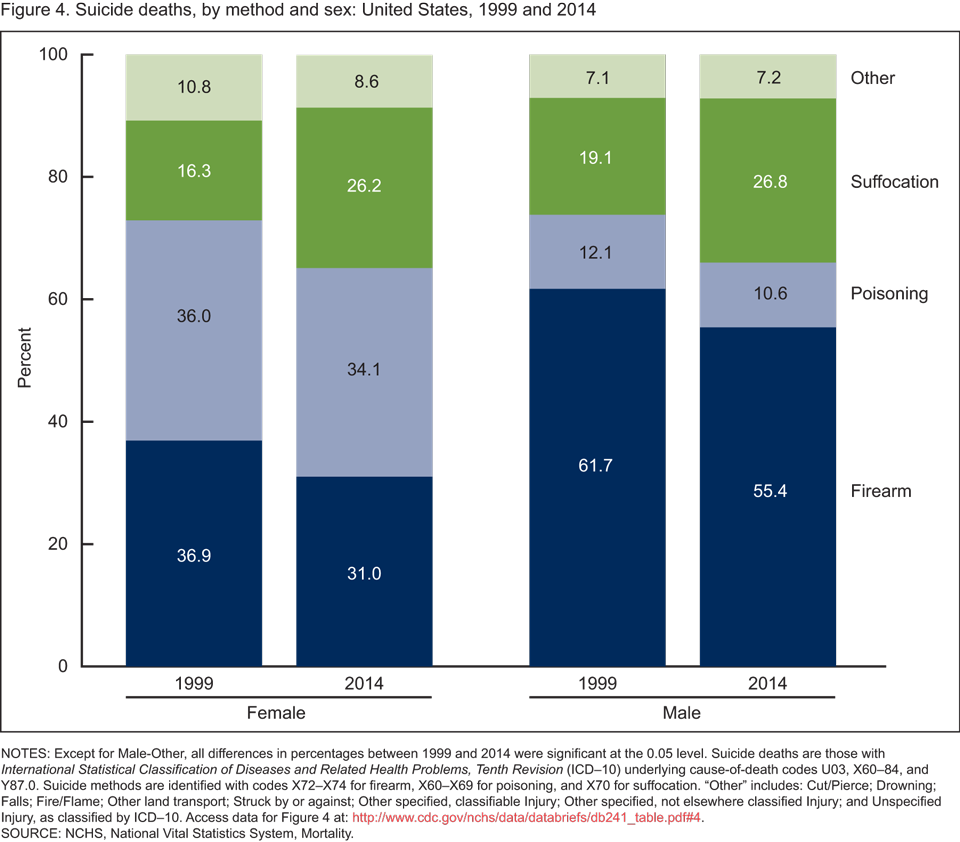
NOTES: Except for Male-Other, all differences in percentages between 1999 and 2014 were significant at the 0.05 level. Suicide deaths are those with International Statistical Classification of Diseases and Related Health Problems, Tenth Revision (ICD–10) underlying cause-of-death codes U03, X60–84, and Y87.0. Suicide methods are identified with codes X72–X74 for firearm, X60–X69 for poisoning, and X70 for suffocation. “Other” includes: Cut/Pierce; Drowning; Falls; Fire/Flame; Other land transport; Struck by or against; Other specified, classifiable Injury; Other specified, not elsewhere classified Injury; and Unspecified Injury, as classified by ICD–10. Access data table for Figure 4.
SOURCE: NCHS, National Vital Statistics System, Mortality.
Summary
Suicide is increasing against the backdrop of generally declining mortality, and is currently one of the 10 leading causes of death overall and within each age group 10–64 (4). This report highlights increases in suicide mortality from 1999 through 2014 and shows that while the rate increased almost steadily over the period, the average annual percent increase was greater for the second half of this period (2006–2014) than for the first half (1999–2006). Increases in suicide rates occurred for both males and females in all but the oldest age group (75 and over). Percent increases in rates were greatest for females aged 10–14 and for males, those aged 45–64. The male-female disparity in suicide rates (as measured by rate ratios) narrowed slightly over the period. Poisoning was the most common suicide method for females in 2014, and firearms were the most frequent for males, but both sexes showed increases since 1999 in the percentage of suicides attributable to suffocation. Suicide numbers and rates for females and males by Hispanic origin and race for 1999 and 2014 are also available.
Data sources and methods
Mortality and population data are from the Centers for Disease Control and Prevention’s (CDC) National Center for Health Statistics 1999–2014 multiple cause-of-death mortality files (6). Suicide deaths are those classified with the International Statistical Classification of Diseases and Related Health Problems, Tenth Revision (ICD–10) underlying cause-of-death codes U03, X60–X84, and Y87.0 (7). Suicide deaths are categorized by method of injury using the following ICD–10 codes: firearm (X72–X74), suffocation (X70), poisoning (X60–X69), and other methods (U03, X71, X75–X84, and Y87.0).
Age-adjusted death rates were calculated using the direct method and the 2000 standard population (8). Demographic information comes from death certificates. Population data for 2000 and 2010 are April 1 bridged-race census counts, and for 1999, 2001–2009, and 2011–2014 are July 1 bridged-race estimates from the vintage 2014 postcensal series. Trends in age-adjusted death rates were evaluated using the Joinpoint Regression Program (9). Suicide rates by age group were analyzed by comparing 1999 and 2014 only; trends during this time period were not analyzed and may have varied by subgroup. The small number of suicides during 1999–2014 for persons aged 5–9 years (79) were included in the total age-adjusted rates and in the percentages by method. Male-female differences in suicide rates were based on rate ratios calculated as male age-adjusted rate divided by female age-adjusted rate.
About the authors
Sally C. Curtin and Margaret Warner are with CDC’s National Center for Health Statistics (NCHS), Division of Vital Statistics. Holly Hedegaard is with NCHS’ Office of Analysis and Epidemiology.
References
- CDC. Preventing suicide.
- U.S. Surgeon General, National Action Alliance for Suicide Prevention. 2012 National strategy for suicide prevention: Goals and objectives for action. 2012.
- Hu G, Wilcox HC, Wissow L, Baker SP. Mid-life suicide: an increasing problem in U.S. whites, 1999–2005. Am J Prev Med 37(6):579. 2009.
- Heron M. Deaths: Leading causes for 2013 [PDF – 3 MB]. National vital statistics reports; vol 65 no 2. Hyattsville, MD: National Center for Health Statistics. 2016.
- Hempstead KA, Phillips JA. Rising suicide among adults aged 40–64 years: The role of job and financial circumstances. Am J Prev Med 48(5):491–500. 2015.
- National Center for Health Statistics. About underlying cause of death, 1999–2014 . CDC WONDERonline database. 2016.
- WHO. International statistical classification of diseases and related health problems, tenth revision (ICD–10). 2008 ed. Geneva, Switzerland. 2009.
- Xu JQ, Murphy SL, Kochanek KD, Bastian BA. Deaths: Final data for 2013 [PDF – 10 MB]. National vital statistics reports; vol 64 no 2. Hyattsville, MD: National Center for Health Statistics. 2016.
- National Cancer Institute. Joinpoint Regression Program (Version 3.4.3.) [computer software]. 2010.
Suggested citation
Curtin SC, Warner M, Hedegaard H. Increase in suicide in the United States, 1999–2014. NCHS data brief, no 241. Hyattsville, MD: National Center for Health Statistics. 2016.
Copyright information
All material appearing in this report is in the public domain and may be reproduced or copied without permission; citation as to source, however, is appreciated.
National Center for Health Statistics
Charles J. Rothwell, M.S., M.B.A., Director
Nathaniel Schenker, Ph.D., Deputy Director
Jennifer H. Madans, Ph.D., Associate Director for Science
Division of Vital Statistics
Delton Atkinson, M.P.H., M.P.H., P.M.P., Director
Hanyu Ni, Ph.D., M.P.H., Associate Director for Science
Office of Analysis and Epidemiology
Irma E. Arispe, Ph.D., Director
Makram Talih, Ph.D., Associate Director for Science