Born a Bit Too Early: Recent Trends in Late Preterm Births
- Key findings
- What are the recent trends in late preterm births?
- Have late preterm births increased among mothers of all ages?
- What are the trends in late preterm birth rates by race and Hispanic origin?
- Have late preterm births increased in all parts of the country?
- Why has the late preterm birth rate increased in recent years?
- Summary
- Definitions
- Data source and methods
- About the authors
- References
- Suggested citation
NCHS Data Brief No. 24, November 2009
PDF Version (691 KB)
by Joyce A. Martin, M.P.H.; Sharon Kirmeyer, Ph.D.; Michelle Osterman, M.H.S.; and Ruth A. Shepherd, M.D.
Key findings
- The U.S. late preterm birth rate rose 20% from 1990 to 2006. If the late preterm rate had not risen from the 1990 level, more than 50,000 fewer infants would have been delivered late preterm in 2006.
- On average, more than 900 late preterm babies are born every day in the United States, or a total of one-third of 1 million infants (333,461).
- Increases in late preterm births are seen for mothers of all ages, and for non-Hispanic white and Hispanic mothers. The rate for black mothers declined during the 1990s, but has been on the rise since 2000.
- Late preterm birth rates rose for all U.S. states, but declined in the District of Columbia.
- The percentage of late preterm births for which labor was induced more than doubled from 1990 to 2006; the percentage of late preterm births delivered by cesarean also rose markedly.
The preterm (less than 37 weeks of gestation) birth rate rose by more than 20 percent in the United States between 1990 and 2006 (1). Most of this increase was among infants born toward the end of the preterm period, at 34 to 36 full weeks of pregnancy, or during the period known as “late preterm” (1,2).
Although babies born before the 34th week of pregnancy are at the greatest risk of early death and life-long morbidity (3), it is becoming increasingly recognized that infants born late preterm are less healthy than infants born later in pregnancy (4–9). Late preterm babies are more likely than term babies to suffer complications at birth such as respiratory distress (4,9); to require intensive and prolonged hospitalization (4,8); to incur higher medical costs (5); to die within the first year of life (3,7,8); and to suffer brain injury that can result in long-term neurodevelopmental problems (6). Accordingly, increased high levels of late preterm births are an important public health issue.
This data brief is on births in singleton deliveries, which make up the bulk of all newborns (96.6 percent in 2006).
Keywords: gestational age, state-specific late preterm birth rates
What are the recent trends in late preterm births?
The rate of infants born late preterm rose 20 percent, from 6.8 to 8.1 percent from 1990 to 2006 (Figure 1).
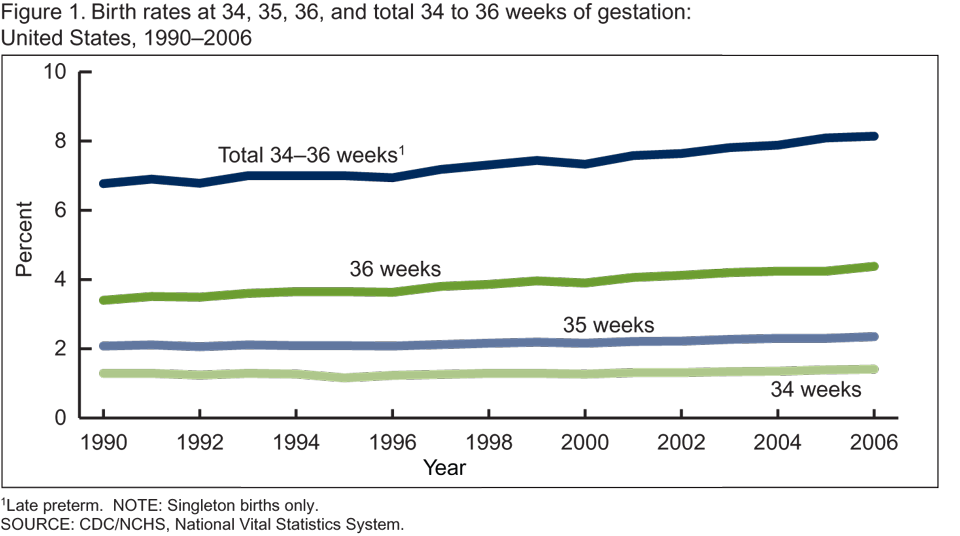
Put another way, 1 of every 15 babies born in 1990 was delivered late preterm compared with about 1 of 12 infants in 2006.
Rates rose for each gestational week from 34 to 36 weeks, with the largest increases for late preterm births delivered at 36 weeks (Figure 1). For the period 1990 to 2006, births at 34 weeks increased from 1.3 to 1.4 percent, births at 35 weeks from 2.1 to 2.3 percent, and births delivered at 36 weeks from 3.4 to 4.4 percent.
On average, more than 900 late preterm babies are born every day in the United States; or a total of one-third of 1 million (333,461) late preterm infants in 2006.
If the late preterm birth rate for 2006 were the same as that for 1990, about 50,000 fewer infants would have been delivered late preterm in 2006 alone.
Have late preterm births increased among mothers of all ages?
Late preterm birth rates have risen among mothers of all ages from 1990 to 2006, including teenage mothers (up 5 percent) (Figure 2).
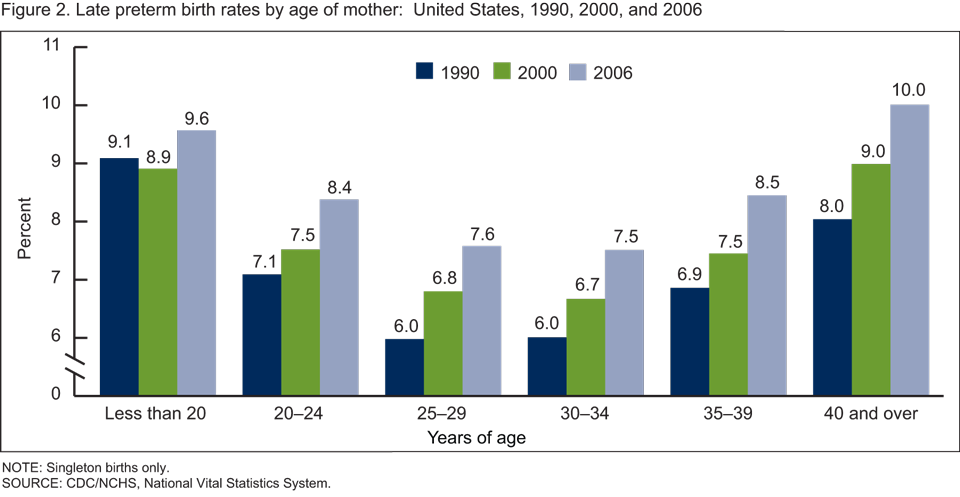
Among mothers in age groups 25 years and over, late preterm birth rates increased by more than 20 percent from 1990 to 2006.
Younger (under age 20 years) and older (40 years and over) mothers are the most likely to have a late preterm baby.
What are the trends in late preterm birth rates by race and Hispanic origin?
Late preterm births climbed by one-third among non-Hispanic white mothers from 1990 to 2006 (from 5.5 to 7.4 percent) (Figure 3).
Rates for Hispanic mothers increased, but more modestly, by 11 percent, from 7.4 to 8.2 percent.
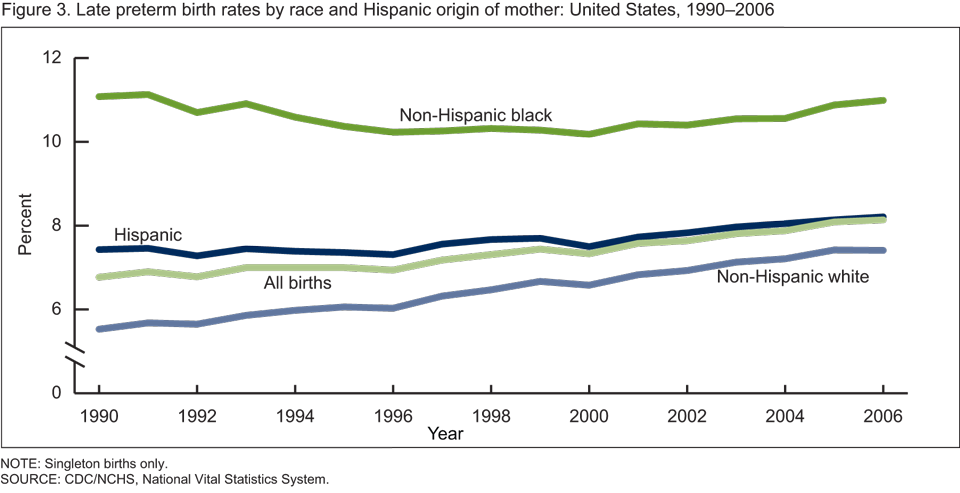
Among non-Hispanic black mothers, late preterm birth rates trended downward during much of the 1990s, but rose from 2000 to 2006. As a result, there was essentially no change in the percentage of non-Hispanic black late preterm births in 1990 (11.1 percent) compared with 2006 (11.0 percent).
In 2006, non-Hispanic black mothers were about 50 percent more likely than non-Hispanic white mothers and one-third more likely than Hispanic mothers to have a late preterm delivery.
Have late preterm births increased in all parts of the country?
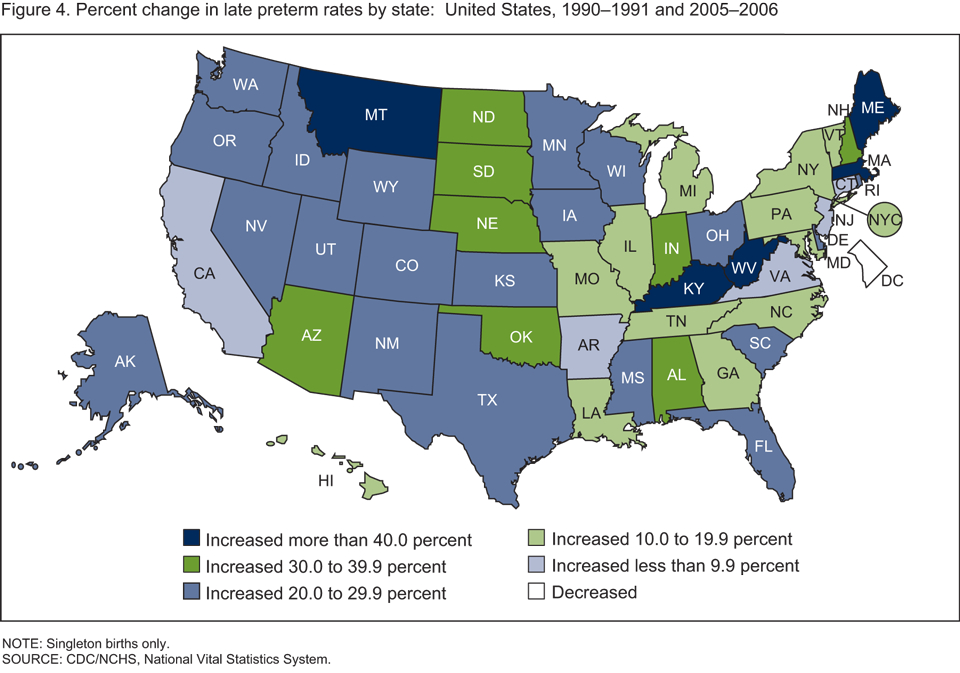
Increases in late preterm birth rates are seen across the United States; rates rose significantly between 1990–1991 and 2005–2006 for all states (Figure 4). The only area to report a decline was the District of Columbia (see table).
Rates increased by 20 percent or more for more than one-half of all states. Among these, rates rose by 30 to 39 percent in eight states, and 40 percent or more in five states.
For combined years 2005–2006, late preterm birth rates ranged from under 6 percent in Connecticut and Vermont to more than 10 percent in Alabama, Louisiana, and Mississippi.
Table. Late preterm singleton birth rates, by state: United States, 1990–1991 and 2005–2006
| 1990–1991 | 2005–2006 | Percent change 1990–1991 to 2005–2006 | |
|---|---|---|---|
| Total | 6.80 | 8.11 | 19 |
| Alabama | 8.07 | 10.64 | 32 |
| Alaska | 5.98 | 7.28 | 22 |
| Arizona | 6.85 | 8.92 | 30 |
| Arkansas | 8.20 | 8.93 | 9 |
| California | 6.59 | 6.87 | 4 |
| Colorado | 6.37 | 7.79 | 22 |
| Connecticut | 5.69 | 5.92 | 4 |
| Delaware | 6.99 | 8.72 | 25 |
| District of Columbia | 11.39 | 9.62 | -16 |
| Florida | 7.37 | 8.85 | 20 |
| Georgia | 7.88 | 9.18 | 16 |
| Hawaii | 6.79 | 7.80 | 15 |
| Idaho | 5.77 | 7.49 | 30 |
| Illinois | 7.24 | 8.16 | 13 |
| Indiana | 6.29 | 8.48 | 35 |
| Iowa | 5.65 | 7.34 | 30 |
| Kansas | 6.24 | 7.81 | 25 |
| Kentucky | 6.98 | 9.93 | 42 |
| Louisiana | 8.90 | 10.44 | 17 |
| Maine | 4.70 | 6.78 | 44 |
| Maryland | 7.01 | 8.20 | 17 |
| Massachusetts | 4.75 | 6.80 | 43 |
| Michigan | 6.74 | 7.79 | 16 |
| Minnesota | 5.36 | 6.66 | 24 |
| Mississippi | 9.50 | 12.23 | 29 |
| Missouri | 7.03 | 8.36 | 19 |
| Montana | 5.56 | 7.81 | 40 |
| Nebraska | 5.57 | 7.68 | 38 |
| Nevada | 7.48 | 9.31 | 24 |
| New Hampshire | 4.58 | 6.23 | 36 |
| New Jersey | 6.77 | 7.44 | 10 |
| New Mexico | 7.15 | 9.06 | 27 |
| New York | 6.70 | 7.52 | 12 |
| North Carolina | 7.74 | 8.54 | 10 |
| North Dakota | 5.60 | 7.37 | 32 |
| Ohio | 6.73 | 8.20 | 22 |
| Oklahoma | 6.75 | 8.80 | 30 |
| Oregon | 5.40 | 6.73 | 25 |
| Pennsylvania | 6.39 | 7.17 | 12 |
| Rhode Island | 6.25 | 7.65 | 22 |
| South Carolina | 7.75 | 9.72 | 26 |
| South Dakota | 5.87 | 8.13 | 39 |
| Tennessee | 8.13 | 9.39 | 15 |
| Texas | 7.41 | 8.95 | 21 |
| Utah | 5.89 | 7.61 | 29 |
| Vermont | 4.92 | 5.70 | 16 |
| Virginia | 6.99 | 7.66 | 10 |
| Washington | 5.59 | 6.98 | 25 |
| West Virginia | 6.32 | 9.63 | 53 |
| Wisconsin | 5.92 | 7.18 | 21 |
| Wyoming | 7.12 | 8.57 | 20 |
Why has the late preterm birth rate increased in recent years?
Many factors may have contributed to this rise (9). The reasons are not clear; however, we do know that the way labor and delivery is managed has also changed over this period.
Although it is not possible to know whether an infant would be born late preterm if the birth was not induced or delivered by cesarean, recent studies suggest that the increasing use of induction of labor and cesarean delivery at 34–36 weeks has influenced the upswing in the late preterm birth rate (10,11).

The percentage of late preterm vaginal births for which labor was induced more than doubled between 1990 and 2006, climbing from 7.5 to 17.3 percent (Figure 5). The percentage of late preterm births delivered by cesarean also rose substantially, by 46 percent, from 23.5 to 34.3 percent (Figure 5).
Summary
The number and rate of babies born just 1 to 3 weeks short of “term” has risen substantially in recent years. This increase has not been offset by a decline in births delivered at less than 34 weeks; early term (37 to 39 weeks) births have risen, but births at longer gestations of 40 weeks or more have declined. From 1990 to 2006 increases in late preterm singleton births are seen among women of all ages, among non-Hispanic white and Hispanic infants (the rate for non-Hispanic black births declined during the 1990s, but has been on the rise since 2000), and in all U.S. states (except the District of Columbia). The percentages of late preterm births for which labor was induced or which were delivered by cesarean have also risen markedly.
The rise in late preterm births is important because these infants are developmentally and physiologically immature and suffer more health complications and have higher death rates than infants born at term (12). Preliminary birth data for 2007 suggest a small decline in the overall late preterm birth rate from the 2006 level (from 8.1 to 8.0 percent) (13), but it is too soon to tell if this small change represents the beginning of a longer term shift in trends in late preterm births.
Definitions
Preterm birth rate: The number of births delivered at less than 37 completed weeks of gestation per 100 total births.
Late preterm birth rate: The number of births delivered at 34 to 36 completed weeks of gestation per 100 total births.
Term births: Births delivered at 37 to 41 completed weeks of gestation.
Multiple birth rate: The number of twin and triplet and higher order multiple births per 1,000 total births.
Induction of labor: Initiation of uterine contractions by medical or surgical means for the purpose of delivery before the spontaneous onset of labor (i.e., before labor has begun).
Cesarean: Extraction of the infant, placenta, and membranes through an incision in the maternal abdominal and uterine walls.
Data source and methods
This report contains data from the Natality Data File from the National Vital Statistics System (NVSS). The vital statistics natality file includes information for all births occurring in the United States.
The natality files include information on a wide range of maternal and infant demographic and health characteristics for babies born in the United States. Data may also be accessed from the interactive data access tool, VitalStats.
This data brief is on births in singleton deliveries, which make up the bulk of all newborns (96.6 percent in 2006). Births in multiple deliveries are excluded because of the very different gestational age patterns, trends, and birth outcomes of multiple births compared with singletons (1).
The primary measure used to determine gestational age is the interval between the first day of the mother’s last normal menstrual period (LMP) and the date of birth. The clinical or obstetric estimate of gestation is substituted where the LMP is missing or inconsistent with birthweight (1).
The excess number of 2006 late preterm births for 2006 is calculated by applying the 1990 birth rates for individual gestational weeks 34, 35, and 36 to the total number of 2006 singleton births. The estimated number of births is then subtracted from the observed or reported number and numbers for the individual weeks totaled.
About the authors
Joyce A. Martin, Sharon Kirmeyer, and Michelle Osterman are with the Centers for Disease Control and Prevention’s National Center for Health Statistics, Division of Vital Statistics, Reproductive Statistics Branch. Ruth A. Shepherd, M.D., FAAP, is with the Kentucky Department of Health.
References
- Martin JA, Hamilton BE, Sutton PD, et al. Births: Final data for 2006. National vital statistics reports; vol 57 no 7. Hyattsville, MD: National Center for Health Statistics. 2008.
- Davidoff MJ, Dias T, Damus K, et al. Changes in the gestational age distribution among U.S. singleton births: Impact on rates of late preterm birth, 1992 to 2002. Semin Perinatol 30(1):8–15. 2006.
- Mathews TJ, MacDorman MF. Infant mortality statistics from the 2005 period linked birth/infant death data set. National vital statistics reports; vol 57 no 2. Hyattsville, MD: National Center for Health Statistics. 2008.
- Arnon S, Dolfin T, Litmanovitz I, et al. Preterm labour at 34–36 weeks of gestation: Should it be arrested? Paediatr Perinat Epidemiol 15(3):252–6. 2001.
- Wang ML, Dorer DJ, Fleming MP, et al. Clinical outcomes of new-term infants. Am Acad Pediatr 114(2):372–6. 2004.
- Adams-Chapman I. Neurodevelopmental outcome of the late preterm infant. Clin Perinatol 33(4):947–64. 2006.
- Tomashek KM, Shapiro-Mendoza CK, Davidoff MJ, et al. Differences in mortality between late-preterm and term singleton infants in the United States, 1995–2002. Pediatrics 151(5):450–6. 2007.
- Ramachandrappa A, Jain L. Health issues of the late preterm infant. Pediatr Clin North Am 56(3):565–77. 2009.
- Engle WA, Kominiarek MA. Late preterm infants, early term infants and timing of elective deliveries. Clin Perinatol 35(2):325–41. 2008.
- Fuchs K, Wapner R. Elective cesarean section and induction and their impact on late preterm births. Clin Perinatol 33(4):793–800. 2006.
- Bettegowda VR, Dias T, Davidoff MJ, et al. The relationship between cesarean delivery and gestational age among U.S. singleton births. Clin Perinatol 35(2):309–23. 2008.
- Engle WA, Tomashek KM, Wallman C, et al. “Late preterm” infants: A population at risk. Pediatrics 120(6):1390–1401. 2007.
- Hamilton BE, Martin JA, Ventura SJ. Births: Preliminary data for 2007. National vital statistics reports; vol 57 no 12. Hyattsville, MD: National Center for Health Statistics. 2009.
Suggested citation
Martin JA, Kirmeyer S, Osterman M, Shepherd RA. Born a bit too early: Recent trends in late preterm births. NCHS data brief, no 24. Hyattsville, MD: National Center for Health Statistics. 2009.
Copyright information
All material appearing in this report is in the public domain and may be reproduced or copied without permission; citation as to source, however, is appreciated.
National Center for Health Statistics
Edward J. Sondik, Ph.D., Director
Jennifer H. Madans, Ph.D., Associate Director
Division of Vital Statistics
Charles J. Rothwell, M.S., Director