State Variation in Preventive Care Visits, by Patient Characteristics, 2012
- Key findings
- Preventive care visits varied by patient age and sex.
- The rate of preventive care visits varied among the 34 most populous states.
- The percentage of preventive care visits made by males to primary care physicians exceeded the percentage made by females.
- The rate of preventive care visits to primary care physicians varied among the 34 most populous states.
- Summary
- Definition
- Data source and methods
- About the authors
- References
- Suggested citation
NCHS Data Brief No. 234, January 2016
PDF Version (418 KB)
Esther Hing, M.P.H., and Michael Albert, M.D., M.P.H.
Key findings
Data from the National Ambulatory Medical Care Survey, 2012
- In 2012, 61.4 preventive care visits were made to office-based physicians per 100 persons. The female rate (76.6 visits per 100 females) exceeded the male rate (45.4 visits per 100 males) by 69%.
- Among the 34 most populous states, the rate of preventive care visits exceeded the national rate in 1 state (Connecticut) and was lower than the national rate in 11 states (Arkansas, Indiana, Iowa, Michigan, Missouri, North Carolina, Oklahoma, Oregon, Pennsylvania, South Carolina, and Washington).
- The rate of preventive care visits to primary care physicians in the 34 most populous states exceeded the national rate in 1 state (Connecticut) and was lower than the national rate in 7 states (Arkansas, Indiana, Iowa, Missouri, North Carolina, Pennsylvania, and Washington).
Preventive care visits such as general medical examinations, prenatal visits, and well-baby visits give physicians and other health professionals the opportunity to screen for diseases or conditions, as well as to promote healthy behaviors that may delay or prevent these conditions and reduce subsequent use of emergency or inpatient care. In this report, the rate of preventive care visits to office-based physicians is examined by state, patient demographics, and physician specialty. Estimates are based on data from the National Ambulatory Medical Care Survey (NAMCS), a nationally representative survey of visits to office-based physicians.
Keywords: office-based physicians, primary care, National Ambulatory Medical Care Survey
Preventive care visits varied by patient age and sex.
- In 2012, 61.4 office visits per 100 persons were made for preventive care (Figure 1). The rate among females (76.6 visits per 100 females) was 69% higher than the rate for males (45.4 visits per 100 males).
- No differences were seen in preventive care visit rates by sex among children under age 18 years and adults aged 65 and over.
- Overall, preventive care visit rates were higher for children under age 18 years (73.2 per 100 persons) and for those aged 65 and over (81.1 per 100 persons) than for adults aged 18–44 (53.2 per 100 persons) and 45–64 (51.8 per 100 persons). A similar pattern was observed for males in these age groups.
- The preventive care visit rate for women aged 18–44 (87.1 per 100 women) exceeded the rate for women aged 45–64 (60.5 per 100 women).
- The preventive care visit rates for women aged 18–44 (87.1 per 100 women) and 45–64 (60.5 per 100 women) exceeded the rates for men in those age groups (18.5 and 42.5 per 100 men, respectively).
Figure 1. Preventive care visit rate per 100 persons, by sex and age: United States, 2012
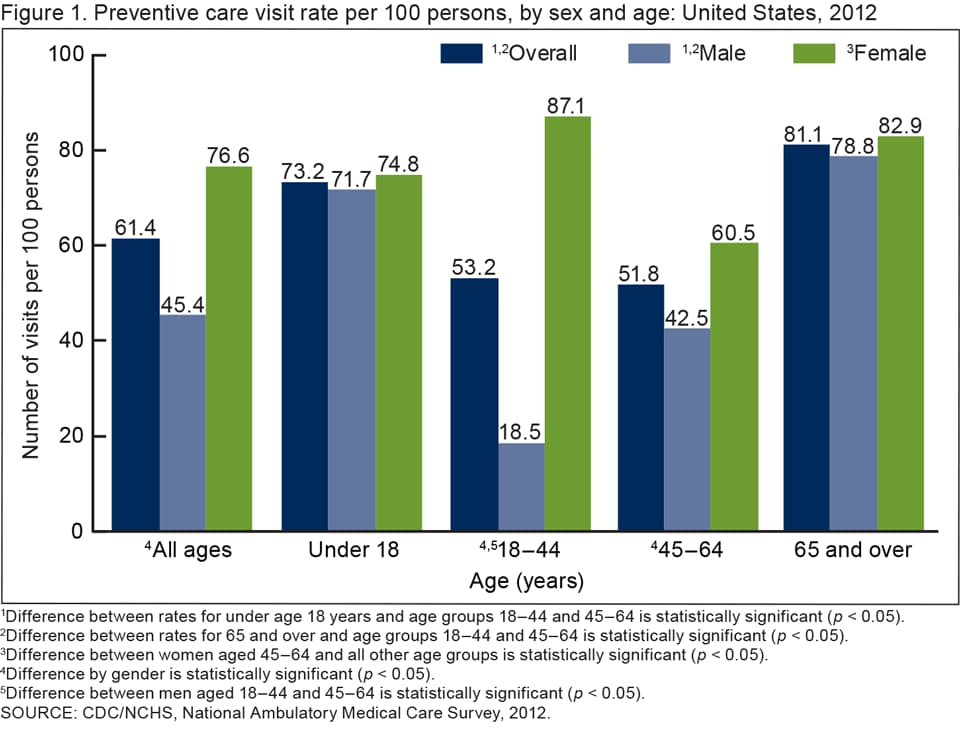
1Difference between rates for under age 18 years and age groups 18–44 and 45–64 is statistically significant (p < 0.05).
2Difference between rates for 65 and over and age groups 18–44 and 45–64 is statistically significant (p < 0.05).
3Difference between women aged 45–64 and all other age groups is statistically significant (p < 0.05).
4Difference by gender is statistically significant (p < 0.05).
5Difference between men aged 18–44 and 45–64 is statistically significant (p < 0.05).
SOURCE: CDC/NCHS, National Ambulatory Medical Care Survey, 2012.
The rate of preventive care visits varied among the 34 most populous states.
- The rate of preventive care visits in the 34 most populous states ranged from 33.1 visits per 100 persons in Arkansas to 120 visits per 100 persons in Connecticut (Figure 2).
- The rate of preventive care visits per 100 persons exceeded the national rate in Connecticut and was lower than the national rate in 11 states (Arkansas, Indiana, Iowa, Michigan, Missouri, North Carolina, Oklahoma, Oregon, Pennsylvania, South Carolina, and Washington).
Figure 2. Preventive care visit rate per 100 persons, by selected states: United States, 2012
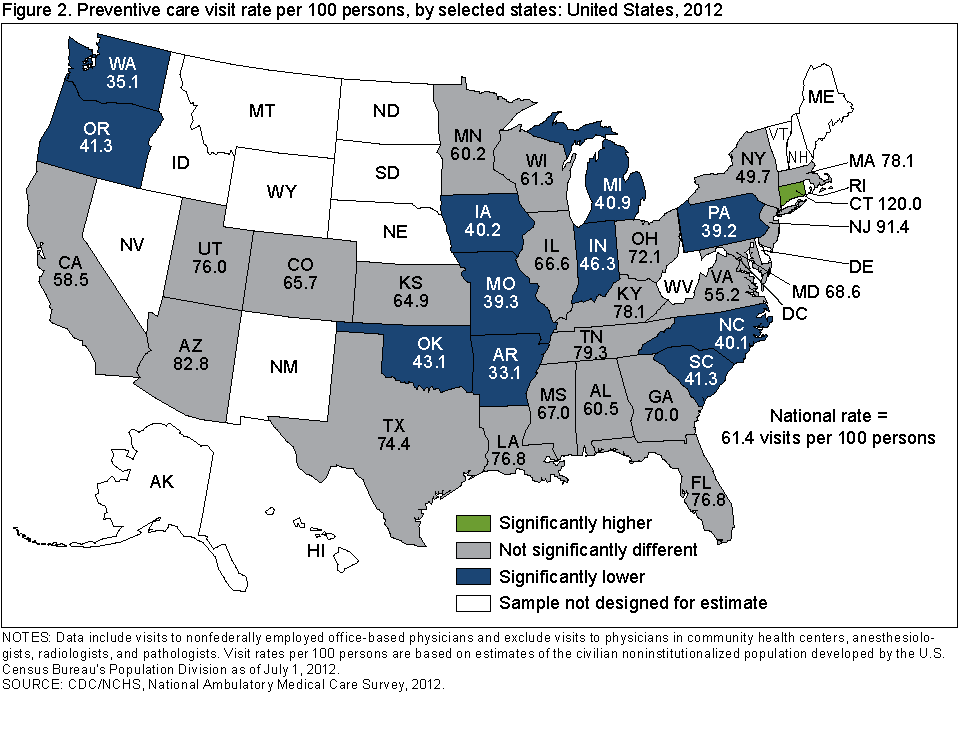
NOTES: Data include visits to nonfederally employed office-based physicians and exclude visits to physicians in community health centers, anesthesiologists, radiologists, and pathologists. Visit rates per 100 persons are based on estimates of the civilian noninstitutionalized population developed by the U.S. Census Bureau’s Population Division as of July 1, 2012.
SOURCE: CDC/NCHS, National Ambulatory Medical Care Survey, 2012.
The percentage of preventive care visits made by males to primary care physicians exceeded the percentage made by females.
- Overall, 58.2% of preventive care visits were made to primary care physicians (Figure 3). Primary care physicians include general or family practitioners, internists, and pediatricians.
- The percentage of preventive care visits to primary care physicians made by males (76.3%) exceeded those made by females (48.0%).
- The percentage of preventive care visits to primary care physicians for men aged 18–44 (70.8%) and 45–64 (66.4%) exceeded those for women (21.8% and 44.1%, respectively).
- The percentage of preventive care visits to primary care physicians by children under age 18 years and those aged 65 and over did not vary by gender.
Figure 3. Percentage of preventive care visits made to primary care physicians by sex and age: United States, 2012
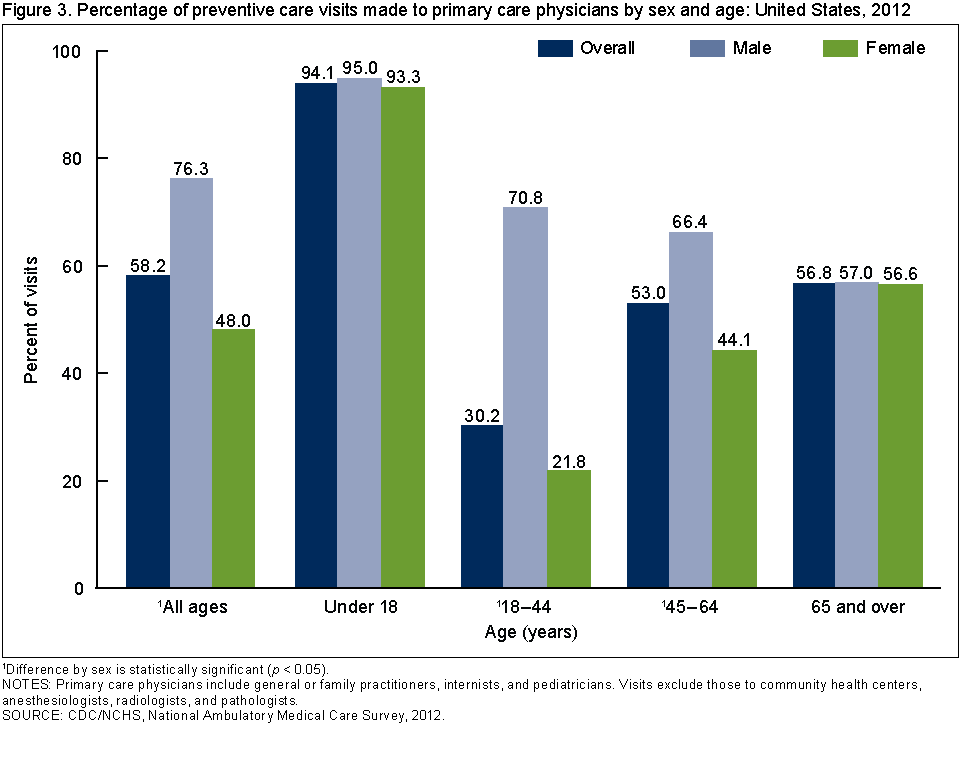
1Difference by sex is statistically significant (p < 0.05)
NOTE: Primary care physicians include general or family practitioners, internists, and pediatricians. Visits exclude those to community health centers, anesthesiologists, radiologists, and pathologists.
SOURCE: CDC/NCHS, National Ambulatory Medical Care Survey, 2012.
The rate of preventive care visits to primary care physicians varied among the 34 most populous states.
- In 2012, 35.7 preventive care visits were made to primary care physicians for every 100 persons in the United States (Figure 4).
- Among the 34 most populous states, the rate of preventive care visits to primary care physicians ranged from 18.6 visits per 100 persons in Washington to 59.3 visits per 100 persons in Connecticut.
- For the 34 most populous states, the rate of preventive care visits to primary care physicians exceeded the national rate in Connecticut and was lower than the national rate in seven states (Arkansas, Indiana, Iowa, Missouri, North Carolina, Pennsylvania, and Washington).
Figure 4. Rate of preventive care visits to primary care physicians per 100 persons, by selected states: United States, 2012
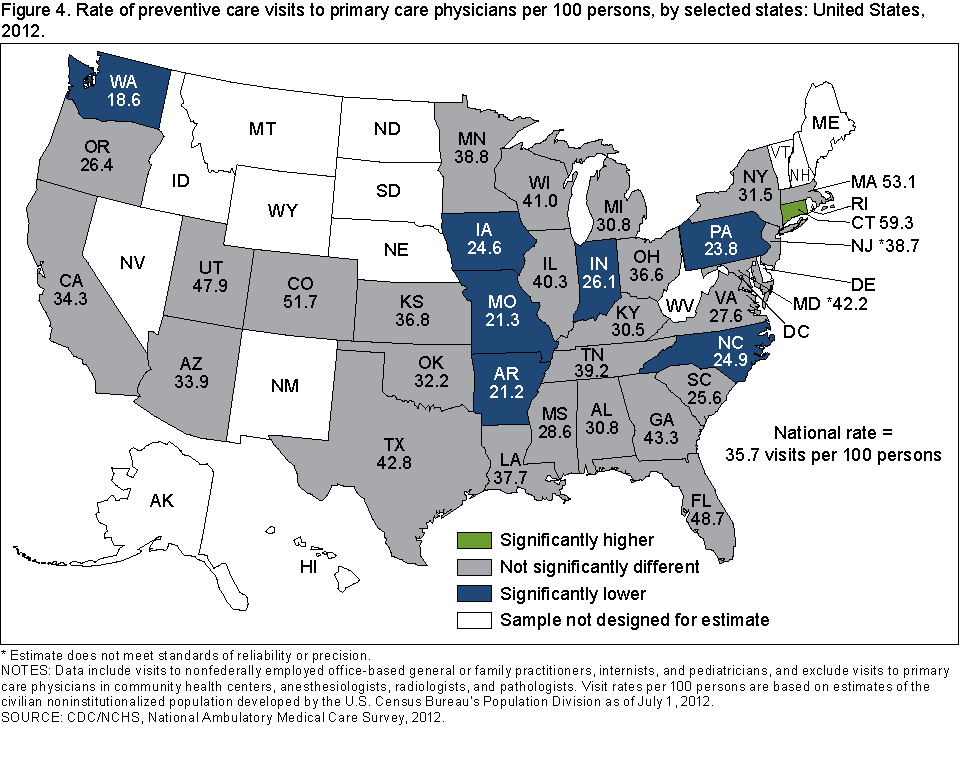
* Estimate does not meet standards of reliability or precision.
NOTES: Data include visits to nonfederally employed office-based general or family practitioners, internists, and pediatricians, and exclude visits to primary care physicians in community health centers, anesthesiologists, radiologists, and pathologists. Visit rates per 100 persons are based on estimates of the civilian noninstitutionalized population developed by the U.S. Census Bureau’s Population Division as of July 1, 2012.
SOURCE: CDC/NCHS, National Ambulatory Medical Care Survey, 2012.
Summary
Primary health care and community-based prevention efforts have the potential to control the cost and growth of chronic illnesses (1). Visits to office-based physicians and other medical professionals provide patients with the opportunity to receive clinical preventive services that may delay or prevent chronic illness, as well as prevent the subsequent use of emergency or inpatient care (1). In 2012, 61.4 office visits per 100 persons were for preventive care services. The rate of preventive care visits for females was 69% higher than for males. Overall, 58.2% of preventive care visits were made to primary care physicians. The percentage of preventive care visits to primary care physicians made by males (76.3%) was 59% higher than the percentage for females (48.0%). This difference was due to higher female than male percentages of preventive care visits made to non-primary care physicians in the 18–44 and 45–64 age groups. The higher percentage of preventive care visits made to non-primary care physicians among women aged 18–64 compared with similarly aged men may be related to gynecological or obstetric care for women in this age group (2). In 2012, the rate of preventive care visits to primary care physicians per 100 persons exceeded the national rate in one state (Connecticut) and was lower than the national rate in seven states (Arkansas, Indiana, Iowa, Missouri, North Carolina, Pennsylvania, and Washington).
Definition
Primary care physicians: Include office-based physicians in the specialties of family or general medicine, internal medicine, and pediatrics.
Data source and methods
Data for this report are from NAMCS, which is conducted by the Centers for Disease Control and Prevention’s (CDC) National Center for Health Statistics (NCHS). NAMCS is an annual, nationally representative survey of office-based physicians and their visits. The target universe of NAMCS is physicians classified as providing direct patient care in office-based practices. Radiologists, anesthesiologists, and pathologists are excluded. Visits to community health center physicians are also excluded from this analysis. The sample, drawn from the master files of the American Medical Association and American Osteopathic Association, consists of 9,574 physicians.
In 2012, the NAMCS survey sample size was increased fivefold to allow for state-level estimates in the 34 most populous states. The unweighted physician response rate was 58.7% (59.7% weighted). Participating physicians provided 76,330 visit records. The unweighted visit response rate for the 2012 survey was 39.3% (39.4% weighted). Response rates for targeted states ranged from 31.1% to 58.5%, weighted (3).
Data analyses were performed using the statistical packages SAS, version 9.3 (SAS Institute, Cary, N.C.), and SAS-callable SUDAAN, version 11.0 (RTI International, Research Triangle Park, N.C.). The physician office location where the visit occurred was used to generate state-level estimates. Statements of difference in estimates are based on two-tailed t tests with significance at the p < 0.05 level. Terms relating to differences such as “greater than” or “less than” indicate that the difference is statistically significant. A lack of comment regarding the difference between any two estimates does not mean that the difference was tested and found to be not statistically significant.
About the authors
Esther Hing and Michael Albert are with CDC’s National Center for Health Statistics, Division of Health Care Statistics, Ambulatory and Hospital Care Statistics Branch.
References
- Kirk A. Research insights: Prevention and health reform. AcademyHealth Issue Brief. 2009.
- Kale MS, Federman AD, Ross JS. Visits for primary care services to primary care and specialty care physicians, 1999 and 2007. Arch Intern Med 172(18):1421–3. 2012.
- Hing E, Shimizu IM, Talwalkar A. Nonresponse bias in estimates from the 2012 National Ambulatory Medical Care Survey. National Center for Health Statistics. Vital Health Stat 2(171). 2016 [Forthcoming].
Suggested citation
Hing E, Albert M. State variation in preventive care visits, by patient characteristics, 2012. NCHS data brief, no 234. Hyattsville, MD: National Center for Health Statistics. 2016.
Copyright information
All materials appearing in this report is in the public domain and may be reproduced or copied without permission; citation as to source, however, is appreciated.
National Center for Health Statistics
Charles J. Rothwell, M.S., M.B.A., Director
Nathaniel Schenker, Ph.D., Deputy Director
Jennifer H. Madans, Ph.D., Associate Director for Science
Division of Health Care Statistics
Clarice Brown, M.S., Director
Alexander Strashny, Ph.D., Associate Director for Science