Sleep Duration, Quality of Sleep, and Use of Sleep Medication, by Sex and Family Type, 2013–2014
- Key findings
- Overall, single parents with children under age 18 years were more likely to have shorter sleep duration than adults in two-parent families with children under age 18 and adults living without children under age 18.
- Single parents were more likely than adults in two-parent families and adults living without children to have had trouble falling asleep four or more times in the past week.
- Overall, single parents were more likely than adults in other types of families to have had trouble staying asleep four or more times in the past week.
- Roughly one-half of single parents had frequently woken up feeling not well-rested in the past week, compared with only 4 in 10 adults in two-parent families and one-third of adults living without children.
- Adults in two-parent families were less likely than adults in other types of families to have taken medication to help fall or stay asleep four times or more in the past week.
- Summary
- Definitions
- Data source and methods
- About the authors
- References
- Suggested citation
NCHS Data Brief No. 230, January 2016
PDF Version (330 KB)
Colleen N. Nugent, Ph.D.; and Lindsey I. Black, M.P.H.
Key findings
Data from the National Health Interview Survey, 2013–2014
- Single parents, especially women, were more likely than adults in other types of families to have short sleep duration, frequently have trouble falling asleep and staying asleep, and frequently wake up feeling not well-rested.
- Within family types, women were more likely than men to frequently have trouble falling asleep and staying asleep, and to frequently wake up feeling not well-rested.
- Overall, adults in two-parent families were less likely than adults in other types of families to have taken sleep medication four times or more in the past week.
Sleep affects many aspects of well-being and quality of life for people of all ages. Risks associated with deficient or poor-quality sleep include physical health conditions such as diabetes and heart disease (1,2), mental health issues such as depression (3), and driving and workplace accidents (4,5). Nearly one-third of U.S. adults do not meet the recommendation of getting at least 7 hours of sleep daily (6,7). Prior research has found that marital status (8–11) and whether young children live in the household (10–12) are associated with sleep duration and quality. This report describes sleep duration, sleep quality, insomnia symptoms, and the use of sleep medication among U.S. adults, by sex and family type.
Keywords: sleep time, insomnia, family structure, National Health Interview Survey
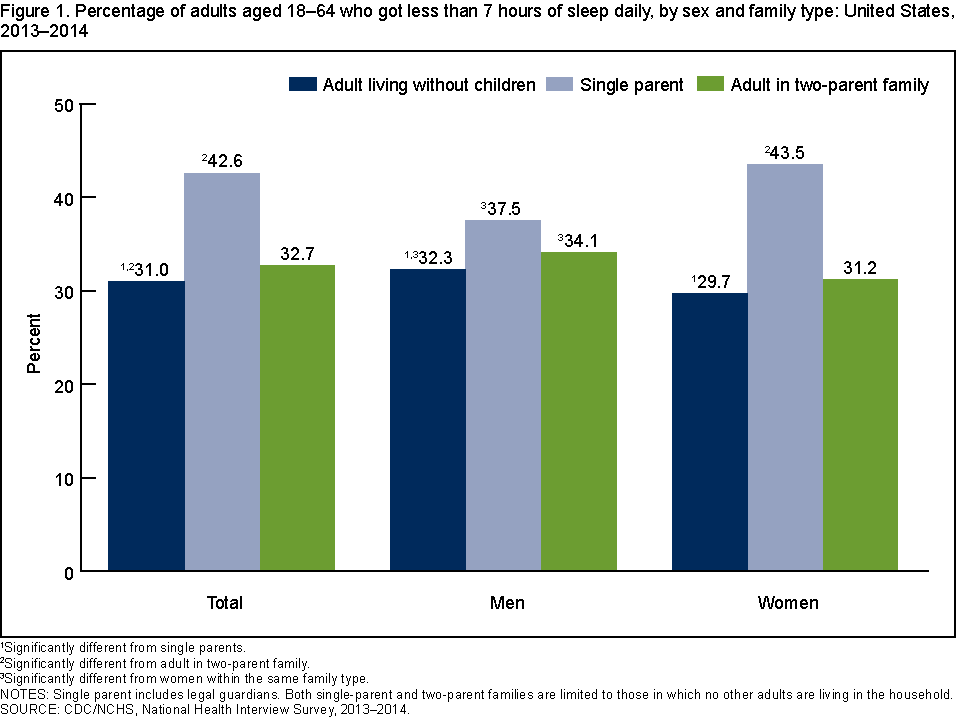
Overall, single parents with children under age 18 years were more likely to have shorter sleep duration than adults in two-parent families with children under age 18 and adults living without children under age 18.
- Among men, single parents with children under age 18 (37.5%) were more likely to get less than 7 hours of sleep in a 24-hour period than adults living without children under age 18 (32.3%) (Figure 1).
- Among women, 43.5% of single parents got less than 7 hours of sleep, which was higher than for adults in two-parent families (31.2%) and adults living without children (29.7%).
- Among single parents, more women (43.5%) than men (37.5%) got less than 7 hours of sleep in a 24-hour period.
- Among adults in two-parent families and adults living without children, men were more likely than women to get less than 7 hours of sleep.
Figure 1. Percentage of adults aged 18–64 who got less than 7 hours of sleep daily, by sex and family type: United States, 2013–2014
1Significantly different from single parents.
2Significantly different from adult in two-parent family.
3Significantly different from women within the same family type.
NOTES: Single parent includes legal guardians. Both single-parent and two-parent families are limited to those in which no other adults are living in the household.
SOURCE: CDC/NCHS, National Health Interview Survey, 2013–2014.
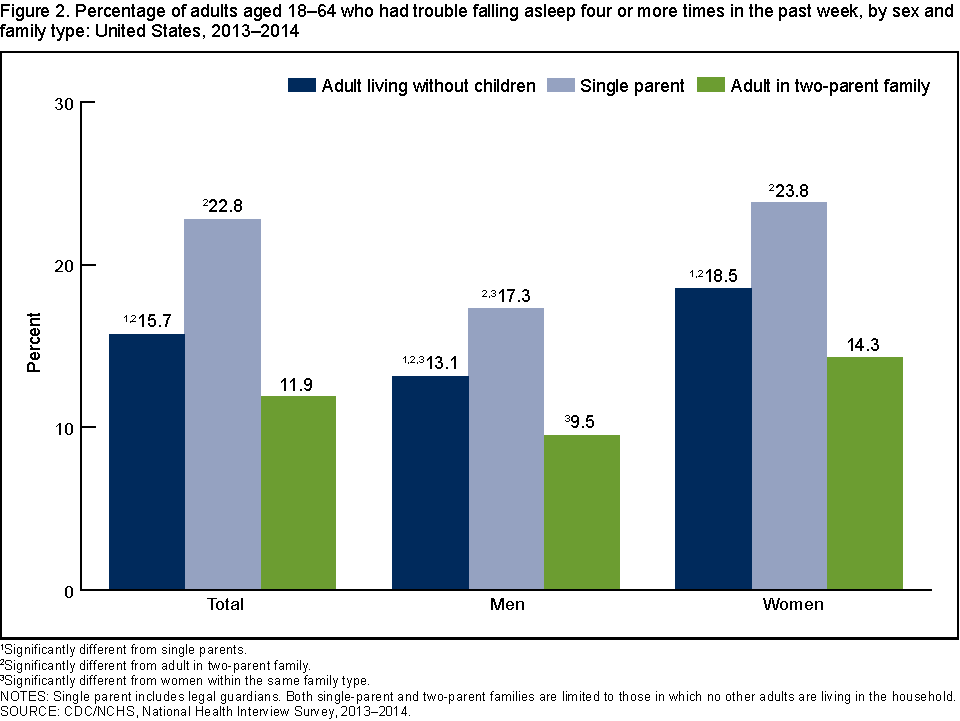
Single parents were more likely than adults in two-parent families and adults living without children to have had trouble falling asleep four or more times in the past week.
- The percentage of male single parents who frequently had trouble falling asleep (17.3%) was higher than for men in two-parent families (9.5%) and men living without children (13.1%) (Figure 2).
- Among women, roughly one-quarter of single parents frequently had trouble falling asleep, which was greater than the 14.3% of women in two-parent families and 18.5% of women living without children who frequently had trouble falling asleep.
- Within every family type, women were more likely than men to frequently have trouble falling asleep.
Figure 2. Percentage of adults aged 18–64 who had trouble falling asleep four or more times in the past week, by sex and family type: United States, 2013–2014
1Significantly different from single parents.
2Significantly different from adult in two-parent family.
3Significantly different from women within the same family type.
NOTES: Single parent includes legal guardians. Both single-parent and two-parent families are limited to those in which no other adults are living in the household.
SOURCE: CDC/NCHS, National Health Interview Survey, 2013–2014.
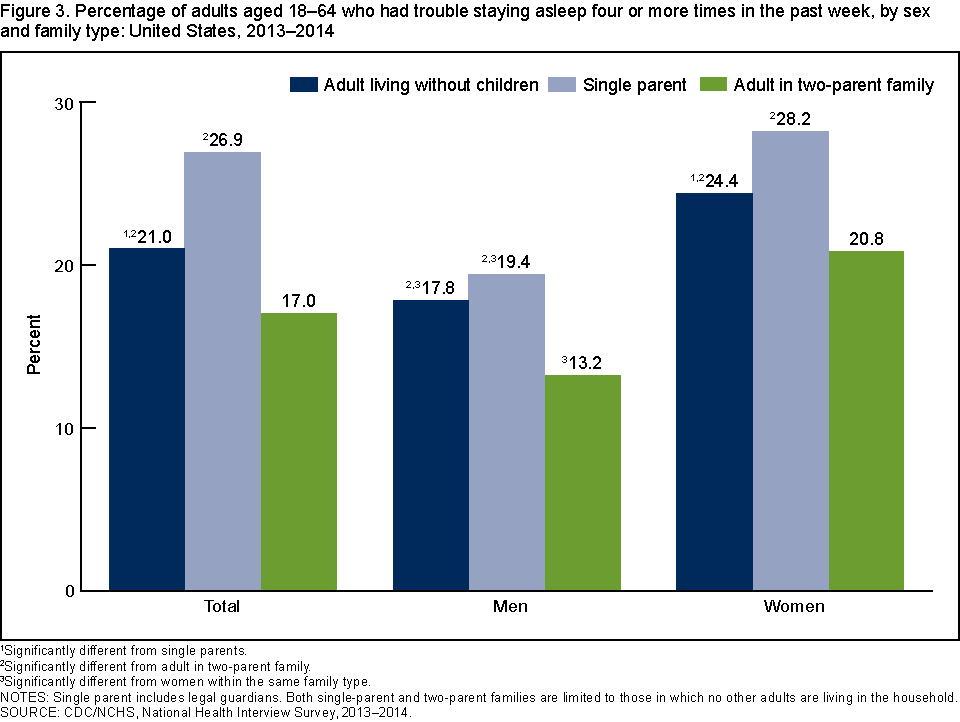
Overall, single parents were more likely than adults in other types of families to have had trouble staying asleep four or more times in the past week.
- For men, a similar percentage of adults living without children (17.8%) and single parents (19.4%) frequently had trouble staying asleep. Both were more likely to frequently have trouble staying asleep than men in two-parent families (13.2%) (Figure 3).
- For women, the percentage of single parents who frequently had trouble staying asleep (28.2%) was higher than for adults living without children (24.4%) and adults in two-parent families (20.8%).
- Women of each family type were more likely than men of the same family type to frequently have trouble staying asleep. For example, nearly 3 in 10 female single parents frequently had trouble staying asleep, compared with 2 in 10 male single parents.
Figure 3. Percentage of adults aged 18–64 who had trouble staying asleep four or more times in the past week, by sex and family type: United States, 2013–2014
1Significantly different from single parents.
2Significantly different from adult in two-parent family.
3Significantly different from women within the same family type
NOTES: Single parent includes legal guardians. Both single-parent and two-parent families are limited to those in which no other adults are living in the household.
SOURCE: CDC/NCHS, National Health Interview Survey, 2013–2014.
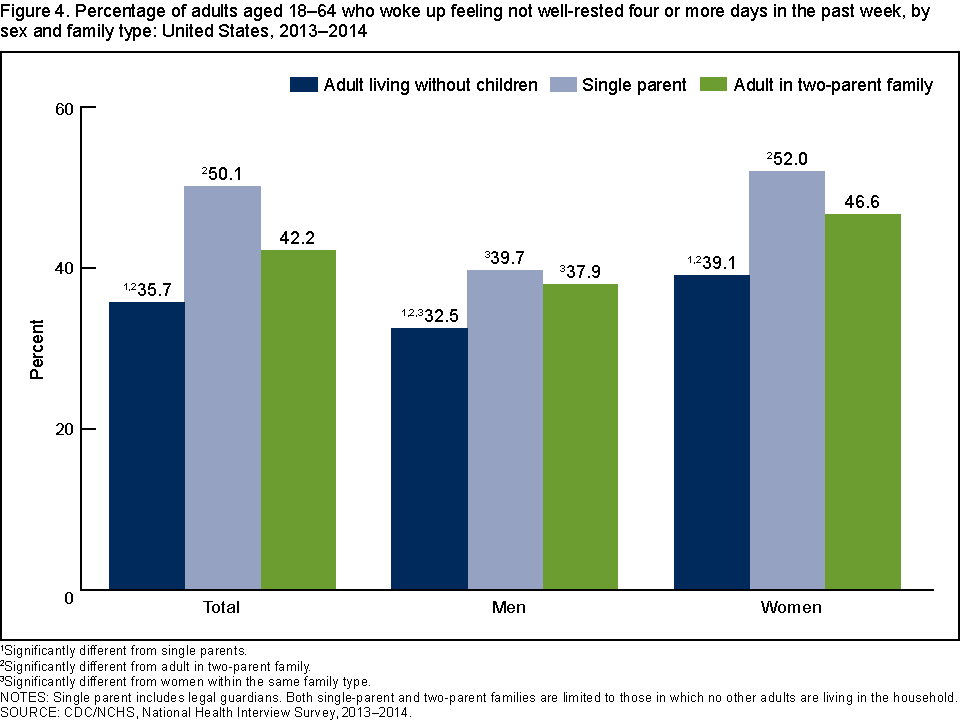
Roughly one-half of single parents had frequently woken up feeling not well-rested in the past week, compared with only 4 in 10 adults in two-parent families and one-third of adults living without children.
- In families with children, male single parents (39.7%) were similar to men in two-parent families (37.9%) in the percentage feeling not well-rested four or more days in the past week. Both were more likely than men living without children (32.5%) to frequently wake feeling not well-rested (Figure 4).
- Among women, the percentage who frequently woke feeling not well-rested was highest for single parents (52.0%) and lowest for those living without children (39.1%).
- Within every family type, women were more likely than men to frequently wake feeling not well-rested.
Figure 4. Percentage of adults aged 18–64 who woke up feeling not well-rested four or more days in the past week, by sex and family type: United States, 2013–2014
1Significantly different from single parents.
2Significantly different from adult in two-parent family.
3Significantly different from women within the same family type.
NOTES: Single parent includes legal guardians. Both single-parent and two-parent families are limited to those in which no other adults are living in the household.
SOURCE: CDC/NCHS, National Health Interview Survey, 2013–2014.
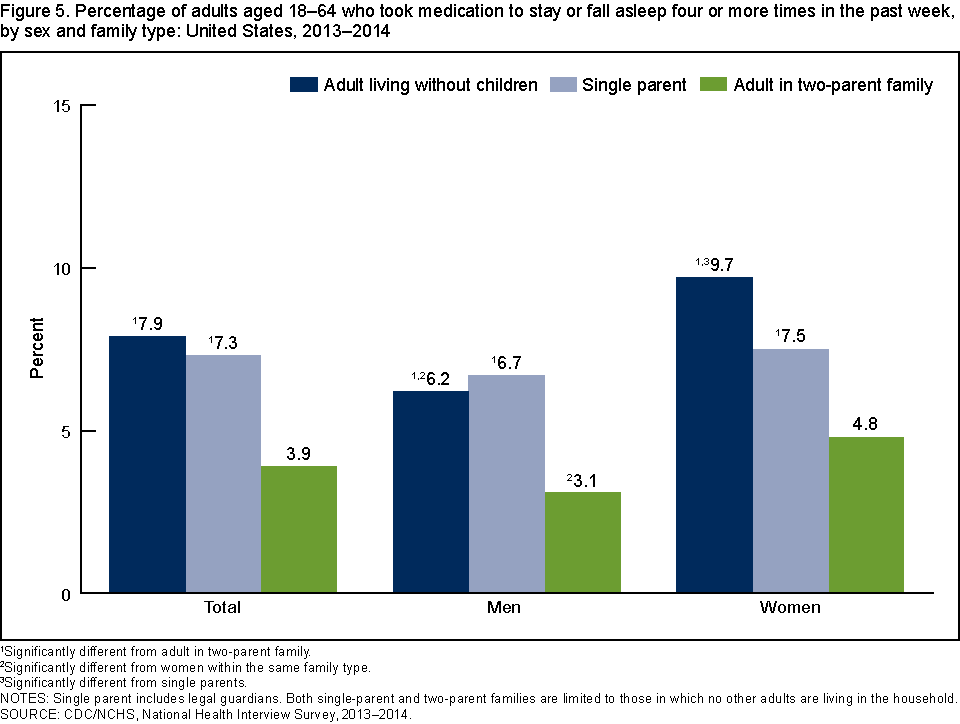
Adults in two-parent families were less likely than adults in other types of families to have taken medication to help fall or stay asleep four times or more in the past week.
- Among men, both adults living in families without children and single parents were twice as likely as men in two-parent families to have frequently taken sleep medication in the past week (Figure 5).
- Among women, the percentage living without children who frequently took sleep medication in the past week (9.7%) was greater than for both female single parents (7.5%) and women in two-parent families (4.8%).
- Among adults living without children and adults in two-parent families, women were more likely than men to have frequently taken sleep medication in the past week.
Figure 5. Percentage of adults aged 18–64 who took medication to stay or fall asleep four or more times in the past week, by sex and family type: United States, 2013–2014
1Significantly different from adult in two-parent family.
2Significantly different from women within the same family type.
3Significantly different from single parents.
NOTES: Single parent includes legal guardians. Both single-parent and two-parent families are limited to those in which no other adults are living in the household.
SOURCE: CDC/NCHS, National Health Interview Survey, 2013–2014.
Summary
Getting sufficient sleep is a national health objective and a public health priority (13). This report describes sleep duration, sleep quality, and use of sleep medication among U.S. men and women, by family type. Overall, results reveal that single parents get less sleep and experience more sleep-related problems than adults in other types of families. Single parents were the most likely to have short sleep duration, more trouble both falling asleep and staying asleep, and to frequently wake feeling not well-rested. Adults in two-parent families were less likely than adults in other types of families to have taken sleep medication frequently in the past week. Women of all family types were more likely than men in the same family type to have more trouble falling asleep and staying asleep, and to frequently wake feeling not well-rested.
Among families with children under age 18, the percentage that are single-parent families has risen to 32% over the past several decades (14). Research has shown that single parents have fewer financial resources (14), and this report finds that sleep is another domain in which single-parent families are disadvantaged.
Definitions
Adult in two-parent family: An adult aged 18–64 living in a family with children under age 18 in which there are two parents in the household but no other adults. Such families include married or cohabiting adults who are both parents of biological or adoptive children under age 18 in the household, or one biological or adoptive parent along with a stepparent.
Adult living without children: An adult aged 18–64 who does not have children under age 18 living at home. The adult may be living alone or with other related adults, such as a spouse or partner or other relative.
Not feeling well-rested: Respondents who answered “3 days or fewer” on the questionnaire item asking, “In the past week, on how many days did you wake up feeling well-rested?”
Short sleep duration: Respondents who answered “6 hours of sleep or less” on the questionnaire item asking, “On average, how many hours of sleep do you get in a 24-hour period?”
Single parent: A biological or adoptive parent or legal guardian aged 18–64 living in a family with children under age 18 in which there are no other adults in the household.
Taking sleep medication: Respondents who answered “four times or more” on the questionnaire item asking, “In the past week, how many times did you take medication to help you fall asleep or stay asleep?”
Trouble falling asleep: Respondents who answered “four times or more” on the questionnaire item asking, “In the past week, how many times did you have trouble falling asleep?”
Trouble staying asleep: Respondents who answered “four times or more” on the questionnaire item asking, “In the past week, how many times did you have trouble staying asleep?”
Data source and methods
The National Health Interview Survey (NHIS) is a nationally representative survey of the civilian noninstitutionalized population of the United States. It is conducted continuously throughout the year by the Centers for Disease Control and Prevention’s (CDC) National Center for Health Statistics (NCHS). NHIS is an in-person interview conducted in the respondent’s home. In some instances, follow-up to complete the interview is by telephone. The survey consists of (a) a Family Core component, with questions asked about all members of the family; (b) a Sample Adult component, which collects additional information from one randomly selected adult per family; and (c) a Sample Child component, which collects additional information about one randomly selected child per family. Data for this analysis come from the Sample Adult and Family Core components of the 2013–2014 NHIS. For more information about NHIS, visit the NHIS website.
For survey items related to sleep, it is unknown whether respondents include naps in their conceptual interpretation of sleep. It is also unknown whether sleep medication is over-the-counter or prescribed by a doctor. The study population includes only adults living in households that contain a single family. Adults living with roommates, nannies, au pairs, or other unrelated persons are not included. In addition, only adults aged 18–64 are included due to differences in the age distribution of adults without children under age 18 compared with parents with children under age 18. In families with children under 18, the sample is further restricted to sample adults who are parents or legal guardians of children in the family, and to only single-parent or two-parent families without other adults.
NHIS is designed to yield a nationally representative sample, and these analyses used weights to produce national estimates. The sample design is described in more detail elsewhere (15). Point estimates and the corresponding variances for this analysis were calculated using SUDAAN software (16) to account for the complex sample design of NHIS. The Taylor series linearization method was used for variance estimation. All estimates shown meet the NCHS standard for reliability (having a relative standard error less than or equal to 30%). Differences between percentages were evaluated using two-sided significance tests at the 0.05 level. All differences reported are significant unless stated otherwise.
About the authors
Colleen N. Nugent and Lindsey I. Black are with CDC’s National Center for Health Statistics, Division of Health Interview Statistics.
References
- Gottlieb DJ, Punjabi NM, Newman AB, Resnick HE, Redline S, Baldwin CM, Nieto FJ. Association of sleep time with diabetes mellitus and impaired glucose tolerance. Arch Intern Med 165(8):863–7. 2005.
- Wolk R, Gami AS, Garcia-Touchard A, Somers VK. Sleep and cardiovascular disease. Curr Probl Cardiol 30(12):625–62. 2005.
- Franzen PL, Buysse DJ. Sleep disturbances and depression: Risk relationships for subsequent depression and therapeutic implications. Dialogues Clin Neurosci 10(4):473–81. 2008.
- Stutts JC, Wilkins JW, Osberg JS, Vaughn BV. Driver risk factors for sleep-related crashes. Accid Anal Prev 35(3):321–31. 2003.
- Uehli K, Mehta AJ, Miedinger D, Hug K, Schindler C, Holsboer-Trachsler E, et al. Sleep problems and work injuries: A systematic review and meta-analysis. Sleep Med Rev 18(1):61–73. 2014.
- Watson NF, Badr MS, Belenky G, Bliwise DL, Buxton OM, Buysse D, et al. Joint consensus statement of the American Academy of Sleep Medicine and Sleep Research Society on the recommended amount of sleep for a healthy adult: Methodology and discussion. J Clin Sleep Med 11(8):931–52. 2015.
- Ford ES, Cunningham TJ, Croft JB. Trends in self-reported sleep duration among US adults from 1985 to 2012. Sleep 38(5):829–32. 2015.
- Hale L. Who has time to sleep? J Public Health (Oxf) 27(2):205–11. 2005.
- Grandner MA, Patel NP, Gehrman PR, Xie D, Sha D, Weaver T, Gooneratne N. Who gets the best sleep? Ethnic and socioeconomic factors related to sleep complaints. Sleep Med 11(5):470–8. 2010.
- Krueger PM, Friedman EM. Sleep duration in the United States: A cross-sectional population-based study. Am J Epidemiol 169(9):1052–63. 2009.
- Chapman DP, Wheaton AG, Perry GS, Sturgis SL, Strine TW, Croft JB. Household demographics and perceived insufficient sleep among US adults. J Community Health 37(2):344–9. 2012.
- Hagen EW, Mirer AG, Palta M, Peppard PE. The sleep-time cost of parenting: Sleep duration and sleepiness among employed parents in the Wisconsin Sleep Cohort Study. Am J Epidemiol 177(5):394–401. 2013.
- U.S. Department of Health and Human Services, Office of Disease Prevention and Health Promotion. Healthy People 2020. Sleep health.
- Vespa J, Lewis JM, Kreider RM. America’s families and living arrangements: 2012. U.S. Census Bureau, Current Population Reports, P20–570. Washington, DC: U.S. Government Printing Office. 2013.
- Parsons VL, Moriarity C, Jonas K, et al. Design and estimation for the National Health Interview Survey, 2006–2015. National Center for Health Statistics. Vital Health Stat 2(165):1–53. 2014.
- RTI International. SUDAAN (Release 11.0.0) [computer software]. 2012.
Suggested citation
Nugent CN, Black LI. Sleep duration, quality of sleep, and use of sleep medication, by sex and family type, 2013–2014. NCHS data brief, no 230. Hyattsville, MD: National Center for Health Statistics. 2016.
Copyright information
All material appearing in this report is in the public domain and may be reproduced or copied without permission; citation as to source, however, is appreciated.
National Center for Health Statistics
Charles J. Rothwell, M.S., M.B.A., Director
Nathaniel Schenker, Ph.D., Deputy Director
Jennifer H. Madans, Ph.D., Associate Director for Science
Division of Health Interview Statistics
Marcie L. Cynamon, Director
Stephen J. Blumberg, Ph.D., Associate Director for Science