Abnormal Cholesterol Among Children and Adolescents in the United States, 2011–2014
- Key findings
- What percentage of children and adolescents had high total cholesterol during 2011–2014?
- What percentage of children and adolescents had low HDL cholesterol during 2011–2014?
- What percentage of children and adolescents had high non-HDL cholesterol during 2011–2014?
- What percentage of children and adolescents had at least one abnormal cholesterol measure during 2011–2014?
- Summary
- Definitions
- Data source and methods
- About the authors
- References
- Suggested citation
NCHS Data Brief No. 228, December 2015
PDF Version (300 KB)
Duong Nguyen, D.O.; Brian Kit, M.D., M.P.H.; and Margaret Carroll, M.S.P.H.
Key findings
Data from the National Health and Nutrition Examination Survey
- One in five youths had high total cholesterol, low high-density lipoprotein (HDL) cholesterol, or high non-HDL cholesterol.
- Prevalence of low HDL cholesterol (13.4%) was greater than high non-HDL cholesterol (8.4%) or high total cholesterol (7.4%).
- Prevalence of high total cholesterol, low HDL cholesterol, and high non-HDL cholesterol was greater in adolescents than children.
- Girls had higher prevalence than boys for high total cholesterol and high non-HDL cholesterol, but lower prevalence for low HDL cholesterol.
- Youth with obesity had greater prevalence of high total cholesterol, low HDL cholesterol, and high non-HDL cholesterol than youth of normal weight.
Cardiovascular disease (CVD) is a leading cause of death among adults in the United States. To improve the cardiovascular health of the U.S. population, clinical practice guidelines (1,2) recommend screening children and adolescents for risk factors associated with CVD, including abnormal blood cholesterol levels. This report provides 2011–2014 estimates from the National Health and Nutrition Examination Survey (NHANES) on the prevalence of high total cholesterol, low high-density lipoprotein (HDL) cholesterol, and high non-HDL cholesterol among children and adolescents aged 6–19.
Keywords: Total cholesterol, HDL cholesterol, non-HDL cholesterol, NHANES
What percentage of children and adolescents had high total cholesterol during 2011–2014?
The prevalence of high total cholesterol among U.S. children and adolescents was 7.4% (Figure 1). The prevalence of high total cholesterol was greater among adolescents aged 16–19 (8.9%) than children aged 6–8 (6.0%). The prevalence of high total cholesterol was lower in boys (5.9%) than in girls (8.9%). The prevalence of high total cholesterol was greater among non-Hispanic black and non-Hispanic Asian children and adolescents and lower among non-Hispanic white and Hispanic children and adolescents. The prevalence of high total cholesterol was greater in children and adolescents with obesity (11.6%) than in those of normal weight (6.3%) and in those who were overweight (6.9%).
Figure 1. Prevalence of high total cholesterol among children and adolescents aged 6–19 years by age, sex, race and Hispanic origin, and body mass index: United States, 2011–2014
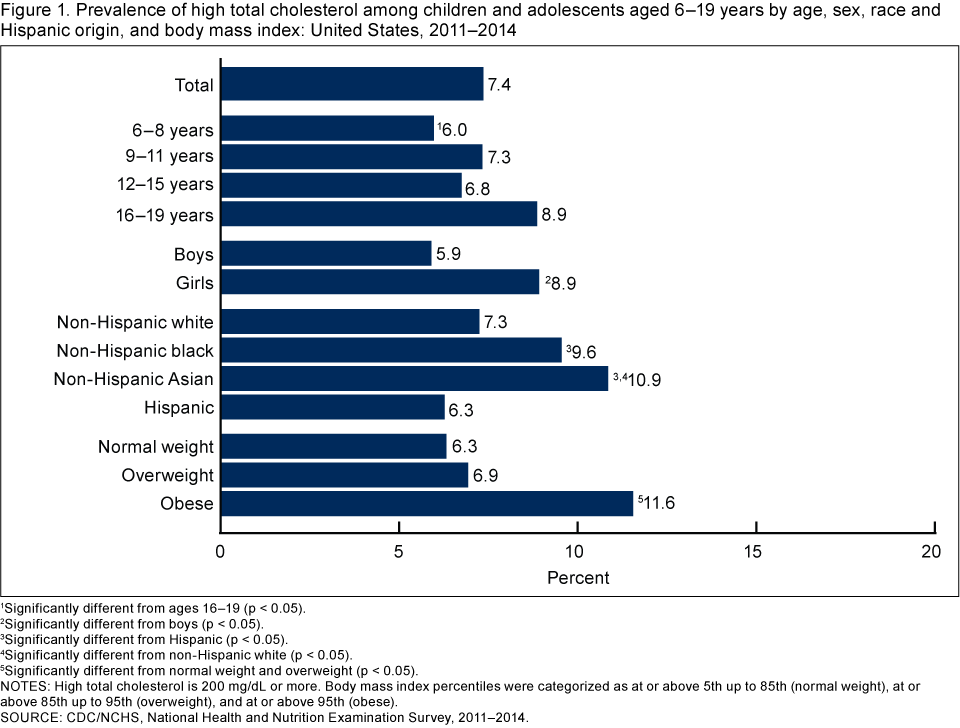
1Significantly different from ages 16–19 (p < 0.05).
2Significantly different from boys (p < 0.05).
3Significantly different from Hispanic (p < 0.05).
4Significantly different from non-Hispanic white (p < 0.05).
5Significantly different from normal weight and overweight (p < 0.05).
NOTES: High total cholesterol is 200 mg/dL or more. Body mass index percentiles were categorized as at or above 5th up to 85th (normal weight), at or above 85th up to 95th (overweight), and at or above 95th (obese).
SOURCE: CDC/NCHS, National Health and Nutrition Examination Survey, 2011–2014.
What percentage of children and adolescents had low HDL cholesterol during 2011–2014?
Overall, 13.4% of all children and adolescents had low HDL cholesterol (Figure 2). There was an increasing age trend in the prevalence of low HDL cholesterol, from 7.7% for children aged 6–8 to 18.4% for adolescents aged 16–19. Boys (14.8%) had a higher prevalence of low HDL cholesterol than girls (12.0%). Both non-Hispanic black (7.4%) and non-Hispanic Asian (8.2%) children and adolescents had a lower prevalence of low HDL cholesterol than non-Hispanic white (14.4%) or Hispanic (15.6%) children and adolescents. The prevalence of low HDL cholesterol increased with increased body mass index (BMI). Furthermore, the prevalence of low HDL cholesterol among children and adolescents with obesity (33.2%) was almost five times higher than for children and adolescents of normal weight (6.8%).
Figure 2. Prevalence of low HDL cholesterol among children and adolescents aged 6–19 years by age, sex, race and Hispanic origin, and body mass index: United States, 2011–2014
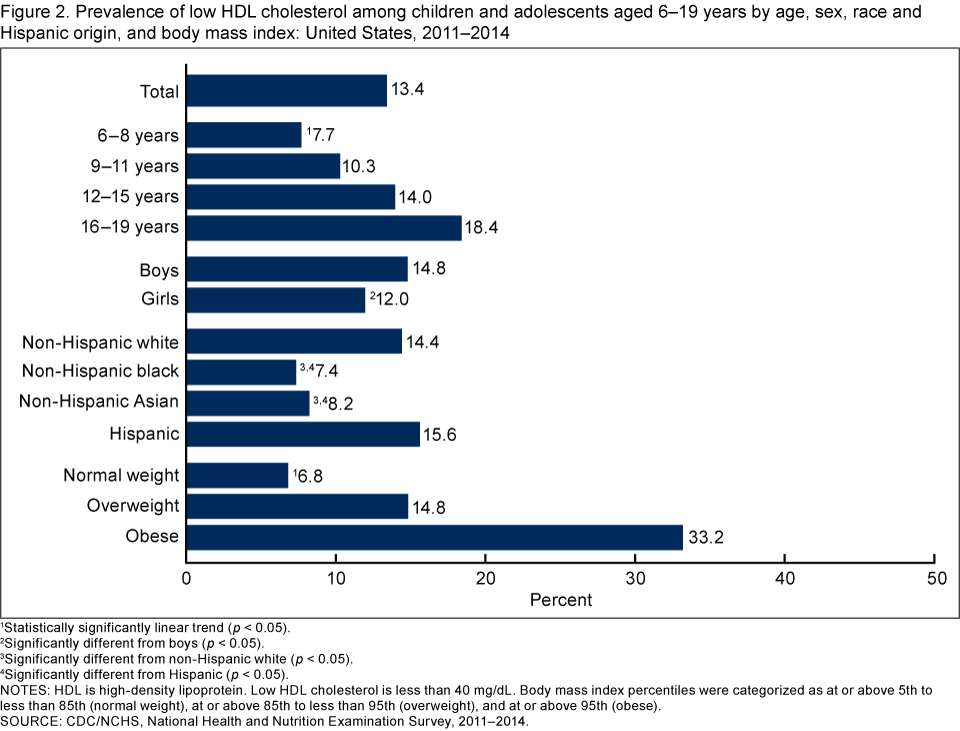
1Statistically significantly linear trend (p < 0.05).
2Significantly different from boys (p < 0.05).
3Significantly different from non-Hispanic white (p < 0.05).
4Significantly different from Hispanic (p < 0.05).
NOTES: HDL is high-density lipoprotein. Low HDL cholesterol is less than 40 mg/dL. Body mass index percentiles were categorized as at or above 5th to less than 85th (normal weight), at or above 85th to less than 95th (overweight), and at or above 95th (obese).
SOURCE: CDC/NCHS, National Health and Nutrition Examination Survey, 2011–2014.
What percentage of children and adolescents had high non-HDL cholesterol during 2011–2014?
The overall prevalence of high non-HDL cholesterol among children and adolescents was 8.4% (Figure 3). The prevalence of high non-HDL cholesterol among adolescents aged 16–19 was higher than among children and adolescents aged 6–8, 9–11, and 12–15, and no differences were seen between children and adolescents in the other age groups. The prevalence of high non-HDL cholesterol was greater in girls (9.4%) than in boys (7.5%), but did not differ among race and Hispanic origin groups. High non-HDL cholesterol prevalence increased with increased BMI, and the prevalence among children and adolescents with obesity (16.7%) was almost three times higher than children and adolescents of normal weight (5.7%).
Figure 3. Prevalence of high non-HDL cholesterol among children and adolescents aged 6–19 years by age, sex, race and Hispanic origin, and body mass index: United States, 2011–2014
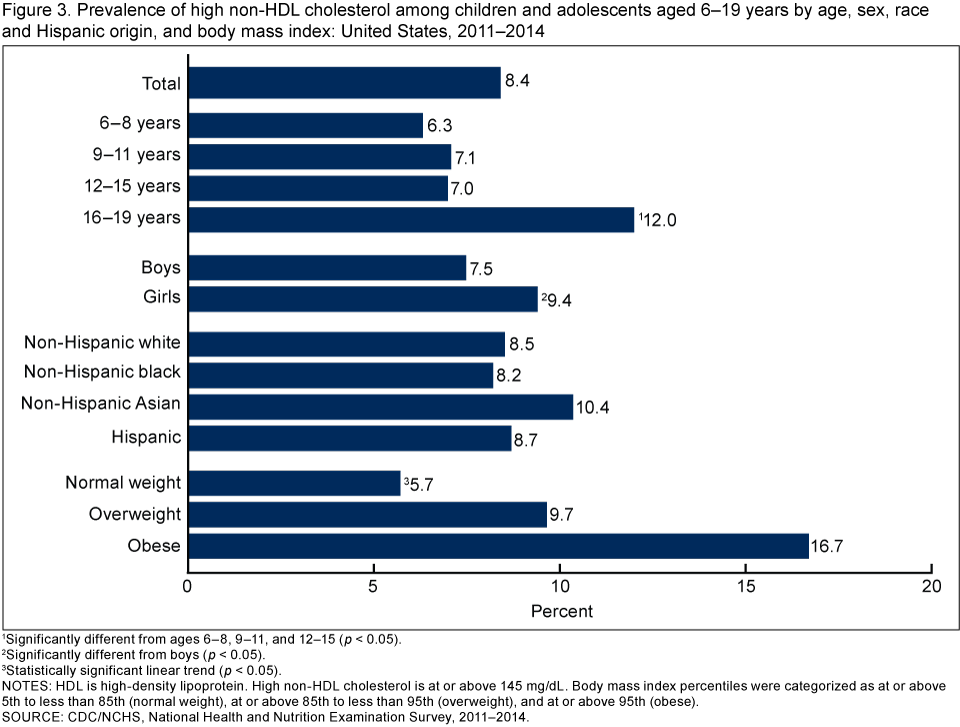
1Significantly different from ages 6–8, 9–11, and 12–15 (p < 0.05).
2Significantly different from boys (p < 0.05).
3Statistically significant linear trend (p < 0.05).
NOTES: HDL is high-density lipoprotein. High non-HDL cholesterol is at or above 145 mg/dL. Body mass index percentiles were categorized as at or above 5th to less than 85th (normal weight), at or above 85th to less than 95th (overweight), and at or above 95th (obese).
SOURCE: CDC/NCHS, National Health and Nutrition Examination Survey, 2011–2014.
What percentage of children and adolescents had at least one abnormal cholesterol measure during 2011–2014?
Overall, 21.0% of children and adolescents in the United States had high total cholesterol, low HDL cholesterol, or high non-HDL cholesterol (Figure 4). The prevalence of having at least one abnormal cholesterol measure increased with age (14.3% for children aged 6–8 to 26.9% for adolescents aged 16–19). No difference was seen in the prevalence of having at least one abnormal cholesterol measure between boys (20.9%) and girls (21.0%). Non-Hispanic black children and adolescents had a lower prevalence of having at least one cholesterol abnormality (17.8%) than non-Hispanic white (21.5%) and Hispanic (22.3%) children and adolescents. The prevalence of having at least one abnormal cholesterol measure increased with increased BMI, and the prevalence among children and adolescents with obesity (43.3%) was more than three times higher than among children and adolescents of normal weight (13.8%).
Figure 4. Prevalence of high total cholesterol, low HDL cholesterol, or high non-HDL cholesterol among children and adolescents aged 6–19 years by age, sex, race and Hispanic origin, and body mass index: United States, 2011–2014
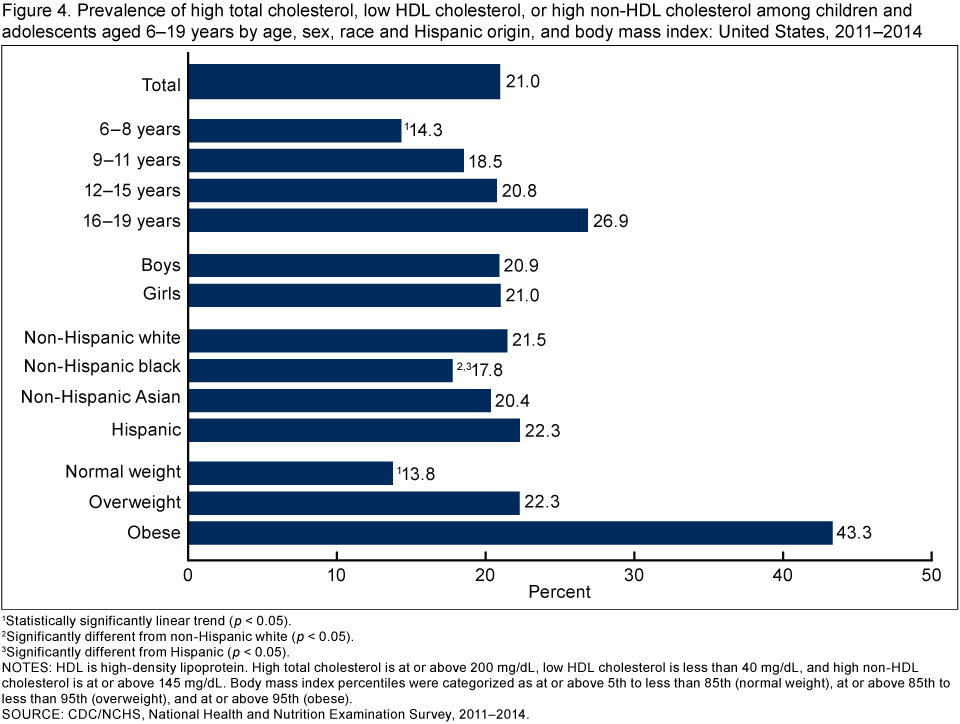
1Statistically significantly linear trend (p < 0.05).
2Significantly different from non-Hispanic white (p < 0.05).
3Significantly different from Hispanic (p < 0.05).
NOTES: HDL is high-density lipoprotein. High total cholesterol is at or above 200 mg/dL, low HDL cholesterol is less than 40 mg/dL, and high non-HDL cholesterol is at or above 145 mg/dL. Body mass index percentiles were categorized as at or above 5th to less than 85th (normal weight), at or above 85th to less than 95th (overweight), and at or above 95th (obese).
SOURCE: CDC/NCHS, National Health and Nutrition Examination Survey, 2011–2014.
Summary
Approximately one out of five children and adolescents (21%) had at least one abnormal cholesterol measure (high total cholesterol, low HDL cholesterol, or high non-HDL cholesterol). Of the three cholesterol measures examined in this report, low HDL cholesterol was the most common abnormality. In general, prevalence of high total cholesterol, low HDL cholesterol, and high non-HDL cholesterol was greater in adolescents aged 16–19 compared with children aged 6–8. Children and adolescents with obesity had the highest prevalence for all cholesterol measures examined, most notably with low HDL cholesterol where prevalence was five times greater among those with obesity than for those of normal weight, similar to previous studies (3).
Some CVD risk factors, including cholesterol, track from childhood into adulthood (4). To identify children with abnormal cholesterol values, clinical practice guidelines endorsed by the American Academy of Pediatrics recommend monitoring cholesterol for all children, including those aged 9–11 years (1,2). In this analysis, 7.4% of children and adolescents aged 6–19 had high total cholesterol. Continued monitoring of abnormal cholesterol levels among children and adolescents may inform public health interventions to promote long-term cardiovascular health and prevent CVD in adulthood.
Definitions
BMI categories: Calculated as weight in kilograms divided by height in meters squared, rounded to one decimal place. The age- and sex-specific percentiles of the 2000 CDC growth charts (5) were used to categorize BMI. BMI percentiles were categorized as follows: at or above 5th to less than 85th (normal weight), at or above 85th to less than 95th (overweight), and at or above 95th (obese).
High non-HDL cholesterol: Serum non-HDL cholesterol at or above 145 mg/dL (1).
High total cholesterol: Serum total cholesterol at or above 200 mg/dL (1).
Low HDL cholesterol: Serum HDL cholesterol less than 40 mg/dL (1).
Data source and methods
Data from the 2011–2012 and 2013–2014 NHANES were used for these analyses. NHANES, conducted by the Centers for Disease Control and Prevention’s (CDC) National Center for Health Statistics (NCHS), is a cross-sectional survey designed to monitor the health and nutritional status of the civilian noninstitutionalized U.S. population. The NHANES sample is selected through a complex, multistage, probability design. In 2011–2012 and 2013–2014, non-Hispanic black, non-Hispanic Asian, and Hispanic persons, and other groups, were oversampled to obtain reliable estimates for these population subgroups. The survey consists of interviews conducted in participants’ homes and standardized physical examinations, including collection of laboratory specimens, conducted in mobile examination centers. Further details regarding NHANES protocols and procedures, including laboratory methods, are available elsewhere (6). Data files for public use are released in 2-year cycles (6).
Statistical analyses were conducted using SAS-callable SUDAAN (SAS version 9.3, SAS Institute, Cary, N.C.; SUDAAN, version 10.0, RTI, Research Triangle Park, N.C.) which estimates standard errors using Taylor Series Linearization to account for the complex sample design. NHANES examination sample weights were used to account for differential probability of selection, noncoverage, and nonresponse to produce national estimates of the civilian noninstitutionalized U.S. population. Participant ages were based on age at time of examination. Analysis is based on measured cholesterol levels only and does not take into account whether cholesterol-lowering medications were used. Pregnant females were excluded from analyses. To maintain confidentiality, data on pregnancy status for females younger than 20 is not publicly released, but may be accessed by contacting the NCHS Research Data Center. Differences between groups were tested using a t statistic at the 0.05 level. All differences reported are statistically significant unless otherwise indicated. To test for linear trends, the null hypothesis of no linear trend was examined using orthogonal polynomials.
About the authors
Duong T. Nguyen is with CDC’s Epidemic Intelligence Service assigned to the National Center for Health Statistics, Division of Health and Nutrition Examination Surveys. Brian K. Kit and Margaret D. Carroll are also with CDC’s National Center for Health Statistics, Division of Health and Nutrition Examination Surveys.
References
- Expert Panel on Integrated Guidelines for Cardiovascular Health and Risk Reduction in Children and Adolescents. Summary report. Pediatrics 128 Suppl 5:S213-56. 2011.
- Committee on Practice and Ambulatory Medicine 2013–2014 and Bright Futures Periodicity Schedule Workgroup. 2015 recommendations for preventive pediatric health care. Pediatrics 136(3):e727. 2015.
- Kit BK, Kuklina E, Carroll MD, Ostchega Y, Freedman DS, Ogden CL. Prevalence of and trends in dyslipidemia and blood pressure among US children and adolescents, 1999–2012. JAMA Pediatr 169(3):272-9. 2015.
- Webber LS, Srinivasan SR, Wattigney WA, Berenson GS. Tracking of serum lipids and lipoproteins from childhood to adulthood. The Bogalusa Heart Study. Am J Epidemiol 133(9):884-99. 1991.
- Kuczmarski RJ, Ogden CL, Guo SS, Grummer-Strawn LM, Flegal KM, Mei Z, et al. 2000 CDC Growth Charts for the United States: Methods and development [PDF – 5.3 MB]. National Center for Health Statistics. Vital Health Stat 11(246). 2002.
- National Center for Health Statistics. National Health and Nutrition Examination Survey: NHANES 2011–2012. Hyattsville, MD.
Suggested citation
Nguyen DT, Kit BK, Carroll MD. Abnormal cholesterol among children and adolescents in the United States, 2011–2014. NCHS data brief, no 228. Hyattsville, MD: National Center for Health Statistics. 2015.
Copyright information
All material appearing in this report is in the public domain and may be reproduced or copied without permission; citation as to source, however, is appreciated.
National Center for Health Statistics
Charles J. Rothwell, M.S., M.B.A., Director
Nathaniel Schenker, Ph.D., Deputy Director
Jennifer H. Madans, Ph.D., Associate Director for Science
Division of Health and Nutrition Examination Surveys
Kathryn S. Porter, M.D., M.S., Director
Ryne Paulose, Ph.D., Associate Director for Science