Total and High-density Lipoprotein Cholesterol in Adults: United States, 2011–2014
- Key findings
- What percentage of adults had high total cholesterol during 2011–2014?
- Were differences seen in the percentage of adults with high total cholesterol by race and Hispanic origin during 2011–2014?
- What percentage of adults had low HDL cholesterol during 2011–2014?
- Were differences seen in the percentage of adults with low HDL cholesterol by race and Hispanic origin during 2011–2014?
- What trends were seen in the percentage of adults with high total cholesterol and the percentage with low HDL cholesterol?
- Summary
- Definitions
- Data source and methods
- About the authors
- References
- Suggested citation
NCHS Data Brief No. 226, December 2015
PDF Version (484 KB)
Margaret D. Carroll, M.S.P.H.; Cheryl D. Fryar, M.S.P.H.; and Brian K. Kit, M.D., M.P.H.
Key findings
Data from the National Health and Nutrition Examination Survey
- During 2011–2014, 12.1% of adults had high total cholesterol and 18.5% had low high-density lipoprotein (HDL) cholesterol.
- The prevalence of high total cholesterol was lower in non-Hispanic black men than in non-Hispanic white, non-Hispanic Asian, and Hispanic men, and lower in non-Hispanic black women than in non-Hispanic white and Hispanic women.
- Low HDL cholesterol prevalence was lower in non-Hispanic black and non-Hispanic Asian men and women than in Hispanic men and women; in non-Hispanic black men and women than in non-Hispanic white men and women; and in non-Hispanic Asian women than in non-Hispanic white women.
- From 2007 to 2014, the percentage of adults with high total and low HDL cholesterol declined.
High levels of total cholesterol and low levels of high-density lipoprotein (HDL) cholesterol (the “good cholesterol”) are risk factors for coronary heart disease (1–3). During 2009–2010, 13.4% of adults had high total cholesterol and 21.3% had low HDL cholesterol (4). This report presents estimates of the percentage of adults with high total and low HDL cholesterol during 2011–2014, and trends in prevalence of high total and low HDL cholesterol from 2007–2008 to 2013–2014. Analysis is based on measured cholesterol only and does not account for cholesterol-lowering medication use.
Keywords: coronary heart disease, trends, NHANES
What percentage of adults had high total cholesterol during 2011–2014?
Approximately 12% of adults had high total cholesterol during the 4-year period. Overall, the percentage with high total cholesterol was lowest for adults aged 20–39 and highest for adults aged 40–59: 7.5% for age group 20–39, 12.9% for 60 and over, and 16.0% for 40–59. The percentage of men with high total cholesterol was higher for those aged 40–59 (15.3%) than for those aged 20–39 (8.2%) or 60 and over (7.3%). The percentage of women with high total cholesterol was lower for those aged 20–39 (6.8%) than for those aged 40–59 (16.7%) or 60 and over (17.7%) (Figure 1).
A lower percentage of men (10.6%) than women (13.0%) had high total cholesterol. The percentage with high total cholesterol did not differ by sex for those aged 20–39 and 40–59, but was lower for men aged 60 and over (7.3%) than for women in the same age group (17.7%).
Figure 1. Prevalence of high total cholesterol among adults aged 20 and over, by sex and age: United States, 2011–2014
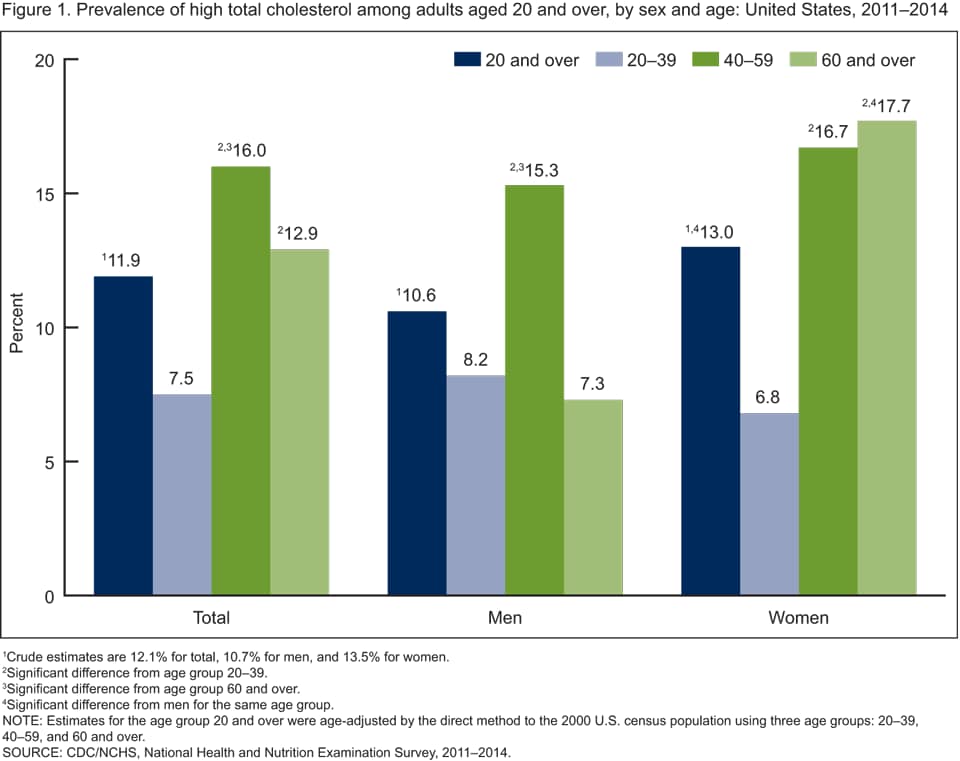
1Crude estimates are 12.1% for total, 10.7% for men, and 13.5% for women.
2Significant difference from age group 20–39.
3Significant difference from age group 60 and over.
4Significant difference from men for the same age group.
NOTE: Estimates for the age group 20 and over were age-adjusted by the direct method to the 2000 U.S. census population using three age groups: 20–39, 40–59, and 60 and over.
SOURCE: CDC/NCHS, National Health and Nutrition Examination Survey, 2011–2014.
Were differences seen in the percentage of adults with high total cholesterol by race and Hispanic origin during 2011–2014?
Overall, the percentage of adults with high total cholesterol was lower for non-Hispanic black (8.6%) than for non-Hispanic white (12.5%) and Hispanic (13.1%) adults. The same race and Hispanic-origin patterns were seen in men (7.3%, 10.8%, and 13.5%, respectively) and in women (9.6%, 13.8%, and 12.5%, respectively). Overall and for men, the prevalence of high total cholesterol was lower in non-Hispanic black than in non-Hispanic Asian subgroups, but this difference was not seen in women. Non-Hispanic white women had higher prevalence of high total cholesterol (13.8%) than non-Hispanic white men (10.8%) (Figure 2).
Figure 2. Age-adjusted prevalence of high total cholesterol among adults aged 20 and over, by sex and race and Hispanic origin: United States, 2011–2014
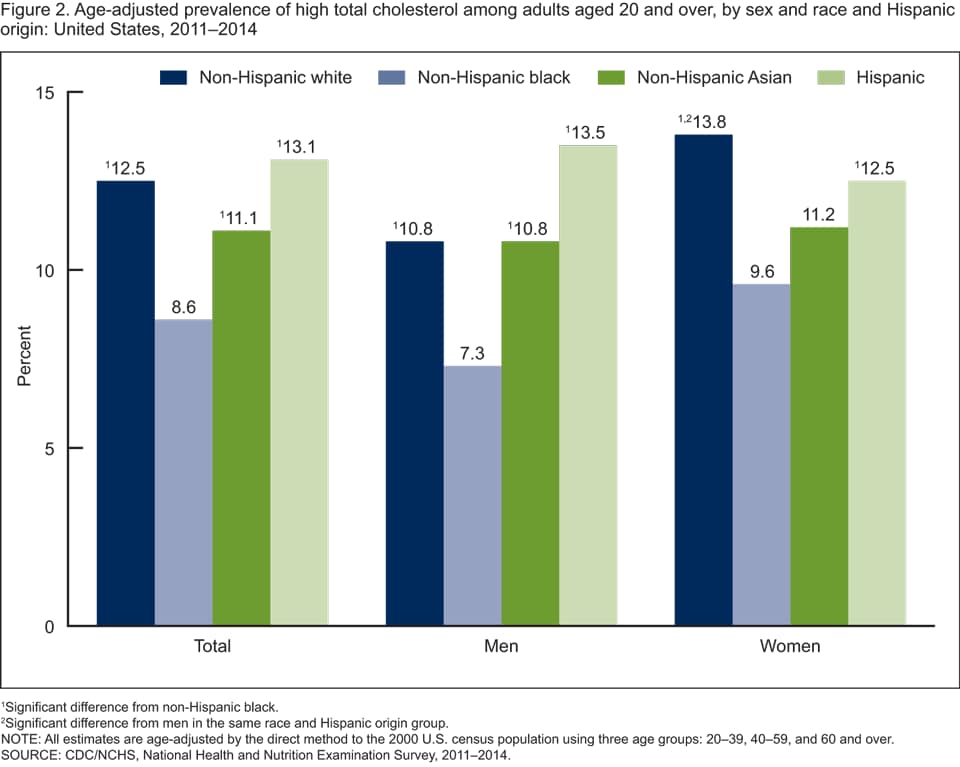
1Significant difference from non-Hispanic black.
2Significant difference from men in the same race and Hispanic origin group.
NOTE: All estimates are age-adjusted by the direct method to the 2000 U.S. census population using three age groups: 20–39, 40–59, and 60 and over.
SOURCE: CDC/NCHS, National Health and Nutrition Examination Survey, 2011–2014.
What percentage of adults had low HDL cholesterol during 2011–2014?
More than 18% of adults aged 20 and over (27.9% of men and approximately 10.0% of women) had low HDL cholesterol over the 4-year period. Overall, the percentage of adults with low HDL cholesterol was lower among those aged 60 and over (15.3%) than among those aged 20–39 (19.5%) or 40–59 (19.8%). A lower percentage of men aged 60 and over (25.0%) than those aged 40–59 (30.2%) had low HDL cholesterol. A lower percentage of women aged 60 and over (7.2%) had low HDL cholesterol compared with those aged 20–39 (11.7%) or 40–59 (9.9%). The percentage with low HDL cholesterol was consistently lower in women than in men in each age group (Figure 3).
Figure 3. Prevalence of low HDL cholesterol among adults aged 20 and over, by sex and age: United States, 2011–2014
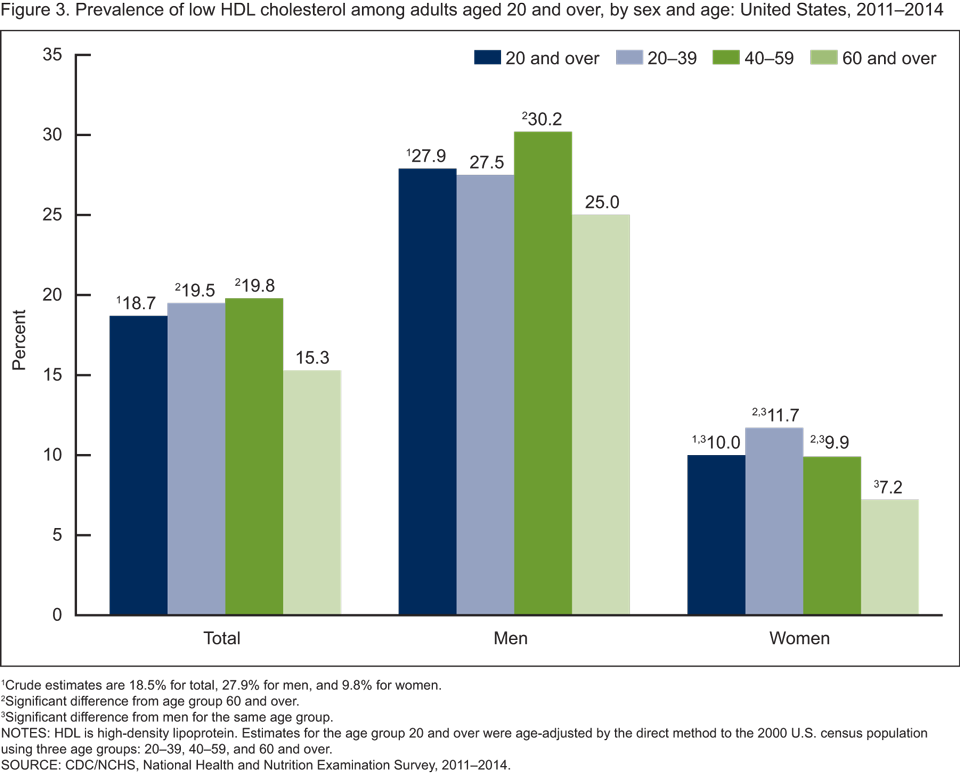
1Crude estimates are 18.5% for total, 27.9% for men, and 9.8% for women.
2Significant difference from age group 60 and over.
3Significant difference from men for the same age group.
NOTES: HDL is high-density lipoprotein. Estimates for the age group 20 and over were age-adjusted by the direct method to the 2000 U.S. census population using three age groups: 20–39, 40–59, and 60 and over.
SOURCE: CDC/NCHS, National Health and Nutrition Examination Survey, 2011–2014.
Were differences seen in the percentage of adults with low HDL cholesterol by race and Hispanic origin during 2011–2014?
Overall, the prevalence of low HDL cholesterol was lower in non-Hispanic black (13.6%) and non-Hispanic Asian (15.2%) adults than in non-Hispanic white (19.1%) and Hispanic (21.1%) adults. The prevalence of low HDL cholesterol was lower in non-Hispanic black (20.7%) and non-Hispanic Asian (25.0%) men than in Hispanic (30.7%) men. A lower percentage of non-Hispanic black men had low HDL cholesterol compared with non-Hispanic white men (28.4%), but no difference was observed between non-Hispanic Asian and non-Hispanic white men. The prevalence of low HDL cholesterol was lower in non-Hispanic black (8.0%) and non-Hispanic Asian (6.7%) women than in non-Hispanic white (10.3%) or Hispanic (11.8%) women. The percentage with low HDL cholesterol was consistently lower in women than in men of the same racial and ethnic group (Figure 4).
Figure 4. Age-adjusted prevalence of low HDL cholesterol among adults aged 20 and over, by sex and race and Hispanic origin: United States, 2011–2014
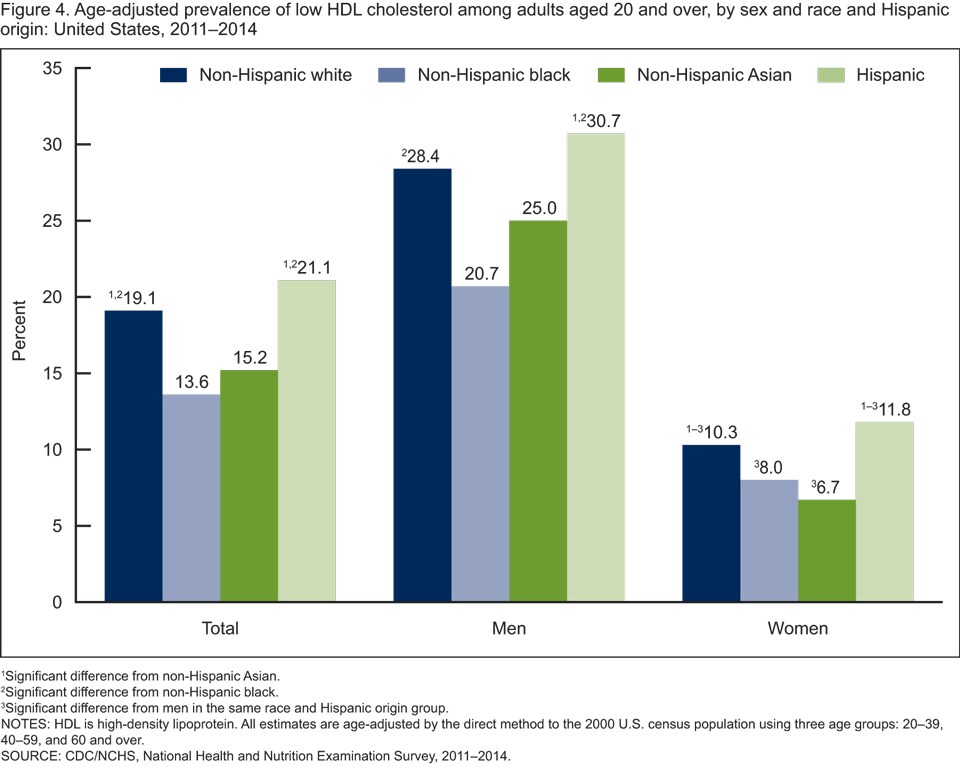
1Significant difference from non-Hispanic Asian.
2Significant difference from non-Hispanic black.
3Significant difference from men in the same race and Hispanic origin group.
NOTES: HDL is high-density lipoprotein. All estimates are age-adjusted by the direct method to the 2000 U.S. census population using three age groups: 20–39, 40–59, and 60 and over.
SOURCE: CDC/NCHS, National Health and Nutrition Examination Survey, 2011–2014.
What trends were seen in the percentage of adults with high total cholesterol and the percentage with low HDL cholesterol?
A declining trend in the percentage of adults aged 20 and over with high total cholesterol was seen from 1999–2000 to 2013–2014 (Figure 5).
From 2007–2008 to 2013–2014, declining trends were seen in the percentage of adults with high total cholesterol (from 14.3% to 11.0%) and in the percentage with low HDL cholesterol (from 22.2% to 19.9%). From 2011–2012 to 2013–2014, a significant decrease was observed in the percentage of adults with high total cholesterol (from 12.9% to 11.0%), but no significant change was seen in the percentage with low HDL cholesterol.
Figure 5. Trends in age-adjusted high total cholesterol and low HDL cholesterol among adults aged 20 and over: United States, 1999–2000 through 2013–2014
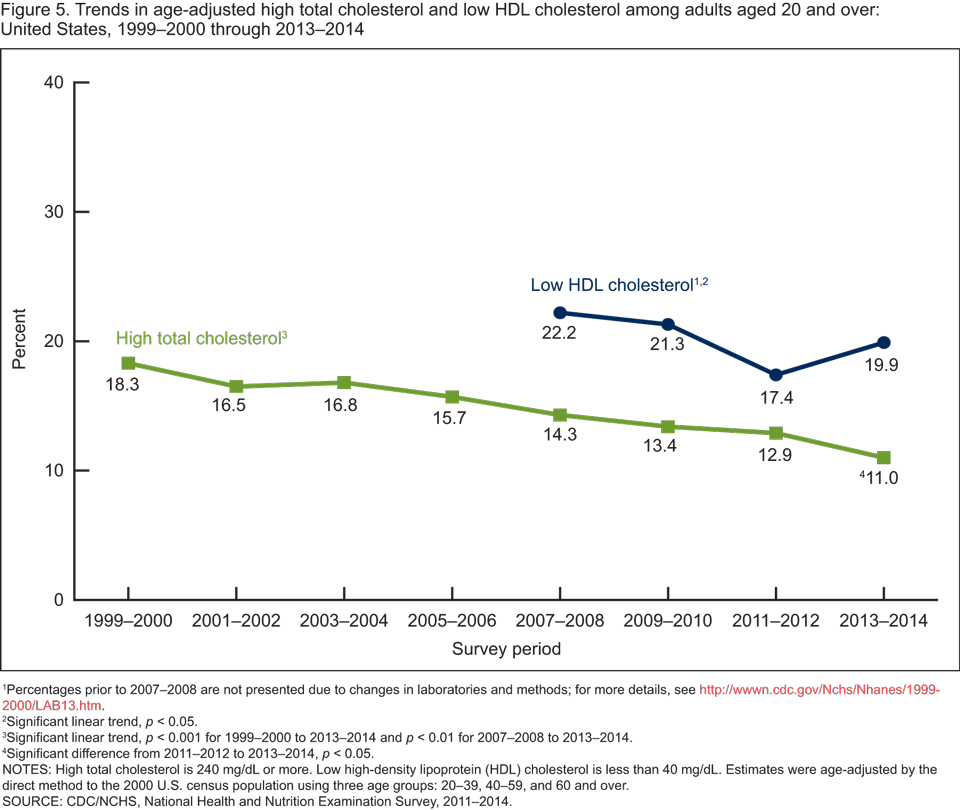
1Percentages prior to 2007–2008 are not presented due to changes in laboratories and methods; for more details, see http://wwwn.cdc.gov/Nchs/Nhanes/1999-2000/LAB13.htm.
2Significant linear trend, p < 0.05.
3Significant linear trend, p < 0.001 for 1999–2000 to 2013–2014 and p < 0.01 for 2007–2008 to 2013–2014.
4Significant difference from 2011–2012 to 2013–2014, p < 0.05.
NOTES: High total cholesterol is 240 mg/dL or more. Low high-density lipoprotein (HDL) cholesterol is less than 40 mg/dL. Estimates were age-adjusted by the direct method to the 2000 U.S. census population using three age groups: 20–39, 40–59, and 60 and over.
SOURCE: CDC/NCHS, National Health and Nutrition Examination Survey, 2011–2014.
Summary
During 2011–2014, approximately 12% of adults had high total cholesterol and nearly 19% had low HDL cholesterol. Overall and when examined by sex, non-Hispanic black adults had a lower prevalence of high total cholesterol than non-Hispanic white and Hispanic adults. Non-Hispanic black men had a lower prevalence of low HDL cholesterol than non-Hispanic white and Hispanic men; non-Hispanic black and non-Hispanic Asian women had lower prevalence of low HDL cholesterol than non-Hispanic white and Hispanic women.
Declining trends between 2007–2008 and 2013–2014 were seen in the prevalence of both high total cholesterol and low HDL cholesterol among adults. These results are based on measured cholesterol only and do not take into account whether cholesterol-lowering medications were taken.
Total cholesterol and HDL cholesterol are two lipid measures that clinicians may use to assess patient health. In fact, clinicians may use both of these lipid measures, in addition to systolic blood pressure, smoking, and diabetes, to calculate the risk of developing diseases associated with atherosclerosis, such as heart disease and stroke (5). Therefore, both of these lipid measures are important to clinical practices designed to reduce cardiovascular disease in the United States.
Total cholesterol is also used to monitor the health of the U.S. population. One of the Healthy People 2020 goals regarding total cholesterol is to reduce the percentage of adults with high total blood cholesterol levels to 13.5% (6). For 2011–2014, approximately 12% of adults aged 20 and over had high total cholesterol, thus meeting this goal. Adults aged 20–39 and 60 and over also achieved this goal, but adults aged 40–59 (16.0%) did not. This target was met in all sex and race and Hispanic-origin groups except for non-Hispanic white women (13.8%).
Definitions
High total cholesterol: Serum total cholesterol greater than or equal to 240 mg/dL.
Low HDL cholesterol: Serum HDL cholesterol less than 40 mg/dL.
Healthy People 2020; Heart Disease and Stroke, Object 7: Reduce the proportion of adults with high total blood cholesterol levels, target: 13.5% (6).
Data source and methods
Data from eight 2-year cycles of the National Health and Nutrition Examination Survey (NHANES) from 1999–2000 through 2013–2014 were used for these analyses. Data from NHANES 2011–2014 (4 years of data) were used to test differences between demographic subgroups, thus increasing the sample size, the precision of the estimated percentages, and the ability to detect a difference in the prevalence when a difference does indeed exist. In testing for trends in high total and low HDL cholesterol, the eight 2-year cycles were used.
NHANES is a cross-sectional survey designed to monitor the health and nutritional status of the civilian noninstitutionalized U.S. population using highly stratified multistage probability designs (7). The survey, conducted by the Centers for Disease Control and Prevention’s (CDC) National Center for Health Statistics (NCHS), consists of interviews conducted in participants’ homes and standardized physical examinations conducted in mobile examination centers.
For 2011–2012 and 2013–2014, non-Hispanic black, non-Hispanic Asian, and Hispanic persons, among other groups, were oversampled to obtain reliable estimates for these population subgroups. Specific race and Hispanic-origin estimates reflect persons reporting only one race. Those reporting more than one race are included in the total only and are not reported separately.
Examination sample weights, which account for the differential selection probabilities and adjust for nonresponse and noncoverage, were used in estimating the prevalence of high total cholesterol and low HDL cholesterol. Standard errors were estimated by Taylor series linearization (8), a design-based method.
Prevalence estimates were age-adjusted using the direct method to the 2000 U.S. census population (9) using three age groups: 20–39, 40–59, and 60 and over. Differences between groups were tested using a t statistic at the p < 0.05 significance level. Linear trends were tested using orthogonal contrast matrices. All differences reported are statistically significant unless otherwise indicated. Adjustments were not made for multiple comparisons. Statistical analyses were conducted using the SAS System for Windows, release 9.3 (SAS Institute, Inc., Cary, N.C.) and SUDAAN, release 11.1 (RTI International, Research Triangle Park, N.C.).
About the authors
Margaret D. Carroll, Cheryl D. Fryar, and Brian K. Kit are with CDC’s National Center for Health Statistics, Division of Health and Nutrition Examination Surveys.
References
- Wilson PW, D’Agostino RB, Levy D, Belanger AM, Silbershatz H, Kannel WB. Prediction of coronary heart disease using risk factor categories. Circulation 97(18):1837–47. 1998.
- Stamler J, Wentworth D, Neaton JD. Is the relationship between serum cholesterol and risk of premature death from coronary heart disease continuous or graded? Findings in 356,222 primary screenees of the Multiple Risk Factor Intervention Trial (MRFIT). JAMA 256(20):2823–8. 1986.
- Assmann G, Schulte H, von Eckardstein A, Huang Y. High-density lipoprotein cholesterol as a predictor of coronary heart disease risk: The PROCAM experience and pathophysiological implications for reverse cholesterol transport. Atherosclerosis 124 Suppl:S11–20. 1996.
- Carroll MD, Kit BK, Lacher DA. Total and high-density lipoprotein cholesterol in adults: National Health and Nutrition Examination Survey, 2009–2010. NCHS data brief, no 92. Hyattsville, MD: National Center for Health Statistics. 2012.
- Stone NJ, Robinson JG, Lichtenstein AH, Bairey Merz CN, Blum CB, Eckel RH, et al. 2013 ACC/AHA guideline on the treatment of blood cholesterol to reduce atherosclerotic cardiovascular risk in adults: A report of the American College of Cardiology/American Heart Association Task Force on Practice Guidelines. J Am Coll Cardiol 63(25 Pt B):2889–934. 2014.
- U.S. Department of Health and Human Services, Office of Disease Prevention and Health Promotion. Healthy People 2020 topics and objectives: Heart disease and stroke. Washington, DC.
- National Center for Health Statistics. National Health and Nutrition Examination Survey: Questionnaires, datasets, and related documentation.
- Wolter KM. Taylor series methods. In: Introduction to variance estimation. 2nd ed. New York, NY: Springer Science+Business Media. 2007.
- Klein RJ, Schoenborn CA. Age adjustment using the 2000 projected U.S. population. Healthy People 2010 Statistical Notes, no 20. Hyattsville, MD: National Center for Health Statistics. 2001.
Suggested citation
Carroll MD, Fryar CD, Kit BK. Total and high-density lipoprotein cholesterol in adults: United States, 2011–2014. NCHS data brief, no 226. Hyattsville, MD: National Center for Health Statistics. 2015.
Copyright information
All material appearing in this report is in the public domain and may be reproduced or copied without permission; citation as to source, however, is appreciated.
National Center for Health Statistics
Charles J. Rothwell, M.S., M.B.A., Director
Nathaniel Schenker, Ph.D., Deputy Director
Jennifer H. Madans, Ph.D., Associate Director for Science
Division of Health and Nutrition Examination Surveys
Kathryn S. Porter, M.D., M.S., Director
Ryne Paulose-Ram, Ph.D., Associate Director for Science