Variation in Operating Characteristics of Adult Day Services Centers, by Center Ownership: United States, 2014
- Key findings
- In 2014, a higher percentage of nonprofit than for-profit adult day services centers had been in operation for 10 years or more.
- Sources of adult day services center revenue varied by center ownership.
- A higher percentage of for-profit than nonprofit adult day services centers offered disease-specific programs for select conditions.
- A higher percentage of nonprofit than for-profit adult day services centers primarily served participants with select diagnoses.
- Summary
- Definitions
- Data source and methods
- About the authors
- References
- Suggested citation
NCHS Data Brief No. 224, December 2015
PDF Version (639 KB)
Vincent Rome, M.P.H.; Lauren D. Harris-Kojetin, Ph.D.; and Eunice Park-Lee, Ph.D.
Key findings
Data from the 2014 National Study of Long-Term Care Providers
- In 2014, a higher percentage of nonprofit (71%) than for-profit (46%) adult day services centers had been in operation for 10 years or more.
- Compared with nonprofit centers, for-profit centers received a higher percentage of revenue from Medicaid and a lower percentage from private sources.
- A higher percentage of for-profit than nonprofit centers offered disease-specific programs for participants with cardiovascular disease, depression, and diabetes.
- A higher percentage of nonprofit than for-profit adult day services centers primarily served participants with select diagnoses.
More than one-quarter of a million participants were enrolled in 4,800 adult day services centers in the United States in 2014 (1,2). Unlike other long-term care providers, such as nursing homes, home health agencies, hospices, and residential care communities, the majority of adult day services centers are nonprofit (3). However, for-profit ownership of adult day services centers has increased, from 27% in 2010 to 40% in 2012, and more recently to 44% in 2014 (4,5). This report presents the most current national estimates of selected adult day services center operating characteristics, and compares these characteristics by center ownership. State estimates for the characteristics presented in this data brief are available online.
Keyword: National Study of Long-Term Care Providers
In 2014, a higher percentage of nonprofit than for-profit adult day services centers had been in operation for 10 years or more.
- About 7 in 10 nonprofit and 5 in 10 for-profit centers had been in operation 10 years or more (Figure 1).
- Similar percentages of nonprofit (43%) and for-profit (41%) centers were chain-affiliated.
- Fifteen percent of nonprofit and 12% of for-profit centers had one or more participants who had stopped using the center in the last 12 months because of cost.
Figure 1. Selected operating characteristics of adult day services centers, by center ownership: United States, 2014
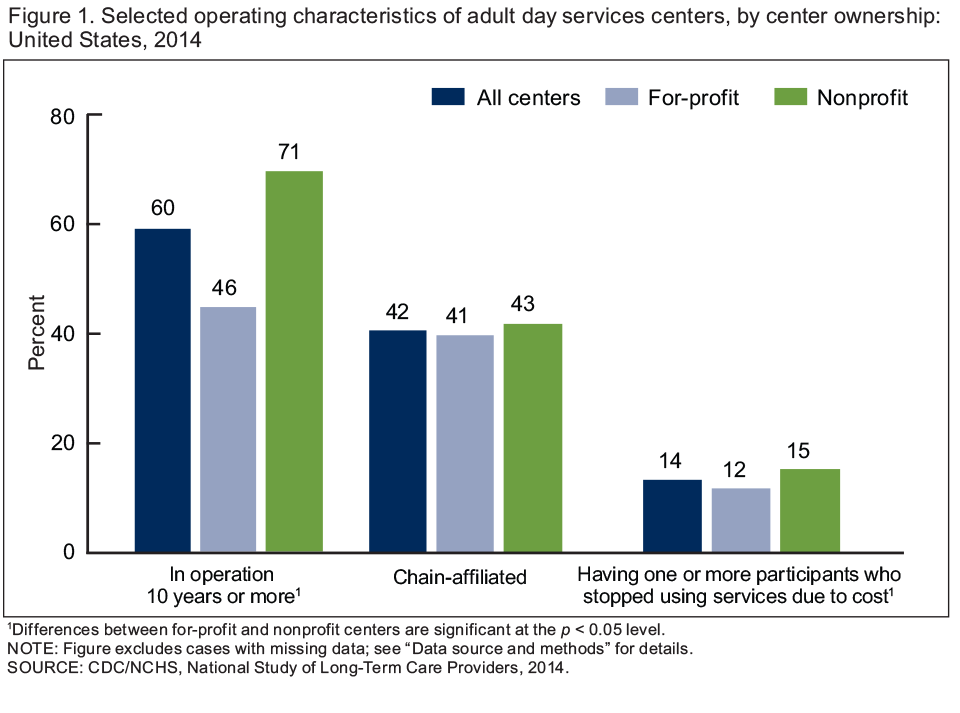
1Differences between for-profit and nonprofit centers are significant at the p < 0.05 level.
NOTE: Figure excludes cases with missing data; see “Data source and methods” for details.
SOURCE: CDC/NCHS, National Study of Long-Term Care Providers, 2014.
Sources of adult day services center revenue varied by center ownership.
- Among nonprofit centers, 41% of revenue was from Medicaid, compared with 65% among for-profit centers (Figure 2).
- More than one-quarter of revenue among nonprofit centers was from other government sources (29%), compared with 16% among for-profit centers.
- Twenty-one percent of revenue among nonprofit centers was from private sources, compared with 13% among for-profit centers.
Figure 2. Revenue among adult day services centers, by source and center ownership: United States, 2014
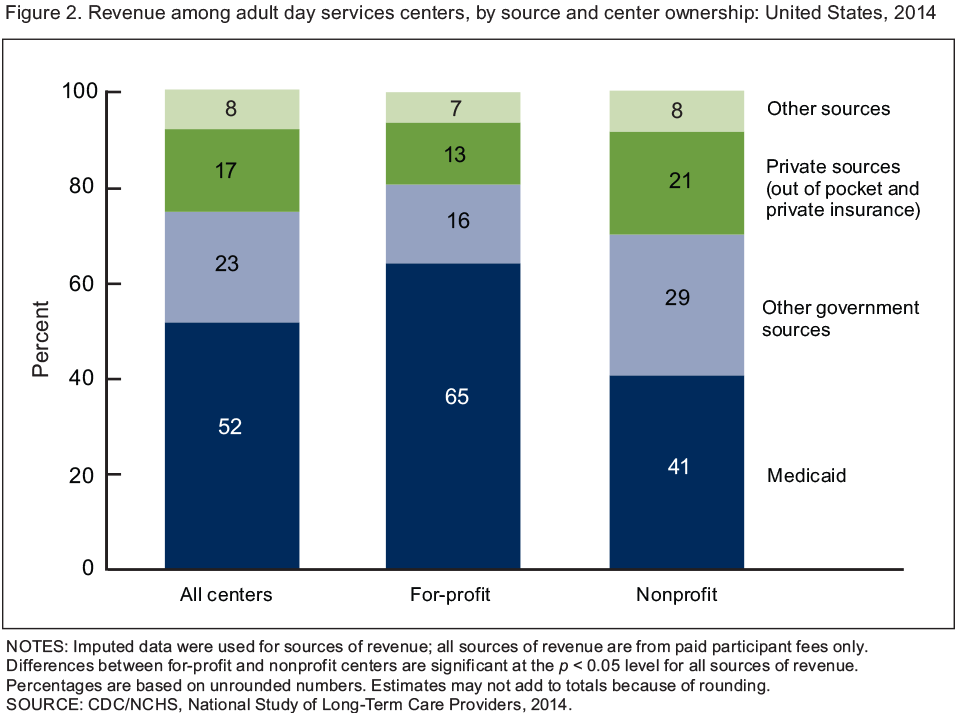
NOTES: Imputed data were used for sources of revenue; all sources of revenue are from paid participant fees only. Differences between for-profit and nonprofit centers are significant at the p < 0.05 level for all sources of revenue. Percentages are based on unrounded numbers. Estimates may not add to totals because of rounding.
SOURCE: CDC/NCHS, National Study of Long-Term Care Providers, 2014.
A higher percentage of for-profit than nonprofit adult day services centers offered disease-specific programs for select conditions.
- Similar percentages of for-profit (70%) and nonprofit centers (68%) offered disease-specific programs for participants with Alzheimer’s disease or other dementias (Figure 3).
- Among for-profit centers, 72% offered disease-specific programs for participants with diabetes, compared with 58% of nonprofit centers.
- A higher percentage of for-profit (67%) than nonprofit (52%) centers offered disease-specific programs for participants with cardiovascular disease.
- Similarly, a higher percentage of for-profit (61%) than nonprofit (49%) centers offered disease-specific programs for participants with depression.
Figure 3. Disease-specific programs offered for selected conditions among adult day services centers, by center ownership: United States, 2014
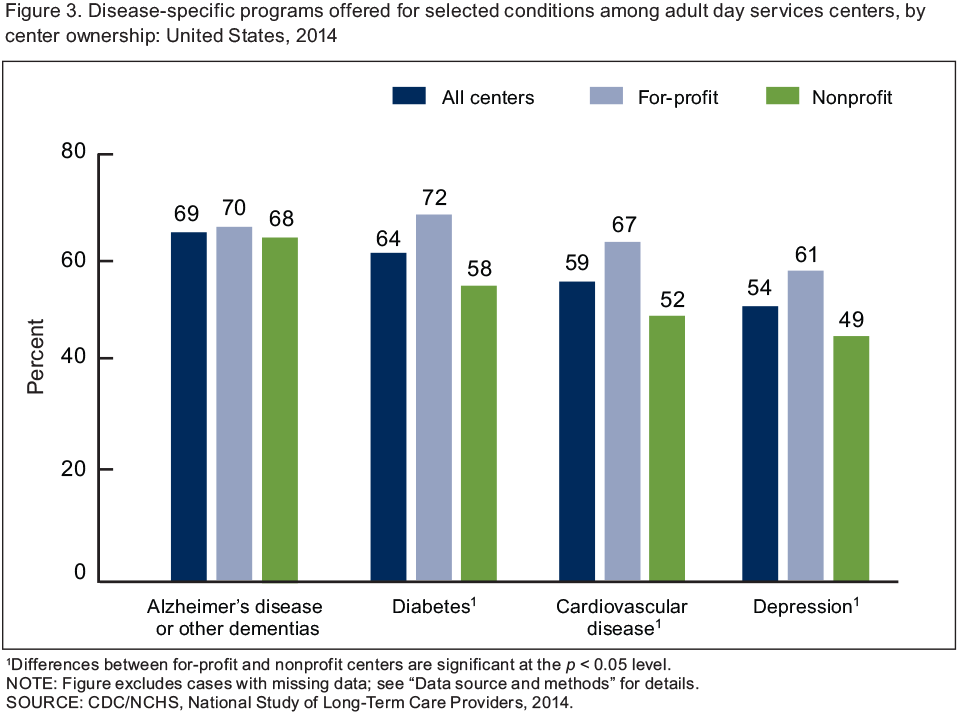
1Differences between for-profit and nonprofit centers are significant at the p < 0.05 level.
NOTE: Figure excludes cases with missing data; see “Data source and methods” for details.
SOURCE: CDC/NCHS, National Study of Long-Term Care Providers, 2014.
A higher percentage of nonprofit than for-profit adult day services centers primarily served participants with select diagnoses.
- Almost one-quarter of nonprofit centers primarily served participants with a diagnosis of intellectual or developmental disability (24%), compared with 17% of for-profit centers (Figure 4).
- Among nonprofit centers, 18% primarily served participants with a diagnosis of Alzheimer’s disease or other dementias, compared with 10% of for-profit centers.
Figure 4. Adult day services centers that primarily serve participants with a specific diagnosis, by center ownership: United States, 2014
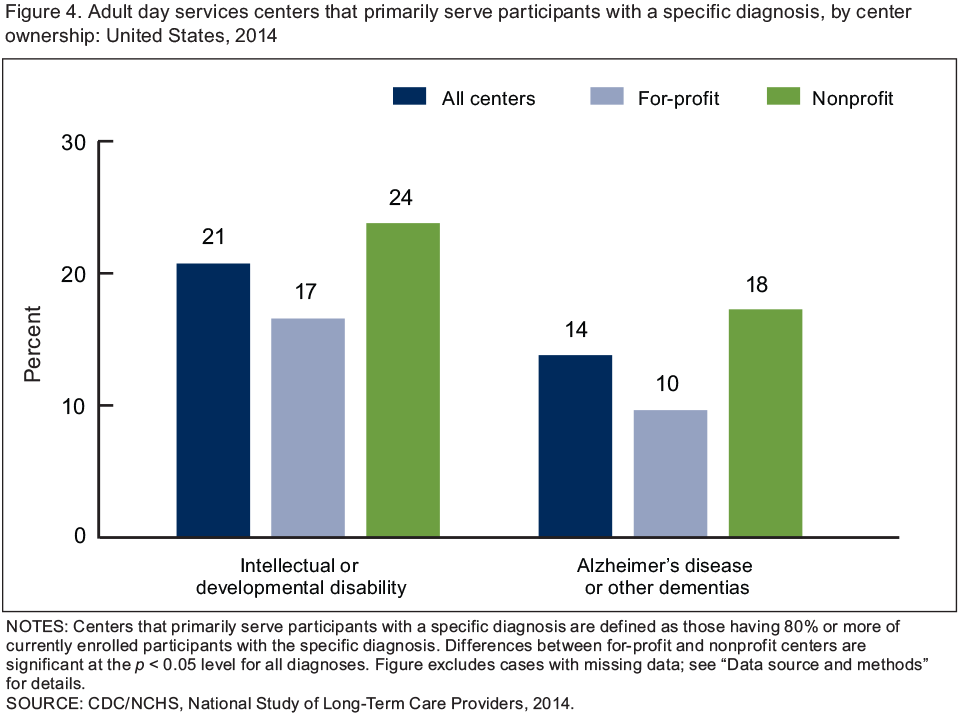
NOTES: Centers that primarily serve participants with a specific diagnosis are defined as those having 80% or more of currently enrolled participants with the specific diagnosis. Differences between for-profit and nonprofit centers are significant at the p < 0.05 level for all diagnoses. Figure excludes cases with missing data; see “Data source and methods” for details.
SOURCE: CDC/NCHS, National Study of Long-Term Care Providers, 2014.
Summary
In 2014, adult day services centers differed by ownership on a variety of operating characteristics, including years in operation, chain affiliation, programs offered, revenue sources, and the diagnoses of participants served. A lower percentage of for-profit than nonprofit centers had been in operation for 10 years or more. For-profit centers received a lower percentage of their revenue from private sources (e.g., out-of-pocket payments by participant or family and private insurance), and a higher percentage from Medicaid, compared with nonprofit centers.
A higher percentage of for-profit than nonprofit centers offered disease-specific programming for participants with diabetes, cardiovascular disease, and depression. Although a similar percentage of for-profit and nonprofit centers offered disease-specific programs for Alzheimer’s disease or other dementias, a lower percentage of for-profit than nonprofit centers primarily served participants with a diagnosis of Alzheimer’s disease or other dementias or with an intellectual or developmental disability.
Findings on differences by center ownership provide useful information to policy makers, providers, researchers, and consumer advocates as they plan to meet the needs of seniors and persons with disabilities. Corresponding state estimates and their standard errors for the national figures in this data brief are available in a supplemental table.
Definitions
Adult day services center: A community-based center that provides an array of long-term care services including structured activities, health monitoring, socialization, or assistance with activities of daily living to seniors or younger adults with disabilities. These centers are generally open 5 days a week for a minimum of 6 hours a day.
Cardiovascular disease: Includes conditions such as heart disease, stroke, and high blood pressure.
Centers primarily serving participants diagnosed with a specific condition: Based on centers having 80% or more of currently enrolled participants with the specific diagnosis. The methodology used to determine the cutoff for communities that primarily serve specific populations of participants was derived from a recent study (6).
Chain affiliation: Ownership by a person, group, or organization that owns or manages two or more adult day services centers, including corporate chains.
Disease-specific programs: Programs that target participants who have a specific diagnosis and may include one or more of the following services—educational, physical activity, diet or nutrition, medication management, and weight management programs.
Ownership type: Categorization of adult day services centers into two ownership types, for-profit and nonprofit. For-profit includes private, publicly traded, and limited liability centers. Nonprofit includes private as well as federal, state, county, and local government-owned centers.
Revenue among adult day services centers: Reflects sources of revenue from paid participant fees only. Other government sources include the percentage of center revenue from Medicare, U.S. Department of Veterans Affairs, area agencies on aging, state and local government sources, Older Americans Act, and other government sources not including Medicaid. Private sources include the percentage of center revenue from private insurance and out-of-pocket payments by participants and families.
Data source and methods
Data are from the Adult Day Services Center Survey component of the 2014 wave of the biennial National Study of Long-Term Care Providers (NSLTCP), conducted by the Centers for Disease Control and Prevention’s (CDC) National Center for Health Statistics. The survey used a census of adult day services centers in the National Adult Day Services Association’s database. To be eligible for the study, an adult day services center must: a) have been in operation as of March 28, 2014; b) be licensed or certified by the state specifically to provide adult day services, or authorized or otherwise set up to participate in Medicaid; c) have average daily attendance of one or more participants based on a typical week; and d) have one or more participants enrolled at the center at the designated location at the time of the survey. More details about the NSLTCP survey design and outcomes are published elsewhere (1,7).
Although, 4,800 adult day services centers operate nationwide, the analyses in this data brief are based on the 4,700 adult day services centers for which ownership status was known; 50 centers were excluded from the analyses because ownership status was unknown. The weighted frequencies for for-profit and nonprofit centers do not add up to 4,800 due to rounding.
Differences among subgroups were evaluated using chi-square and t tests. All statistical significance tests were two-sided, using p < 0.05 as the level of significance. All differences reported are statistically significant unless otherwise indicated. Data analyses were performed using both SAS version 9.3 (8) and SAS-callable SUDAAN version 11.0.0 statistical packages (9) and Stata/SE version 12.1 (10). Imputed data were used for sources of revenue in Figure 2. About 4% of cases were missing for Medicaid, Medicare, other government, out-of-pocket, and private insurance sources of revenue from paid participant fees. About 5% of cases were missing for “other sources” of revenue from paid participant fees. For all other variables, the percentage of cases with missing data was less than 4.3%; cases with missing data were excluded from the analyses on a variable-by-variable basis. Because estimates were rounded, individual estimates may not sum to totals.
About the authors
Vincent Rome, Lauren D. Harris-Kojetin, and Eunice Park-Lee are with the CDC’s National Center for Health Statistics, Division of Health Care Statistics.
References
- National Center for Health Statistics. 2014 National Study of Long-Term Care Providers, Survey methodology and documentation.
- Park-Lee E, Harris-Kojetin LD, Rome V, Lendon JP. Characteristics of participants enrolled in adult day services centers, by center ownership: United States, 2014. NCHS data brief, no 227. Hyattsville, MD: National Center for Health Statistics. 2015.
- Harris-Kojetin L, Sengupta M, Park-Lee E, Valverde R. Long-term care services in the United States: 2013 overview. National Center for Health Statistics. Vital Health Stat 3(37). 2013.
- Anderson KA, Dabelko-Schoeny H, Johnson TD. The state of adult day services: Findings and implications from the MetLife National Study of Adult Day Services. J Appl Gerontol 32(6):729–48. 2013.
- Dwyer LL, Harris-Kojetin LD, Valverde RH. Differences in adult day services center characteristics by center ownership: United States, 2012. NCHS data brief, no 165. Hyattsville, MD: National Center for Health Statistics. 2014.
- Anderson KA, Park JH, Monteleone RG, Dabelko-Schoeny HI. Heterogeneity within adult day services: A focus on centers that serve younger adults with intellectual and developmental disabilities. Home Health Care Serv Q 33(2):77–88. 2014.
- National Center for Health Statistics. 2014 National Study of Long-Term Care Providers, Adult Day Services Center Survey: Restricted data file, data description and usage (readme). 2015.
- SAS Institute. SAS (Release 9.3) [computer software]. 2011.
- RTI International. SUDAAN (Release 11.0.0) [computer software]. 2012.
- StataCorp. Stata Statistical Software (Release 12.1) [computer software]. 2011.
Suggested citation
Rome V, Harris-Kojetin LD, Park-Lee E. Variation in operating characteristics of adult day services centers, by center ownership: United States, 2014. NCHS data brief, no 224. Hyattsville, MD: National Center for Health Statistics. 2015.
Copyright information
All material appearing in this report is in the public domain and may be reproduced or copied without permission; citation as to source, however, is appreciated.
National Center for Health Statistics
Charles J. Rothwell, M.S., M.B.A., Director
Nathaniel Schenker, Ph.D., Deputy Director
Jennifer H. Madans, Ph.D., Associate Director for Science
Division of Health Care Statistics
Clarice Brown, M.S., Director
Alexander Strashny, Ph.D., Associate Director for Science