Variation in Operating Characteristics of Residential Care Communities, by Size of Community: United States, 2014
In Figure 1, the two stacked bars were reformatted to sum to 100% on the y-axis on December 1, 2016. The number and percentage estimates remain the same.
- Key findings
- In 2014, more than 6 in 10 residential care communities had 4–25 beds, but nearly 7 in 10 residents lived in communities with more than 50 beds.
- As community bed size increased, chain affiliation increased.
- Compared with communities with more beds, a higher percentage of communities with 4–25 beds offered disease-specific programs for diabetes, cardiovascular disease, and depression.
- The use of electronic health records and computerized support for electronic health information exchange with physicians, pharmacies, or hospitals increased as community bed size increased.
- Summary
- Definitions
- Data source and methods
- About the authors
- References
- Suggested citation
NCHS Data Brief No. 222, November 2015
PDF Version (317 KB)
Christine Caffrey, Ph.D.; Lauren Harris-Kojetin, Ph.D.; and Manisha Sengupta, Ph.D.
Key findings
Data from the 2014 National Study of Long-Term Care Providers
- More than 6 in 10 residential care communities had 4–25 beds, but nearly 7 in 10 residents lived in communities with more than 50 beds.
- As community bed size increased, chain affiliation increased.
- Compared with communities with more beds, a higher percentage of communities with 4–25 beds offered disease-specific programs for residents with diabetes, cardiovascular disease, and depression.
- The use of electronic health records and computerized support for any electronic health information exchange increased as community bed size increased.
Assisted living and similar residential care communities provide services to individuals who cannot live independently but generally do not require the skilled level of care provided by nursing homes. In 2014, there were 30,200 residential care communities nationwide (1). This report presents the most current national estimates of residential care community operating characteristics and compares these characteristics by community bed size. State-level estimates for the characteristics presented in this report are available.
Keywords: assisted living, long-term care, long-term services and supports, National Study of Long-Term Care Providers
In 2014, more than 6 in 10 residential care communities had 4–25 beds, but nearly 7 in 10 residents lived in communities with more than 50 beds.
- Sixty-three percent of communities had 4–25 beds, but these communities housed only 17% of all residents (Figure 1).
- Communities with more than 50 beds accounted for 24% of all providers but housed 68% of all residents.
- The remaining 13% of communities, those with 26–50 beds, housed 14% of all residents.
Figure 1. Number and percentage of residential care communities and residents, by community bed size: United States, 2014

NOTES: Percentages are based on unrounded numbers. Estimates may not add up to totals because of rounding.
SOURCE: CDC/NCHS, National Study of Long-Term Care Providers, 2014.
As community bed size increased, chain affiliation increased.
- Eighty-seven percent of communities with 4–25 beds were for-profit compared with 70% of communities with 26–50 beds and 76% of communities with more than 50 beds (Figure 2).
- Smaller communities tended to be newer than larger communities. More than three-fourths of communities with more than 50 beds (79%) and 26–50 beds (77%) had been in operation for 10 or more years compared with 50% of communities with 4–25 beds.
- Seventy-four percent of communities with more than 50 beds were chain-affiliated compared with 65% of communities with 26–50 beds and 47% of communities with 4–25 beds.
Figure 2. Selected residential care community operating characteristics, by community bed size: United States, 2014
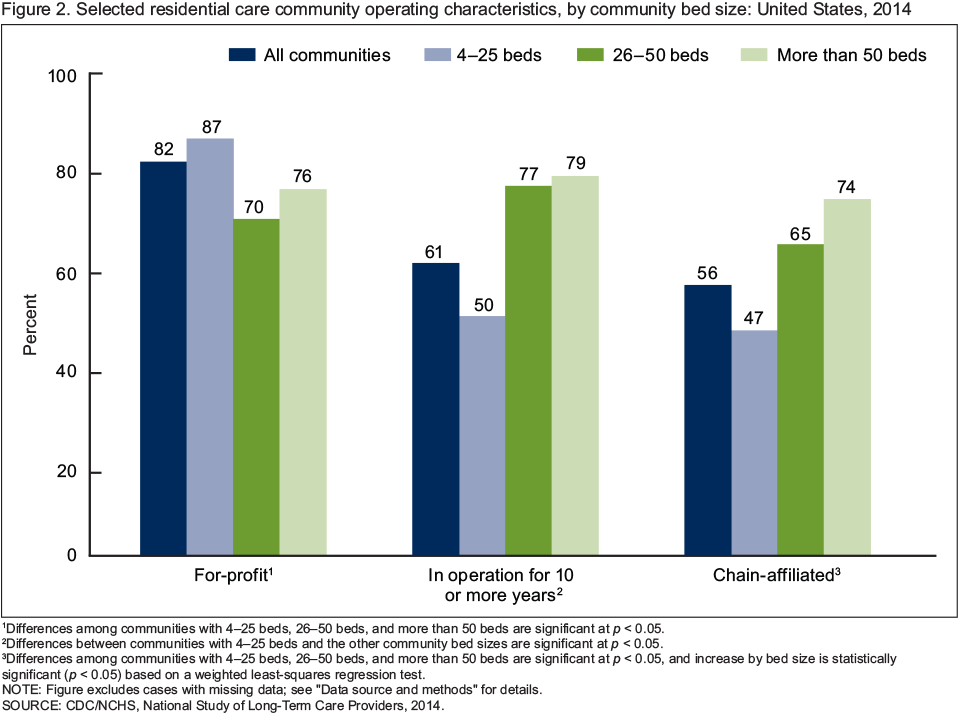
1Differences among communities with 4–25 beds, 26–50 beds, and more than 50 beds are significant at p < 0.05.
2Differences between communities with 4–25 beds and the other community bed sizes are significant at p < 0.05.
3Differences among communities with 4–25 beds, 26–50 beds, and more than 50 beds are significant at p < 0.05, and increase by bed size is statistically significant (p < 0.05) based on a weighted least-squares regression test.
NOTE: Figure excludes cases with missing data; see “Data source and methods” for details.
SOURCE: CDC/NCHS, National Study of Long-Term Care Providers, 2014.
Compared with communities with more beds, a higher percentage of communities with 4–25 beds offered disease-specific programs for diabetes, cardiovascular disease, and depression.
- Sixty-seven percent of communities with more than 50 beds offered disease-specific programs for residents with Alzheimer’s disease and other dementias, whereas fewer communities with 26–50 beds (53%) and 4–25 beds (56%) did so (Figure 3).
- Sixty-one percent of communities with 4–25 beds offered diabetes-specific programming, whereas fewer communities with 26–50 beds (50%) and more than 50 beds (56%) did so.
- More than one-half of communities with 4–25 beds (56%) offered cardiovascular disease-specific programming, whereas fewer communities with 26–50 beds (45%) and more than 50 beds (46%) did so.
- The majority of communities with 4–25 beds (52%) offered depression-specific programming, whereas a minority of communities with 26–50 beds (39%) and more than 50 beds (42%) did so.
Figure 3. Disease-specific programs offered for selected conditions among residential care communities, by community bed size: United States, 2014
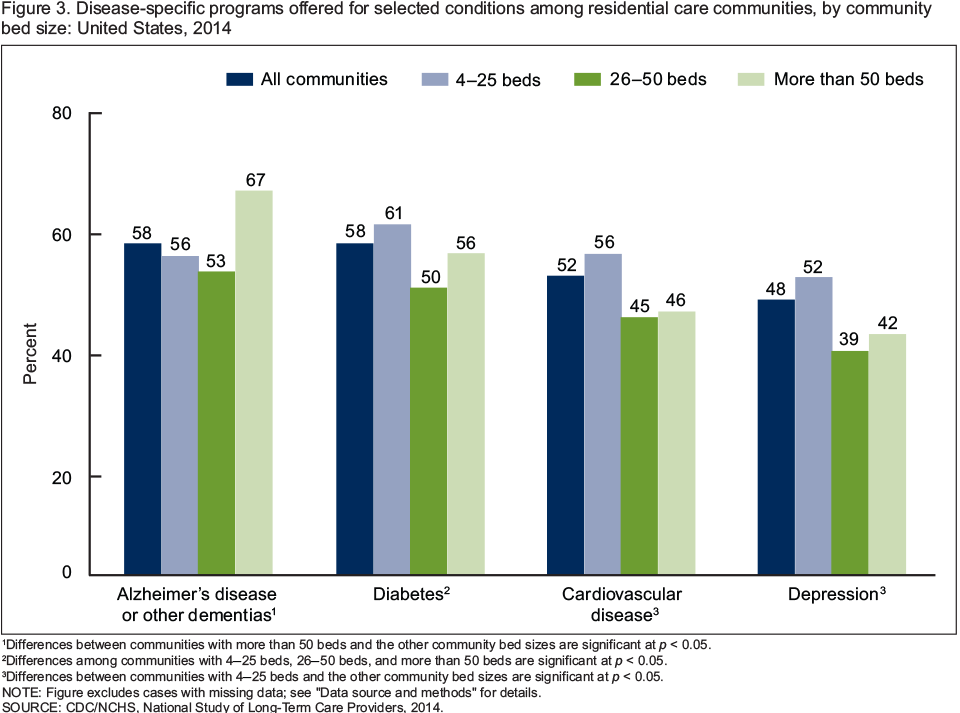
1Differences between communities with more than 50 beds and the other community bed sizes are significant at p < 0.05.
2Differences among communities with 4–25 beds, 26–50 beds, and more than 50 beds are significant at p < 0.05.
3Differences between communities with 4–25 beds and the other community bed sizes are significant at p < 0.05.
NOTE: Figure excludes cases with missing data; see “Data source and methods” for details.
SOURCE: CDC/NCHS, National Study of Long-Term Care Providers, 2014.
The use of electronic health records and computerized support for electronic health information exchange with physicians, pharmacies, or hospitals increased as community bed size increased.
- Almost one-third of communities with more than 50 beds (32%) used electronic health records compared with 26% of communities with 26–50 beds and 12% of communities with 4–25 beds (Figure 4).
- Twenty-nine percent of communities with more than 50 beds had computerized support for electronic health information exchange with physicians, pharmacies, or hospitals compared with 21% of communities with 26–50 beds and 16% of communities with 4–25 beds.
Figure 4. Use of electronic health records and support for electronic health information exchange among residential care communities, by community bed size: United States, 2014
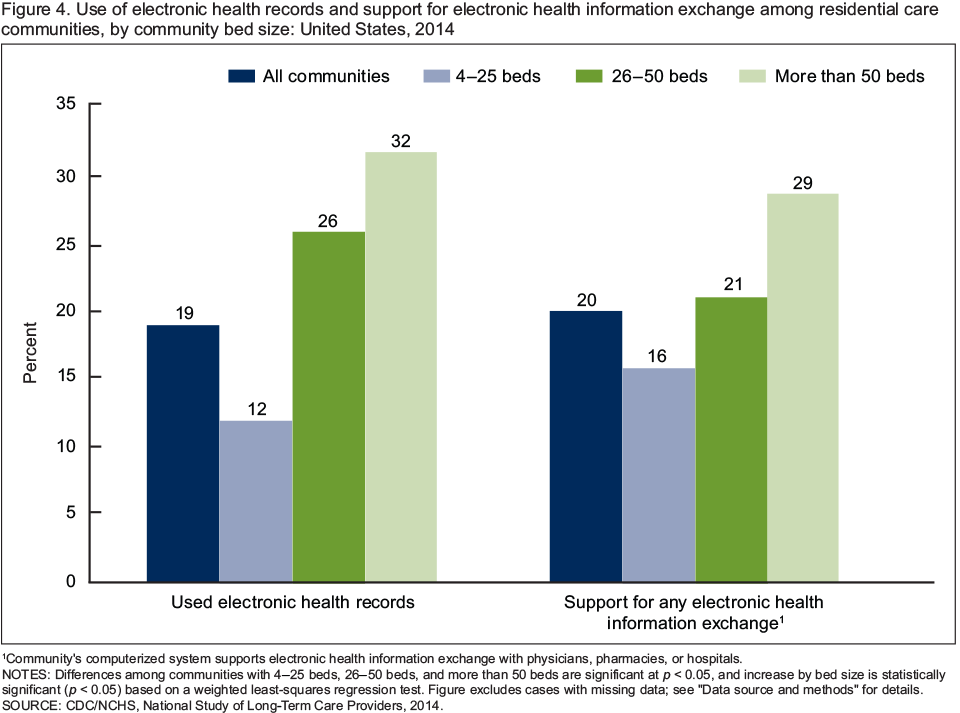
1Community’s computerized system supports electronic health information exchange with physicians, pharmacies, or hospitals.
NOTES: Differences among communities with 4–25 beds, 26–50 beds, and more than 50 beds are significant at p < 0.05, and increase by bed size is statistically significant (p < 0.05) based on a weighted least-squares regression test. Figure excludes cases with missing data; see “Data source and methods” for details.
SOURCE: CDC/NCHS, National Study of Long-Term Care Providers, 2014.
Summary
In the United States in 2014, the majority of residential care communities had 4–25 beds, yet 68% of residents lived in communities with more than 50 beds. Chain affiliation was more common as community size increased. A higher percentage of communities with 4–25 beds offered diabetes, cardiovascular disease, and depression-specific programming compared with communities with more than 25 beds. The use of electronic health records and computerized support for any electronic health information exchange with physicians, pharmacies, or hospitals increased as community bed size increased.
This brief profile of residential care communities in 2014 provides useful information to policymakers, providers, researchers, and consumer advocates as they plan to meet the needs of an aging population. The findings also highlight the diversity of residential care communities across their different sizes. Corresponding state estimates and their standard errors for the national figures in this report are available.
Definitions
Chain affiliation: Ownership by a person, group, or organization owning or managing two or more residential care communities, including corporate chains.
Community bed size: Based on the number of licensed, registered, or certified residential care beds (both occupied and unoccupied) in a residential care community: 4–25 beds, 26–50 beds, and more than 50 beds.
Disease-specific programs: Programs that target residents with a specific diagnosis and may include one or more of the following services: education, physical activity, diet or nutrition, medication management, and weight management.
Electronic health records: A computerized version of the resident’s health and personal information used in the management of the resident’s health care.
Electronic health information exchange system: A computerized system that supports electronic health information exchange with physicians, pharmacies, or hospitals. Faxing was excluded.
Ownership type: Categorization of residential care communities into two ownership types: private, for-profit; and nonprofit. The private, for-profit category includes publicly traded communities and limited liability communities. Nonprofit includes private nonprofit, as well as federal, state, county, and local government ownership.
Residential care communities: Includes assisted living communities and other residential care communities (e.g., personal care homes, adult care homes, board care homes, adult foster care) that meet the study eligibility criteria provided in “Data source and methods.”
Residential care bed: Refers to licensed, registered, or certified residential care beds.
Data source and methods
Data are from the residential care community survey component of the 2014 wave of the biennial National Study of Long-Term Care Providers (NSLTCP). To be eligible for the study, a residential care community must: be regulated by the state to provide room and board with at least two meals a day, around-the-clock onsite supervision, and help with personal care such as bathing and dressing or health-related services such as medication management; have four or more licensed, certified, or registered beds; have at least one resident currently living in the community at the time of the survey; and, serve a predominantly adult population. Excluded were residential care communities licensed to exclusively serve individuals with severe mental illness or intellectual or developmental disability. Nursing homes were also excluded. The survey used a combination of probability sampling and taking a census. More details about the NSLTCP residential care survey design and outcomes are published elsewhere (1,2).
The percentage of cases with missing data for variables in this report ranged from 1.7% for type of ownership to 7.4% for computerized support for electronic health information exchange with hospitals. These cases were excluded from the analyses on a variable-by-variable basis.
Data analyses were performed using SAS version 9.3, SAS-callable SUDAAN version 11.0.0 statistical package (RTI International, 2012), and STATA/SE 12.1 (StataCorp LP, 2013). Differences among subgroups were evaluated using chi-square and t tests. If a chi-square test was statistically significant, a post hoc t test procedure was used to make pairwise comparisons between different community bed sizes. A weighted least-squares regression method was used to test the significance of linear trends in bed size. All significance tests were two-sided using p < 0.05 as the level of significance. The difference between any two estimates were mentioned in the text only if it was statistically significant. Lack of comment regarding the difference between any two statistics does not necessarily suggest that the difference was tested and found to be not statistically significant. The estimate of the number of residential care communities and residents varied among the 2010 National Survey of Residential Care Facilities, and the 2012 and 2014 waves of NSLTCP (1–6).
About the authors
Christine Caffrey, Lauren Harris-Kojetin, and Manisha Sengupta are with CDC’s National Center for Health Statistics, Division of Health Care Statistics.
References
- NCHS. 2014 National Study of Long-Term Care Providers. Survey methodology and documentation.
- NCHS. 2014 National Study of Long-Term Care Providers residential care communities survey restricted data file data description and usage.
- Caffrey C, Harris-Kojetin L, Rome V, Sengupta M. Operating characteristics of residential care communities, by community bed size: United States, 2012. NCHS data brief, no 170. Hyattsville, MD: National Center for Health Statistics. 2014.
- Caffrey C, Harris-Kojetin L, Rome V, Sengupta M. Characteristics of residents living in residential care communities, by community bed size: United States, 2012. NCHS data brief, no 171. Hyattsville, MD: National Center for Health Statistics. 2014.
- Park-Lee E, Caffrey C, Sengupta M, et al. Residential care facilities: A key sector in the spectrum of long-term care providers in the United States. NCHS data brief, no 78. Hyattsville, MD: National Center for Health Statistics. 2011.
- Caffrey C, Sengupta M, Park-Lee E, et al. Residents living in residential care facilities: United States, 2010. NCHS data brief, no 91. Hyattsville, MD: National Center for Health Statistics. 2012.
Suggested citation
Caffrey C, Harris-Kojetin L, Sengupta M. Variation in operating characteristics of residential care communities, by size of community: United States, 2014. NCHS data brief, no 222. Hyattsville, MD: National Center for Health Statistics. 2015.
Copyright information
All material appearing in this report is in the public domain and may be reproduced or copied without permission; citation as to source, however, is appreciated.
National Center for Health Statistics
Charles J. Rothwell, M.S., M.B.A., Director
Nathaniel Schenker, Ph.D., Deputy Director
Jennifer H. Madans, Ph.D., Associate Director for Science
Division of Health Care Statistics
Clarice Brown, M.S., Director
Alexander Strashny, Ph.D., Associate Director for Science