Hypertension Prevalence and Control Among Adults: United States, 2011–2014
- Key findings
- What was the prevalence of hypertension among adults during 2011–2014?
- Were differences seen in the prevalence of hypertension among adults by race and Hispanic origin during 2011–2014?
- What percentage of adults with hypertension had their blood pressure controlled?
- Among adults with hypertension, were differences seen in blood pressure control by race and Hispanic origin during 2011–2014?
- Has overall prevalence and control of hypertension changed between 1999 and 2014?
- Summary
- Definitions
- Data source and methods
- About the authors
- References
- Suggested citation
NCHS Data Brief No. 220, November 2015
PDF Version (800 KB)
Sung Sug (Sarah) Yoon, Ph.D, R.N.; Cheryl D. Fryar, M.S.P.H.; and Margaret D. Carroll, M.S.P.H.
Key findings
Data from the National Health and Nutrition Examination Survey
- Prevalence of hypertension among adults was 29.0% in 2011–2014 and increased with age: 18–39, 7.3%; 40–59, 32.2%; and 60 and over, 64.9%.
- Hypertension prevalence was higher among non-Hispanic black (41.2%) than non-Hispanic white (28.0%), non-Hispanic Asian (24.9%), or Hispanic (25.9%) adults.
- Prevalence of controlled hypertension was 53.0%, and adults aged 18–39 were less likely to have controlled hypertension than those aged 60 and over.
- Overall, prevalence of controlled hypertension was higher among non-Hispanic white (55.7%) than non-Hispanic black (48.5%), non-Hispanic Asian (43.5%), or Hispanic (47.4%) adults.
- From 1999 to 2014, hypertension prevalence was unchanged, but control of hypertension increased.
Hypertension is a public health challenge in the United States because it directly increases the risk for cardiovascular disease (1). National and regional health initiatives, including Healthy People 2020, the Million Hearts Initiative, and the Community Preventive Services Task Force, have sought to increase public awareness of the health benefits of improving blood pressure control (2–4). This report presents updated estimates for the prevalence and control of hypertension in the United States for 2011–2014.
Keywords: high blood pressure, National Health and Nutrition Examination Survey
What was the prevalence of hypertension among adults during 2011–2014?
Overall, the prevalence of hypertension among adults was 29.0% for 2011–2014 and was similar among men (30.0%) and women (28.1%) (Figure 1).
The prevalence of hypertension increased with age, from 7.3% among adults aged 18–39 to 32.2% among those aged 40–59, and 64.9% among those aged 60 and over. A similar pattern was found among both men (8.4% for those aged 18–39, 34.6% for 40–59, and 63.1% for 60 and over) and women (6.1% for those aged 18–39, 29.9% for 40–59, and 66.5% for 60 and over).
Men had a higher prevalence of hypertension than women among adults aged 18–39 (8.4% compared with 6.1%, respectively) and aged 40–59 (34.6% compared with 29.9%, respectively), but not among adults aged 60 and over (Figure 1).
Figure 1. Prevalence of hypertension among adults aged 18 and over, by sex and age: United States, 2011–2014
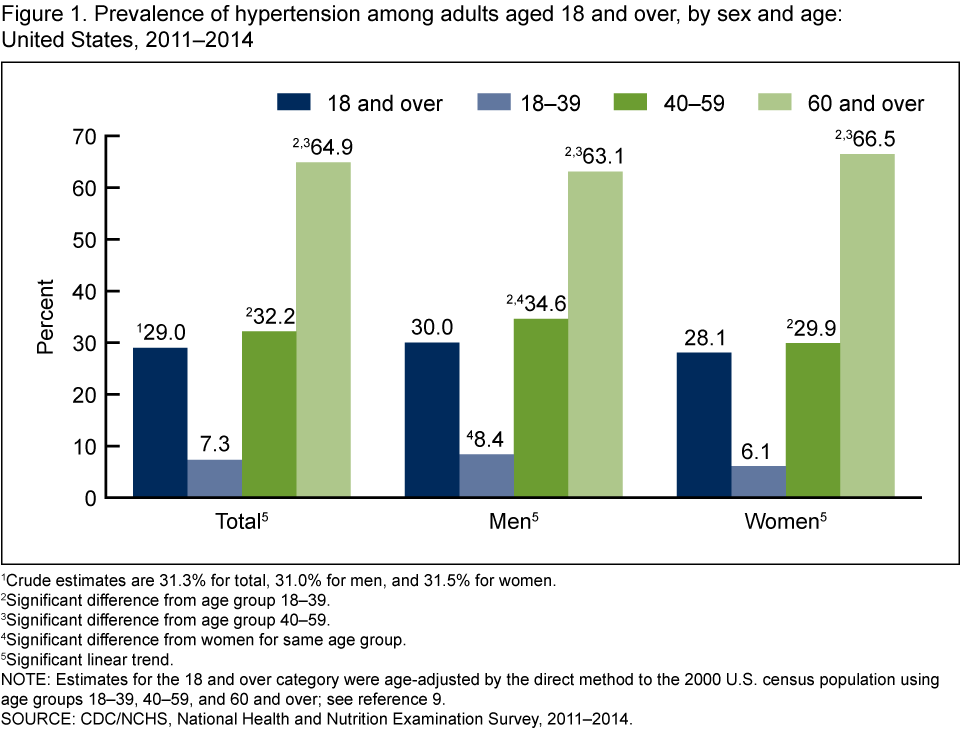
1Crude estimates are 31.3% for total, 31.0% for men, and 31.5% for women.
2Significant difference from age group 18–39.
3Significant difference from age group 40–59.
4Significant difference from women for same age group.
5Significant linear trend.
NOTE: Estimates for the 18 and over category were age-adjusted by the direct method to the 2000 U.S. census population using age groups 18–39, 40–59, and 60 and over; see reference 9.
SOURCE: CDC/NCHS, National Health and Nutrition Examination Survey, 2011–2014.
Were differences seen in the prevalence of hypertension among adults by race and Hispanic origin during 2011–2014?
For adult men and women, the prevalence of hypertension among non-Hispanic black (41.2%) adults was higher than among non-Hispanic white (28.0%), non-Hispanic Asian (24.9%), and Hispanic (25.9%) adults. Non-Hispanic Asian adults had significantly lower prevalence of hypertension than non-Hispanic white adults (Figure 2).
In men, the prevalence of hypertension was higher among non-Hispanic black adults than among all other race and Hispanic origin groups. Prevalence of hypertension was also higher among non-Hispanic white (29.4%) than Hispanic (25.4%) men.
In women, the prevalence of hypertension also was higher among non-Hispanic black adults than among all other race and Hispanic origin groups. Prevalence of hypertension was higher among non-Hispanic white (26.5%) than non-Hispanic Asian (23.5%) women.
The only difference by sex was found among non-Hispanic white adults—men had a higher prevalence of hypertension (29.4%) than women (26.5%).
Figure 2. Prevalence of hypertension among adults aged 18 and over, by sex and race and Hispanic origin: United States, 2011–2014
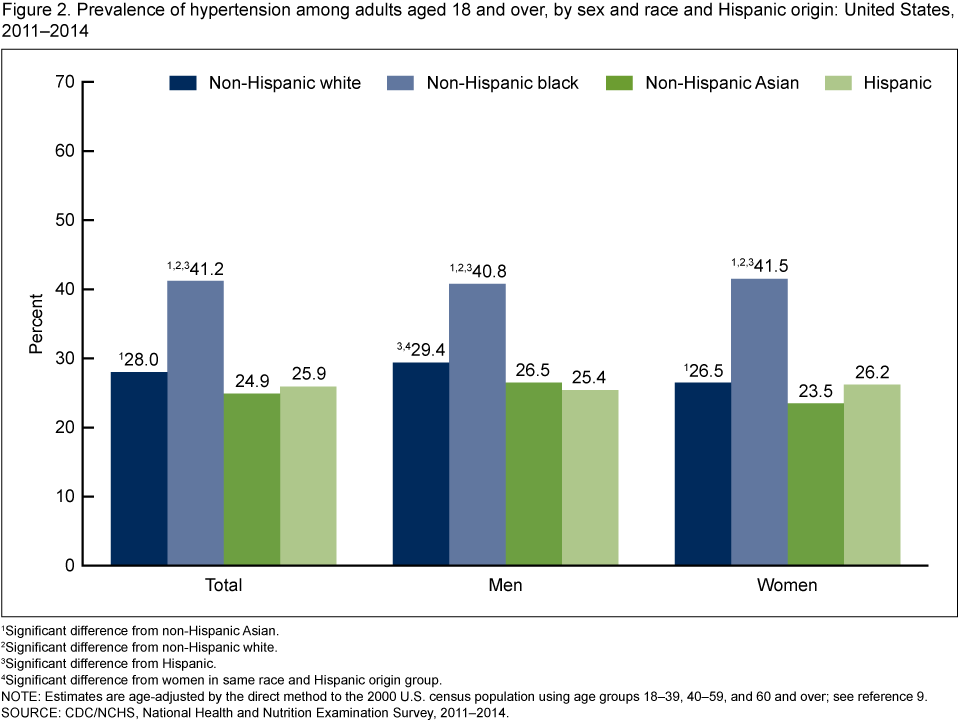
1Significant difference from non-Hispanic Asian.
2Significant difference from non-Hispanic white.
3Significant difference from Hispanic.
4Significant difference from women in same race and Hispanic origin group.
NOTE: Estimates are age-adjusted by the direct method to the 2000 U.S. census population using age groups 18–39, 40–59, and 60 and over; see reference 9.
SOURCE: CDC/NCHS, National Health and Nutrition Examination Survey, 2011–2014.
What percentage of adults with hypertension had their blood pressure controlled?
Among adults with hypertension, 53.0% had controlled hypertension during 2011–2014. The prevalence of controlled hypertension was higher among those aged 40–59 (57.2%) and 60 and over (52.5%) than among those aged 18–39 (37.4%) (Figure 3).
A higher percentage of women had controlled hypertension (56.3%) than men (50.6%).
Among men with hypertension, those aged 18–39 had a lower prevalence of controlled hypertension (27.9%) than those aged 40–59 (50.3%) or 60 and over (54.6%). For women with hypertension, the prevalence of controlled hypertension was higher among those aged 40–59 (64.9%) than among those aged 18–39 (51.3%) or 60 and over (50.8%).
Significant differences in the prevalence of hypertension control by sex were seen in adults aged 18–39 and 40–59: 51.3% of women aged 18–39 controlled their hypertension compared with 27.9% of men in the same age group; 64.9% of women aged 40–59 controlled their hypertension compared with 50.3% of men in the same age group.
Figure 3. Prevalence of controlled hypertension among adults with hypertension aged 18 and over, by sex and age: United States, 2011–2014
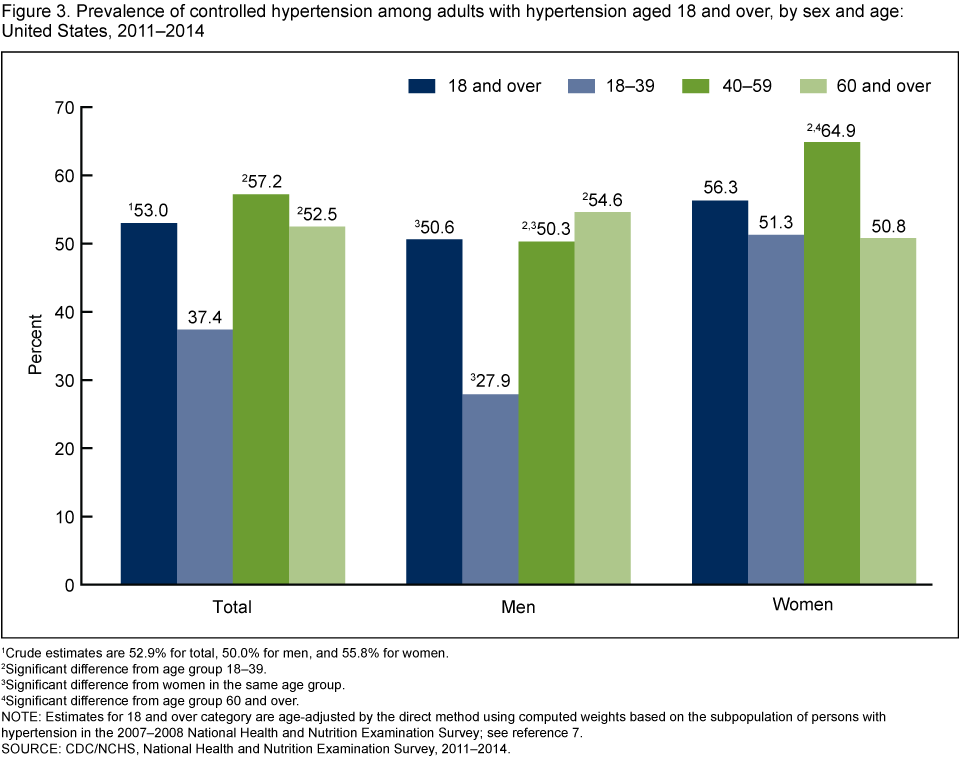
1Crude estimates are 52.9% for total, 50.0% for men, and 55.8% for women.
2Significant difference from age group 18–39.
3Significant difference from women in the same age group.
4Significant difference from age group 60 and over.
NOTE: Estimates for 18 and over category are age-adjusted by the direct method using computed weights based on the subpopulation of persons with hypertension in the 2011–2012 National Health and Nutrition Examination Survey; see reference 7.
SOURCE: CDC/NCHS, National Health and Nutrition Examination Survey, 2011–2014.
Among adults with hypertension, were differences seen in blood pressure control by race and Hispanic origin during 2011–2014?
Among all adults with hypertension, the overall prevalence of hypertension control among non-Hispanic white (55.7%) adults was higher than among non-Hispanic black (48.5%), non-Hispanic Asian (43.5%), and Hispanic (47.4%) adults. A similar pattern was noted for both men and women, although the difference between non-Hispanic white (59.1%) and Hispanic (52.1%) women did not reach statistical significance.
Overall, non-Hispanic black adults were more likely to have controlled hypertension than non-Hispanic Asian adults. Overall, and for both men and women, no significant difference was seen in the prevalence of controlled high blood pressure between Hispanic and non-Hispanic Asian adults (Figure 4).
Among men with hypertension, non-Hispanic white (53.8%) adults had a higher prevalence of controlled high blood pressure compared with non-Hispanic black (43.8%), non-Hispanic Asian (39.9%), and Hispanic (43.5%) adults. For women with hypertension, the percentage of non-Hispanic white (59.1%) adults with controlled high blood pressure was higher than among non-Hispanic black (52.3%) and non-Hispanic Asian (46.8%) adults.
The percentage of men with controlled hypertension was lower than that for women among non-Hispanic black and Hispanic adults.
Figure 4. Prevalence of controlled hypertension among adults with hypertension aged 18 and over, by sex and race and Hispanic origin: United States, 2011–2014
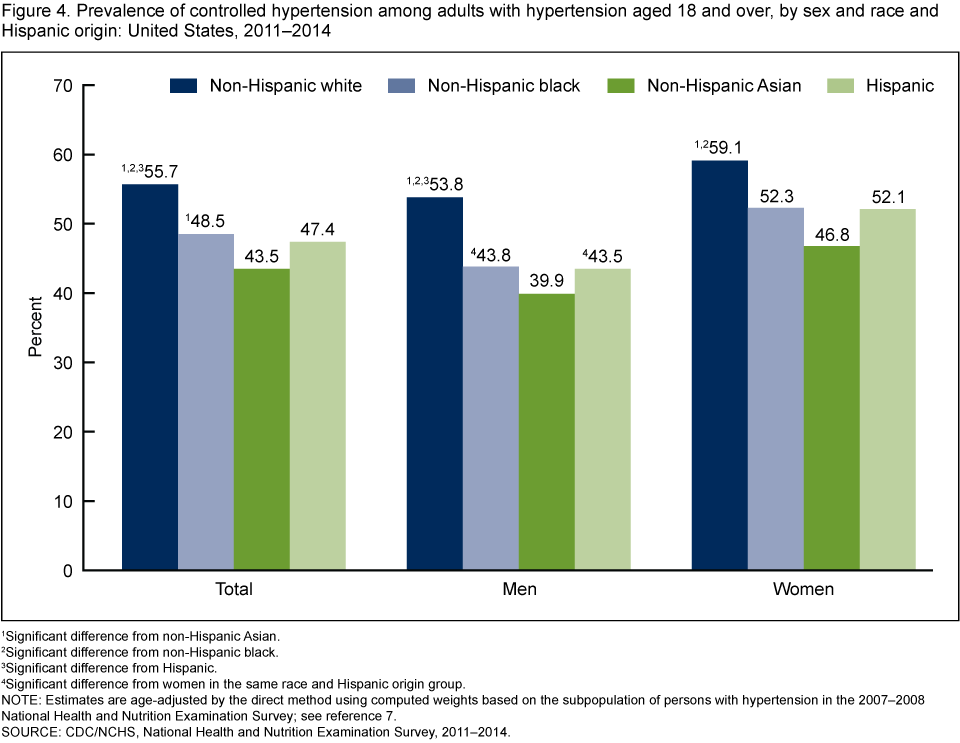
1Significant difference from non-Hispanic Asian.
2Significant difference from non-Hispanic black.
3Significant difference from Hispanic.
4Significant difference from women in the same race and Hispanic origin group.
NOTE: Estimates are age-adjusted by the direct method using computed weights based on the subpopulation of persons with hypertension in the 2011–2012 National Health and Nutrition Examination Survey; see reference 7.
SOURCE: CDC/NCHS, National Health and Nutrition Examination Survey, 2011–2014.
Has overall prevalence and control of hypertension changed between 1999 and 2014?
From 1999 through 2014, no significant change was seen in the percentage of adults with hypertension. For controlled hypertension, a significant increase was noted in the percentage of adults with controlled hypertension from 1999 to 2014; however, no significant change was noted from 2009 to 2014 (Figure 5).
Figure 5. Age-adjusted trends in hypertension and controlled hypertension among adults aged 18 and over: United States, 1999–2014
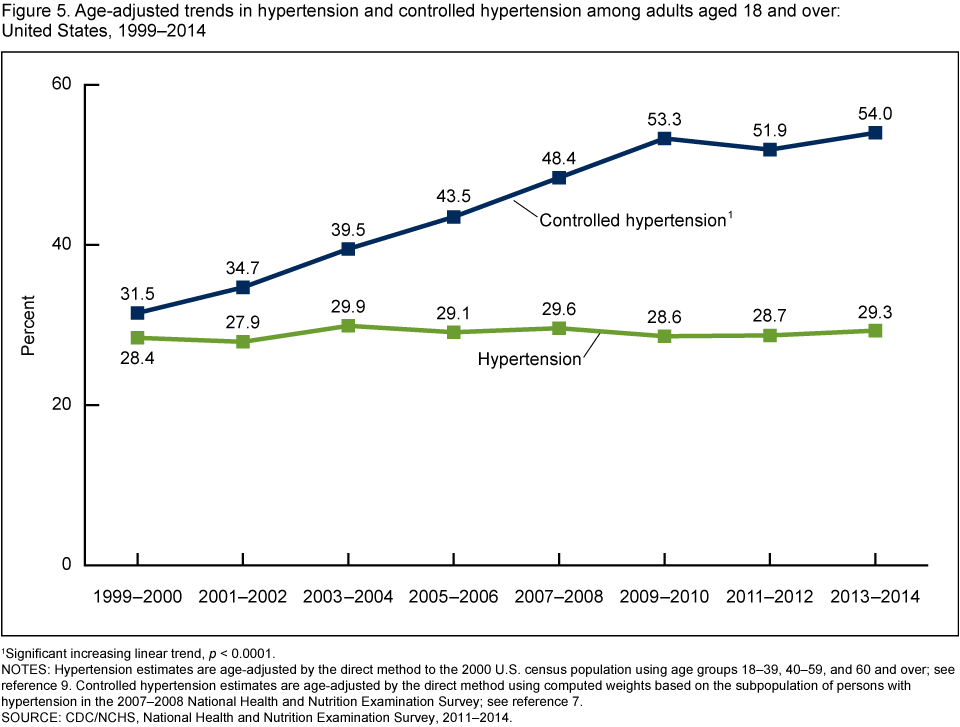
1Significant increasing linear trend, p < 0.0001.
NOTES: Hypertension estimates are age-adjusted by the direct method to the 2000 U.S. census population using age groups 18–39, 40–59, and 60 and over; see reference 9. Controlled hypertension estimates are age-adjusted by the direct method using computed weights based on the subpopulation of persons with hypertension in the 2011–2012 National Health and Nutrition Examination Survey; see reference 7.
SOURCE: CDC/NCHS, National Health and Nutrition Examination Survey, 2011–2014.
Summary
Overall, the U.S. prevalence of hypertension since 1999 was 29.0% with no significant change in prevalence. However, the prevalence of controlled hypertension among adults with hypertension in the United States has increased from 31.5% for 1999–2000 to 53.3% for 2009–2010. The prevalence of controlled hypertension among adults with hypertension remained stable through 2013–2014. Currently, more than one-half of adults with hypertension have their hypertension under control (54.0%).
Hypertension prevalence was higher among adults aged 60 and over and non-Hispanic black adults. Controlled hypertension rates were higher among adults aged 40–59 and among non-Hispanic white adults. No difference was seen between men and women in the prevalence of hypertension, but a higher percentage of women than men had their hypertension controlled.
Despite the remarkable progress in hypertension control that has been noted in the United States over the years, there is still room for improvement to meet the goal of Healthy People 2020 (61.2% by 2020) (2).
Definitions
Hypertension: Systolic blood pressure greater than or equal to 140 mmHg or diastolic blood pressure greater than or equal to 90 mmHg, or currently taking medication to lower high blood pressure (5,6).
Controlled hypertension: Systolic blood pressure less than 140 mmHg and diastolic blood pressure less than 90 mmHg among those with hypertension (5,6). Estimates are age-adjusted among persons with hypertension (7).
Data source and methods
Data from the National Health and Nutrition Examination Surveys (NHANES) 1999–2014 were used for these analyses. Data from NHANES 2011–2014 (4 years of data) were used to test differences between demographic subgroups, thus increasing the sample size, the precision of the estimates, and the ability to detect a difference in prevalence. In testing for trends in hypertension prevalence and control, eight 2-year cycles were used: 1999–2000, 2001–2002, 2003–2004, 2005–2006, 2007–2008, 2009–2010, 2011–2012, and 2013–2014.
NHANES is a cross-sectional survey designed to monitor the health and nutritional status of the civilian noninstitutionalized U.S. population using highly stratified, multistage probability designs (8). The survey consists of interviews conducted in participants’ homes and standardized health examinations conducted in mobile examination centers (MECs). Blood pressure was measured in the MEC by trained physicians following a standard protocol.
In 2011–2012 and 2013–2014, non-Hispanic black, non-Hispanic Asian, and Hispanic persons, among other groups, were oversampled to obtain reliable estimates for these population subgroups. Specific race and Hispanic origin estimates reflect individuals reporting only one race; those reporting more than one race are included in the total but not reported separately.
An average of up to three brachial systolic and diastolic blood pressure readings was used for systolic and diastolic blood pressure values. Ninety-eight percent of study participants had at least two complete blood pressure measurements. For participants with only one blood pressure reading (0.2%), a single measurement was used. Appropriate blood pressure cuff sizes were used for participants based on measurement of mid-arm circumference (8).
Examination sample weights, which account for the differential probabilities of selection, nonresponse, and noncoverage, were incorporated into the estimation process. All variance estimates accounted for the complex survey design by using Taylor series linearization. Pregnant women were excluded from analyses. Hypertension prevalence estimates for the total adult population were age-adjusted to the 2000 U.S. census population using the direct method and age groups 18–39, 40–59, and 60 and over (9). Age-adjusted control rates of hypertension were calculated using the subpopulation of persons who have hypertension as recommended by the National Surveillance Definitions for Hypertension (7). Differences between groups were tested using a univariate t statistic at the p < 0.05 significance level. All differences reported are statistically significant unless otherwise indicated. Adjustments were not made for multiple comparisons. Statistical analyses were conducted using SAS System for Windows, release 9.3 (SAS Institute Inc., Cary, N.C.) and SUDAAN, release 11.1 (Research Triangle Institute, Research Triangle Park, N.C.).
About the authors
Sung Sug (Sarah) Yoon, Cheryl D. Fryar, and Margaret D. Carroll are with CDC’s National Center for Health Statistics, Division of Health and Nutrition Examination Surveys.
References
- Mozaffarian D, Benjamin EJ, Go AS, Arnett DK, Blaha MJ, Cushman M, et.al. Heart disease and stroke statistics—2015 update: A report from the American Heart Association. Circulation. 131:e29–e322. 2015.
- U.S. Department of Health and Human Services, Office of Disease Prevention and Health Promotion. Healthy People 2020.
- CDC. Million Hearts Initiative.
- Community Preventive Services Task Force. The Community Guide. Cardiovascular disease prevention and control: Team-based care to improve blood pressure control.
- Chobanian AV, Bakris GL, Black HR, Cushman WC, Green LA, Izzo JL Jr, et al. The seventh report of the Joint National Committee on Prevention, Detection, Evaluation, and Treatment of High Blood Pressure: The JNC 7 report. JAMA 289(19):2560–72. 2003.
- National Heart Lung and Blood Institute. National high blood pressure education program. 2003.
- Crim MT, Yoon SS, Ortiz E, Wall HK, Schober S, Gillespie C, et al. National surveillance definitions for hypertension prevalence and control among adults. Circ Cardiovasc Qual Outcomes 5(3):343–51. 2012.
- National Center for Health Statistics. National Health and Nutrition Examination Survey (NHANES): Examination manuals 2011–2012, 2013–2014.
- Klein RJ, Schoenborn CA. Age adjustment using the 2000 projected U.S. population. Healthy People 2010 Stat Notes 20:1–10. 2001.
Suggested citation
Yoon SS, Fryar CD, Carroll MD. Hypertension prevalence and control among adults: United States, 2011–2014. NCHS data brief, no 220. Hyattsville, MD: National Center for Health Statistics. 2015.
Copyright information
All material appearing in this report is in the public domain and may be reproduced or copied without permission; citation as to source, however, is appreciated.
National Center for Health Statistics
Charles J. Rothwell, M.S., M.B.A., Director
Nathaniel Schenker, Ph.D., Deputy Director
Jennifer H. Madans, Ph.D., Associate Director for Science
Division of Health and Nutrition Examination Surveys
Kathryn S. Porter, M.D., M.S., Director
Ryne Paulose-Ram, Ph.D., Associate Director for Science