Leading Causes of Death Contributing to Decrease in Life Expectancy Gap Between Black and White Populations: United States, 1999–2013
- Key findings
- What are the recent trends in life expectancy?
- How did the racial gap in life expectancy change over time?
- What leading causes of death influenced the decrease in the life expectancy gap between the black and white populations from 1999 to 2013?
- What leading causes of death influenced the decrease in the gap in life expectancy between the black and white male populations from 1999 to 2013?
- What leading causes of death influenced the decrease in the gap in life expectancy between the black and white female populations from 1999 to 2013?
- Summary
- Definitions
- Data source and methods
- About the authors
- References
- Suggested citation
NCHS Data Brief No. 218, November 2015
PDF Version (764 KB)
Kenneth D. Kochanek, M.A.; Elizabeth Arias, Ph.D.; and Robert N. Anderson, Ph.D.
Key findings
Data from the National Vital Statistics System, Mortality
- The gap in life expectancy between the black and white populations decreased 2.3 years between 1999 and 2013 (5.9 to 3.6 years).
- The decrease in the gap was due to larger decreases in death rates for the black population for heart disease, cancer, and HIV disease.
- The gap in life expectancy between black and white males decreased 2.4 years between 1999 and 2013 (6.8 to 4.4 years).
- The decrease in the gap was due to larger decreases in death rates for black males for HIV disease, cancer, and unintentional injuries.
- The gap in life expectancy between black and white females decreased 2.2 years between 1999 and 2013 (5.2 to 3.0 years).
- The decrease in the gap was due to larger decreases in death rates for black females for heart disease, HIV disease, and cancer.
The trend in U.S. life expectancy since 1900 has been one of gradual improvement (1). Nevertheless, differences in life expectancy by race have persisted at least since official estimates were recorded. Measuring health disparities, including those in life expectancy, is part of the Healthy People 2020 recommendations (2). In 1999, the difference in life expectancy between the white and black populations was 5.9 years. The gap decreased to 3.6 years in 2013. Black and white population differences in causes of death are explored to determine how they contribute to the decrease in the gap in life expectancy from 1999 through 2013.
Keywords: mortality, disparities, National Vital Statistics System
What are the recent trends in life expectancy?
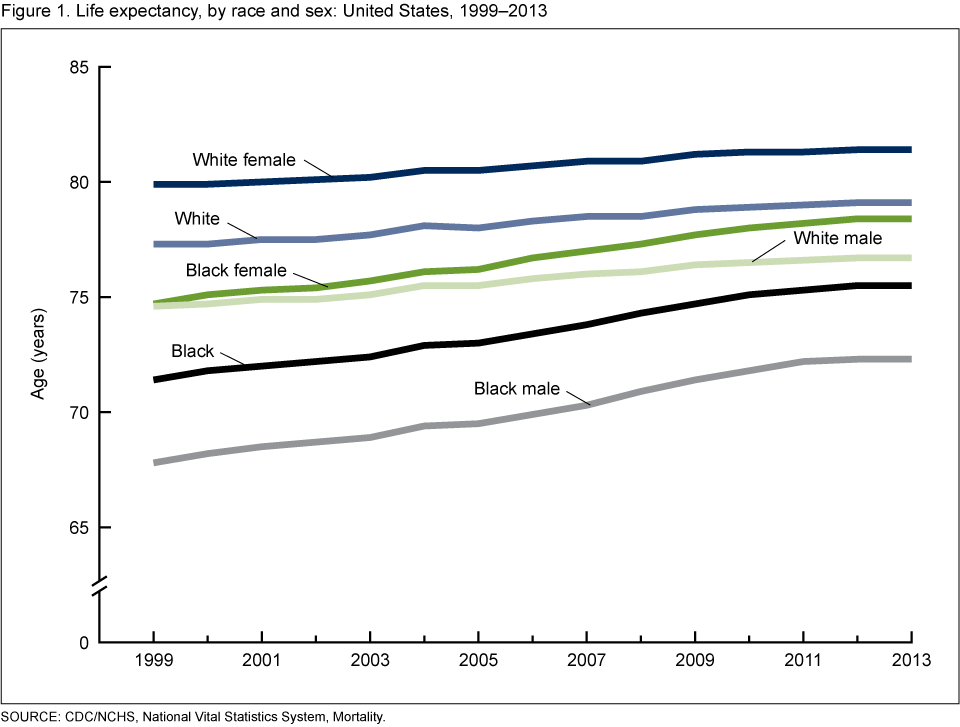
Life expectancy at birth increased steadily from 77.3 years in 1999 to 79.1 years in 2013 for the white population (2.3% increase) (Figure 1). For white males, the increase was from 74.6 years to 76.7 years (2.8% increase), and for white females, from 79.9 years to 81.4 years (1.9% increase).
Life expectancy at birth for the black population increased steadily from 71.4 years in 1999 to 75.5 years in 2013 (5.7% increase). For black males, the increase was from 67.8 years to 72.3 years (6.6% increase), and for black females, from 74.7 years to 78.4 years (5.0% increase).
Figure 1. Life expectancy, by race and sex: United States, 1999–2013
SOURCE: CDC/NCHS, National Vital Statistics System, Mortality.
How did the racial gap in life expectancy change over time?
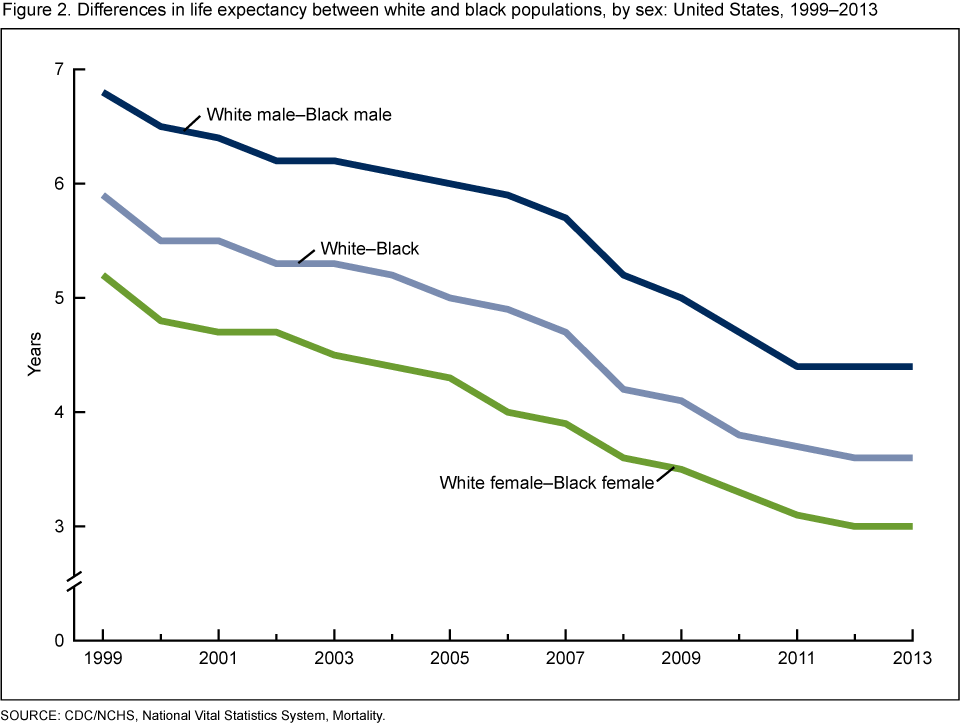
In 2013, the difference in life expectancy at birth between the black and white populations was 3.6 years (Figure 2). For black and white males, this difference was 4.4 years, and for black and white females, the difference was 3.0 years.
In 1999, the difference in life expectancy between the black and white populations was 5.9 years. For black and white males, this difference was 6.8 years, and for black and white females the difference was 5.2 years (1).
Between 1999 and 2013, the gap in life expectancy between the black and white populations decreased by 2.3 years. For black and white males, the decrease in the gap was 2.4 years, and for black and white females, the decrease in the gap was 2.3 years.
Figure 2. Differences in life expectancy between white and black populations, by sex: United States, 1999–2013
SOURCE: CDC/NCHS, National Vital Statistics System, Mortality.
What leading causes of death influenced the decrease in the life expectancy gap between the black and white populations from 1999 to 2013?
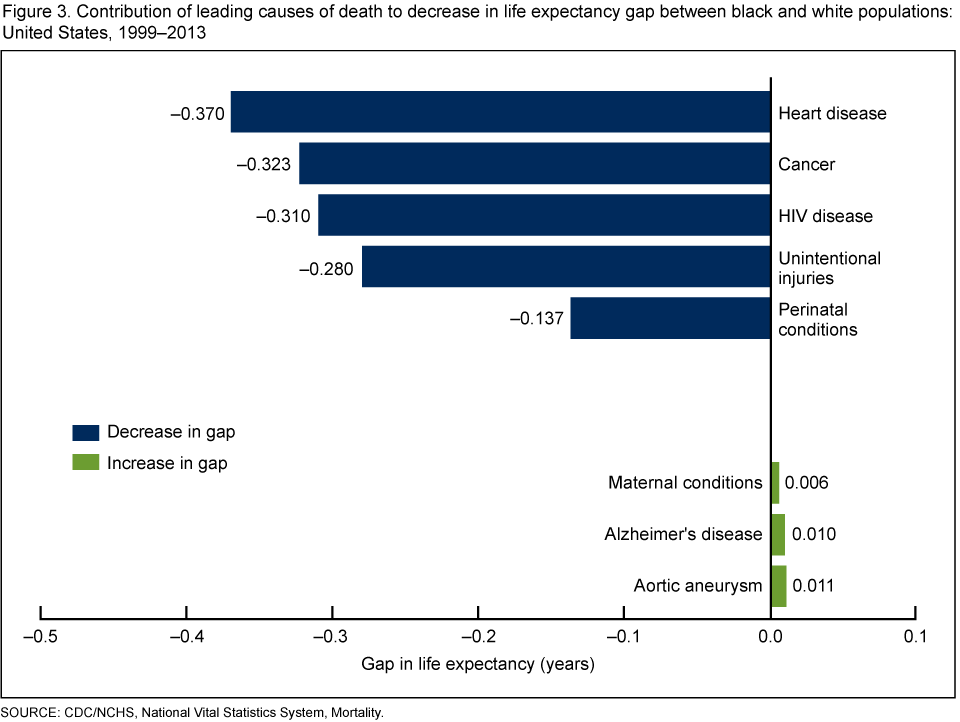
- The decrease in the gap in life expectancy between the black and white populations was due to larger decreases in death rates for the black population for heart disease, cancer, HIV disease, unintentional injuries, and perinatal conditions (Figure 3), which together accounted for 59.1% of the 2.3-year decrease in the gap.
- Greater decreases in heart disease mortality for the black population accounted for 0.370 year of the decrease in the gap in life expectancy.
- The decline in the gap was attenuated somewhat by greater increases in death rates from aortic aneurysm, Alzheimer’s disease, and maternal conditions (Figure 3) for the black population. The increase in death rates for these causes accounted for 90.6% of the total increase in the gap.
Figure 3. Contribution of leading causes of death to decrease in life expectancy gap between black and white populations: United States, 1999–2013
SOURCE: CDC/NCHS, National Vital Statistics System, Mortality.
What leading causes of death influenced the decrease in the gap in life expectancy between the black and white male populations from 1999 to 2013?
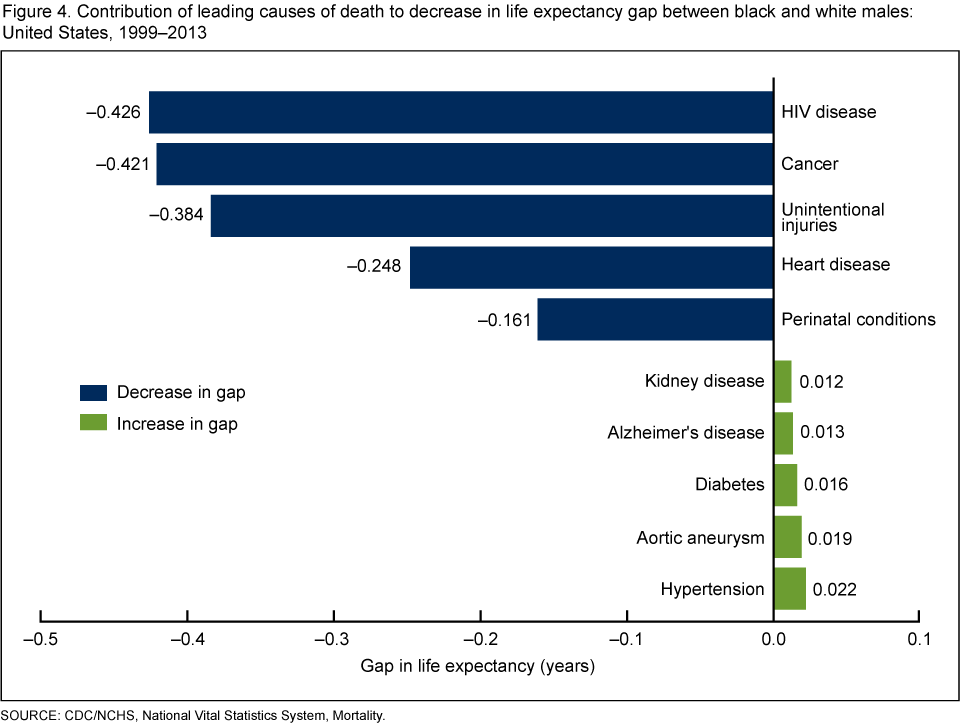
- Greater decreases in death rates for black males due to HIV disease, cancer, unintentional injuries, heart disease, and perinatal conditions (Figure 4) together accounted for 64.8% of the 2.4-year decrease in the gap.
- Greater decreases in HIV disease mortality alone accounted for 0.426 year in the decrease in the gap in life expectancy between black and white males.
- Greater increases in death rates for black males due to hypertension, aortic aneurysm, diabetes, Alzheimer’s disease, and kidney disease attenuated the decline in the gap between black and white males over the period.
Figure 4. Contribution of leading causes of death to decrease in life expectancy gap between black and white males: United States, 1999–2013
SOURCE: CDC/NCHS, National Vital Statistics System, Mortality.
What leading causes of death influenced the decrease in the gap in life expectancy between the black and white female populations from 1999 to 2013?
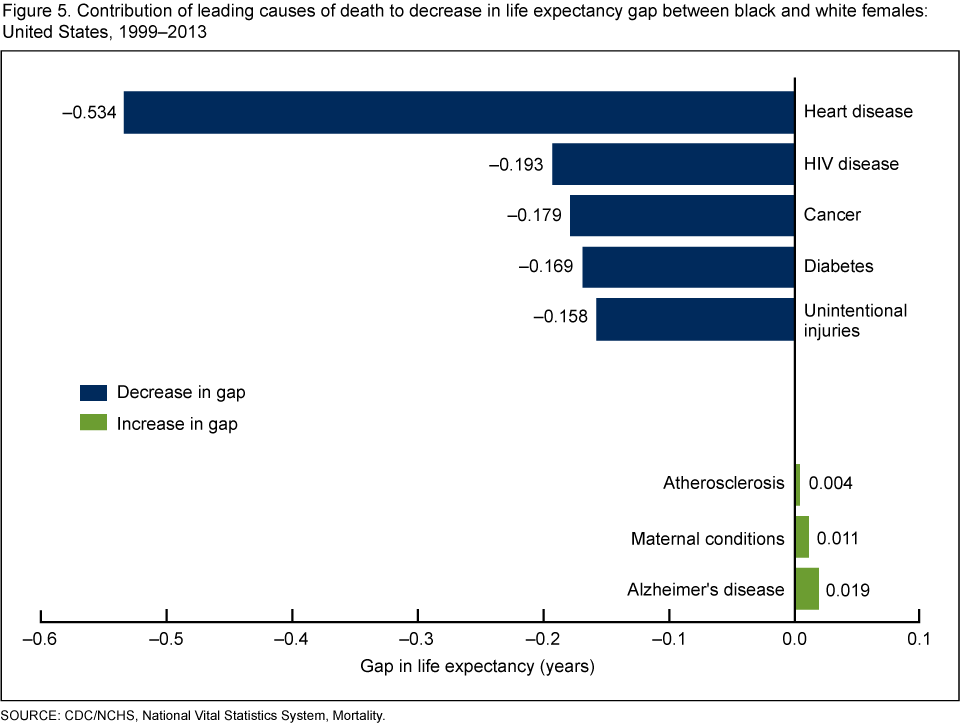
- Greater decreases in death rates for black females due to heart disease, HIV disease, cancer, diabetes, and unintentional injuries (Figure 5) together accounted for 54.7% of the 2.2-year decrease in the gap.
- Greater decreases in heart disease mortality alone accounted for 0.534 year in the decrease in the gap in life expectancy between black and white females.
- Greater increases in death rates for black females due to Alzheimer’s disease, maternal conditions, and atherosclerosis attenuated the decline in the gap between black and white females over the same period.
Figure 5. Contribution of leading causes of death to decrease in life expectancy gap between black and white females: United States, 1999–2013
SOURCE: CDC/NCHS, National Vital Statistics System, Mortality.
Summary
Life expectancy at birth has increased steadily since 1900 to a record 78.8 years in 2013. But differences in life expectancy between the white and black populations still exist, despite a decrease in the life expectancy gap from 5.9 years in 1999 to 3.6 years in 2013. Differences in the change over time in the leading causes of death for the black and white populations have contributed to this decrease in the gap in life expectancy.
Between 1999 and 2013, the decrease in the life expectancy gap between the black and white populations was mostly due to greater decreases in mortality from heart disease, cancer, HIV disease, unintentional injuries, and perinatal conditions among the black population. Similarly, the decrease in the gap between black and white male life expectancy was due to greater decreases in death rates for HIV disease, cancer, unintentional injuries, heart disease, and perinatal conditions in black males. For black females, greater decreases in diabetes death rates, combined with decreased rates for heart disease and HIV disease, were the major causes contributing to the decrease in the life expectancy gap with white females.
The decrease in the gap in life expectancy between the white and black populations would have been larger than 3.6 years if not for increases in death rates for the black population for aortic aneurysm, Alzheimer’s disease, and maternal conditions. For black males, the causes that showed increases in death rates over white males were hypertension, aortic aneurysm, diabetes, Alzheimer’s disease, and kidney disease, while the causes that showed increases in death rates for black females were Alzheimer’s disease, maternal conditions, and atherosclerosis.
This NCHS Data Brief is the second in a series of data briefs that explore the causes of death contributing to differences in life expectancy between detailed ethnic and racial populations in the United States. The first data brief focused on the racial differences in life expectancy for a single year, 2010 (3).
Definitions
Cause-of-death classification: Medical information—including injury diagnoses and external causes of injury—that is entered on death certificates filed in the United States and classified and coded in accordance with the International Statistical Classification of Diseases and Related Health Problems, Tenth Revision (ICD–10) (7). Corresponding cause-of-death categories and ICD–10 codes presented in this report are:
- Heart disease (Diseases of heart, I00–I09, I11, I13, I20–I51)
- Cancer (Malignant neoplasms, C00–C97)
- Unintentional injuries (Accidents, V01–X59, Y85–Y86)
- Alzheimer’s disease (G30)
- Diabetes (Diabetes mellitus, E10–E14)
- Kidney disease (Nephritis, nephrotic syndrome and nephrosis, N00–N07, N17–N19, N25–N27)
- Hypertension (Essential hypertension and hypertensive renal disease, I10, I12, I15)
- Perinatal conditions (Certain conditions originating in the perinatal period, P00–P96)
- Aortic aneurysm (Aortic aneurysm and dissection, I71)
- HIV disease (Human immunodeficiency virus [HIV] disease, B20–B24)
- Maternal conditions (Pregnancy, childbirth and the puerperium, O00–O99)
- Atherosclerosis (I70)
Life expectancy: The average number of years that a group of infants would live if the group was to experience throughout life the age-specific death rates present in the year of birth. Also referred to as period, or current life expectancy (1).
Data source and methods
All data are from the 1999 and 2013 mortality files of the National Vital Statistics System. Life table methodology is explained in the NCHS reports “Deaths: Final Data for 2013” (1) and “United States Life Tables, 2010” (4). A complete description of the Arriaga life table partitioning methodology is available elsewhere (5,6).
About the authors
Kenneth D. Kochanek, Elizabeth Arias, and Robert N. Anderson are with CDC’s National Center for Health Statistics, Division of Vital Statistics, Mortality Statistics Branch.
References
- Xu JQ, Murphy SL, Kochanek KD. Deaths: Final data for 2013. National vital statistics reports; vol 64 no 2. Hyattsville, MD: National Center for Health Statistics. 2016 [Forthcoming].
- U.S. Department of Health and Human Services. Developing Healthy People 2020, Phase I report: Recommendations for the framework and format of Healthy People 2020, Appendix II: Measuring health disparities and health equity. 2008.
- Kochanek KD, Arias E, Anderson RN. How did cause of death contribute to racial differences in life expectancy in the United States in 2010? NCHS data brief, no 125. Hyattsville, MD: National Center for Health Statistics. 2013.
- Arias E. United States life tables, 2010. National vital statistics reports; vol 63 no 7. Hyattsville, MD: National Center for Health Statistics. 2014.
- Arriaga E. Measuring and explaining the change in life expectancies. Demography 21(1):83–96. 1984.
- Arriaga EE. Changing trends in mortality decline during the last decades. In: Ruzicka L, Wunsch G, Kane P, editors. Differential mortality: Methodological issues and biosocial factors. Oxford, England: Clarendon Press. 1989.
- WHO. International statistical classification of diseases and related health problems, tenth revision (ICD–10). 2nd edition. Geneva, Switzerland. 2004.
Suggested citation
Kochanek KD, Arias E, Anderson RN. Leading causes of death contributing to decrease in life expectancy gap between black and white populations: United States, 1999–2013. NCHS data brief, no 218. Hyattsville, MD: National Center for Health Statistics. 2015.
Copyright information
All material appearing in this report is in the public domain and may be reproduced or copied without permission; citation as to source, however, is appreciated.
National Center for Health Statistics
Charles J. Rothwell, M.S., M.B.A., Director
Nathaniel Schenker, Ph.D., Deputy Director
Jennifer H. Madans, Ph.D., Associate Director for Science
Division of Vital Statistics
Delton Atkinson, M.P.H., M.P.H., P.M.P., Director
Hanyu Ni, Ph.D., M.P.H., Associate Director for Science