Differences in Stroke Mortality Among Adults Aged 45 and Over: United States, 2010–2013
- Key findings
- Stroke mortality among adults aged 45 and over varied by race and Hispanic origin and sex during 2010–2013.
- The age distribution of stroke deaths varied by race and Hispanic origin during 2010–2013.
- Stroke mortality among persons aged 45 and over decreased with increasing county median household income during 2010–2013.
- During 2010–2013, stroke mortality among persons aged 45 and over increased as place of residence became more rural.
- Among persons aged 45 and over, stroke mortality inside and outside the Stroke Belt varied by race and Hispanic origin during 2010–2013.
- Summary
- Definitions
- Data sources and methods
- About the authors
- References
- Suggested citation
NCHS Data Brief No. 207, July 2015
PDF Version (612 KB)
Deborah D. Ingram, Ph.D.; and Jessica A. Montresor-Lopez, M.P.H.
Key findings
Data from the National Vital Statistics System, Mortality
- During 2010–2013, the age-adjusted stroke death rate for non-Hispanic black men aged 45 and over (154.8 deaths per 100,000 population) was 54% to 68% higher than the rates for men of the same age in other race-ethnicity groups. The rate for non-Hispanic black women aged 45 and over was 30% to 61% higher than the rates for women of the same age in other race-ethnicity groups.
- The age distribution of stroke deaths differed by race and ethnicity.
- Stroke death rates were 32% higher in counties in the lowest median household income quartile than in counties in the highest income quartile.
- Nonmetropolitan counties had higher stroke death rates than counties at other urbanization levels.
- Stroke mortality inside and outside the Stroke Belt differed by race and ethnicity.
Despite steady decreases in U.S. stroke mortality over the past several decades, stroke remained the fourth leading cause of death during 2010–2012 and the fifth leading cause in 2013 (1–3). Most studies have focused on the excess mortality experienced by black persons compared with white persons and by residents of the southeastern states, referred to as the Stroke Belt (2–7). Few stroke mortality studies have focused on Asian or Pacific Islander and Hispanic persons or have explored urban–rural differences. This report provides updated information about stroke mortality among U.S. residents aged 45 and over during 2010–2013 by age, race and ethnicity, income,
urban–rural residence, and residence inside or outside the Stroke Belt.
Keywords: health disparities, Stroke Belt, urban–rural, cerebrovascular diseases
Stroke mortality among adults aged 45 and over varied by race and Hispanic origin and sex during 2010–2013.
- The age-adjusted stroke death rate for non-Hispanic black men aged 45 and over (154.8 deaths per 100,000 population) was 54% higher than the rate for non-Hispanic white men, 67% higher than the rate for non-Hispanic Asian or Pacific Islander men, and 68% higher than the rate for Hispanic men of the same age (Figure 1).
- The rate for non-Hispanic black women (131.4 per 100,000 population) was 30% higher than the rate for non-Hispanic white women, 58% higher than the rate for non-Hispanic Asian or Pacific Islander women, and 61% higher than the rate for Hispanic women of the same age.
- Non-Hispanic Asian or Pacific Islander and Hispanic men and women had the lowest
age-adjusted stroke death rates (men: 92.8 and 91.9 per 100,000 population; women: 83.0 and 81.6). - Non-Hispanic white men and women aged 45 and over had similar age-adjusted stroke death rates (100.7 and 101.1 deaths per 100,000 population). Men in the other race-ethnicity groups had higher age-adjusted stroke death rates than women of the same race and ethnicity (12% to 18% higher).
Figure 1. Age-adjusted stroke death rates among men and women aged 45 and over, by race and Hispanic origin: average annual, 2010–2013
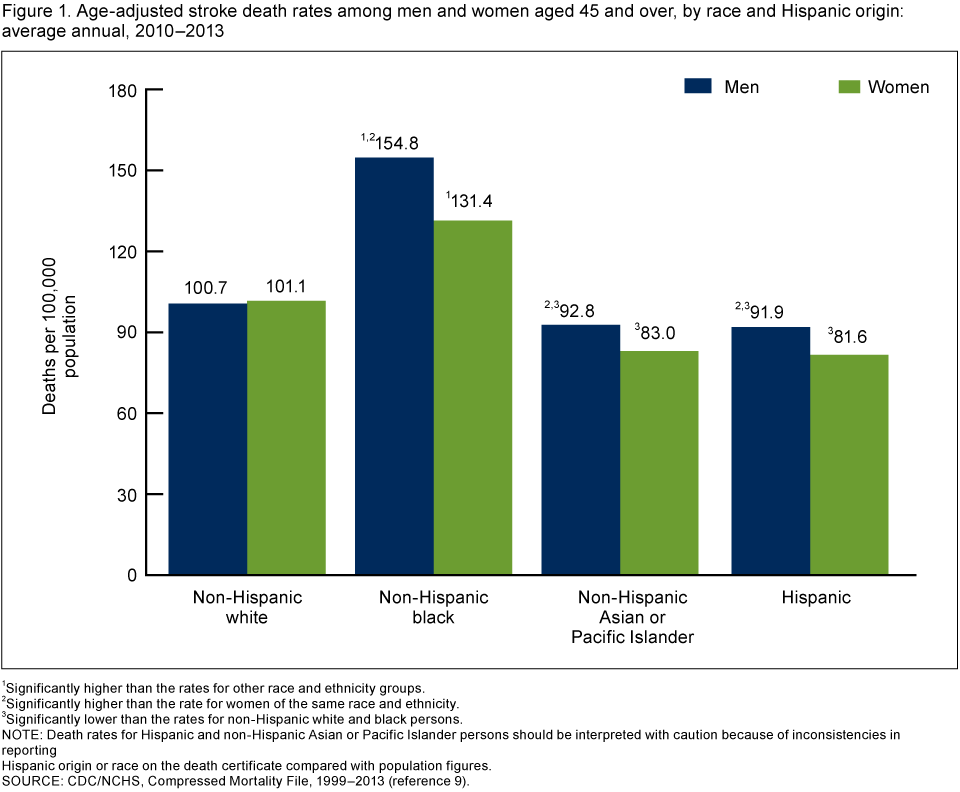
1Significantly higher than the rates for other race and ethnicity groups.
2Significantly higher than the rate for women of the same race and ethnicity.
3Significantly lower than the rates for non-Hispanic white and black persons.
NOTE: Death rates for Hispanic and non-Hispanic Asian or Pacific Islander persons should be interpreted with caution because of inconsistencies in reporting Hispanic origin or race on the death certificate compared with population figures.
SOURCE: CDC/NCHS, Compressed Mortality File, 1999–2013 (reference 9).
The age distribution of stroke deaths varied by race and Hispanic origin during 2010–2013.
- More than one-fourth of the stroke deaths among non-Hispanic black persons aged 45 and over (28.6%) occurred to those in the youngest age group (45–64) (Figure 2). By contrast, the portion of stroke deaths in this age group among the other race˗ethnicity groups ranged from one-tenth among non-Hispanic white persons (10.0%) to less than one-fourth among Hispanic persons (22.4%).
Figure 2. Stroke deaths, by age group and race and Hispanic origin: average annual, 2010–2013
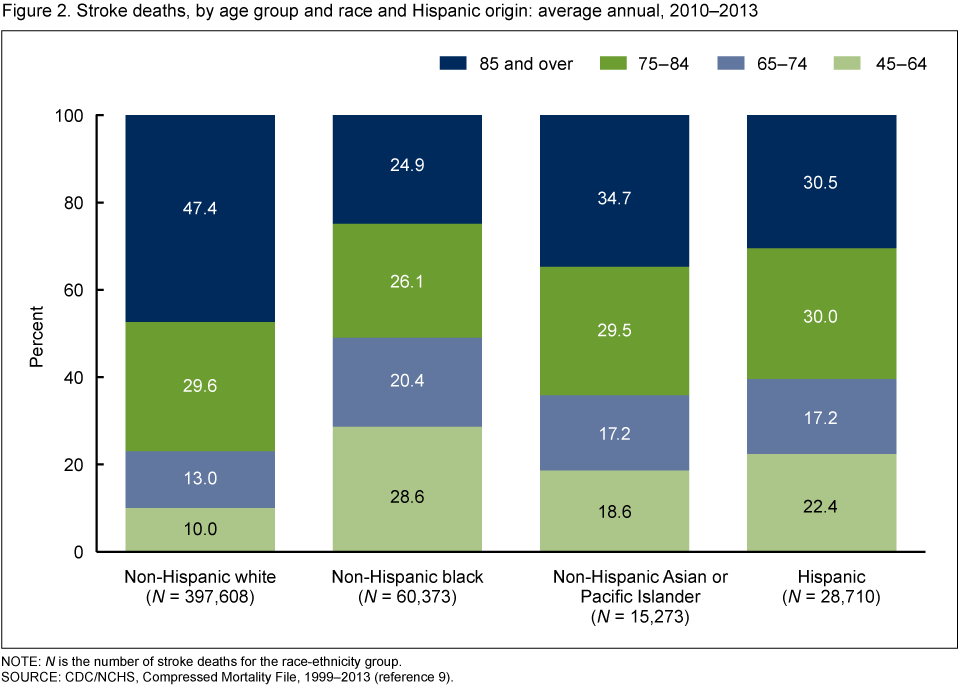
NOTE: N is the number of stroke deaths for the race-ethnicity group.
SOURCE: CDC/NCHS, Compressed Mortality File, 1999–2013 (reference 9).
- The portion of stroke deaths in the oldest age group (85 and over) was largest among non-Hispanic white persons (nearly one-half or 47.4%) and smallest among non-Hispanic black persons (one-fourth or 24.9%).
- The percent distribution of stroke deaths by age was similar among non-Hispanic Asian or Pacific Islander and Hispanic persons.
Stroke mortality among persons aged 45 and over decreased with increasing county median household income during 2010–2013.
- The age-adjusted stroke death rate for persons aged 45 and over decreased as county median household income increased (Figure 3).
- The age-adjusted stroke death rate for persons residing in counties in the lowest median household income quartile was 32% higher than the rate for persons residing in counties in the highest quartile (126.9 compared with 96.1 deaths per 100,000 population).
Figure 3. Age-adjusted stroke death rates among persons aged 45 and over, by county median household income quartile: average annual, 2010–2013
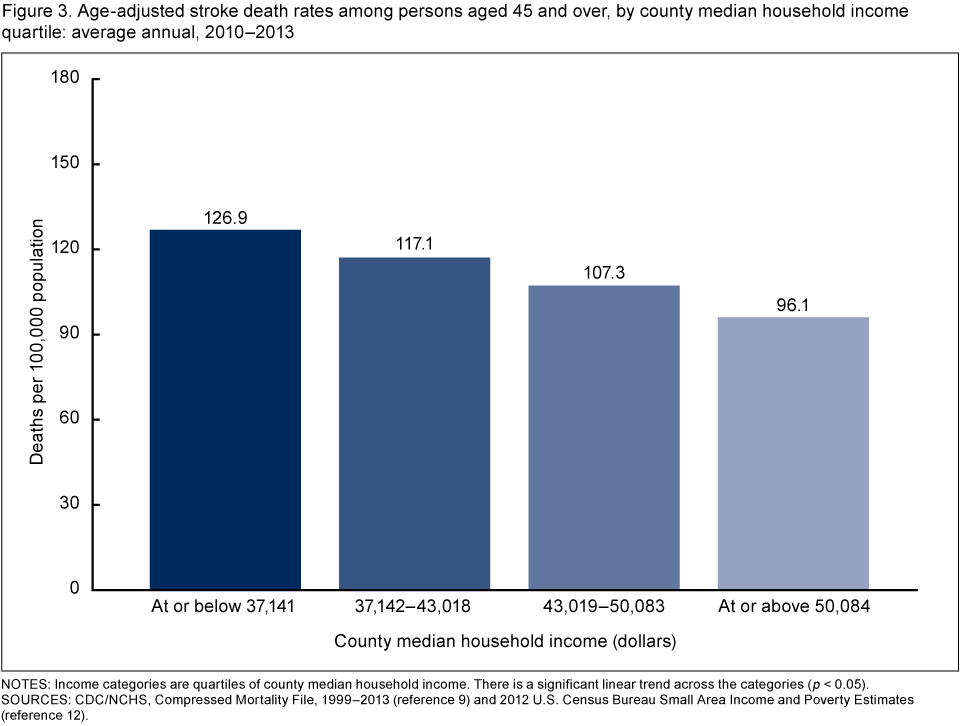
NOTES: Income categories are quartiles of county median household income. There is a significant linear trend across the categories (p < 0.05).
SOURCES: CDC/NCHS, Compressed Mortality File, 1999–2013 (reference 9) and 2012 U.S. Census Bureau Small Area Income and Poverty Estimates (reference 12).
During 2010–2013, stroke mortality among persons aged 45 and over increased as place of residence became more rural.
- Among persons aged 45 and over, age-adjusted stroke death rates were highest in nonmetropolitan counties (micropolitan and noncore: 120.5 and 121.0 deaths per 100,000 population) and lowest in large central and large fringe metro counties (97.6 and 96.8) (Figure 4).
Figure 4. Age-adjusted stroke death rates among persons aged 45 and over, by urbanization level of county of residence: average annual, 2010–2013
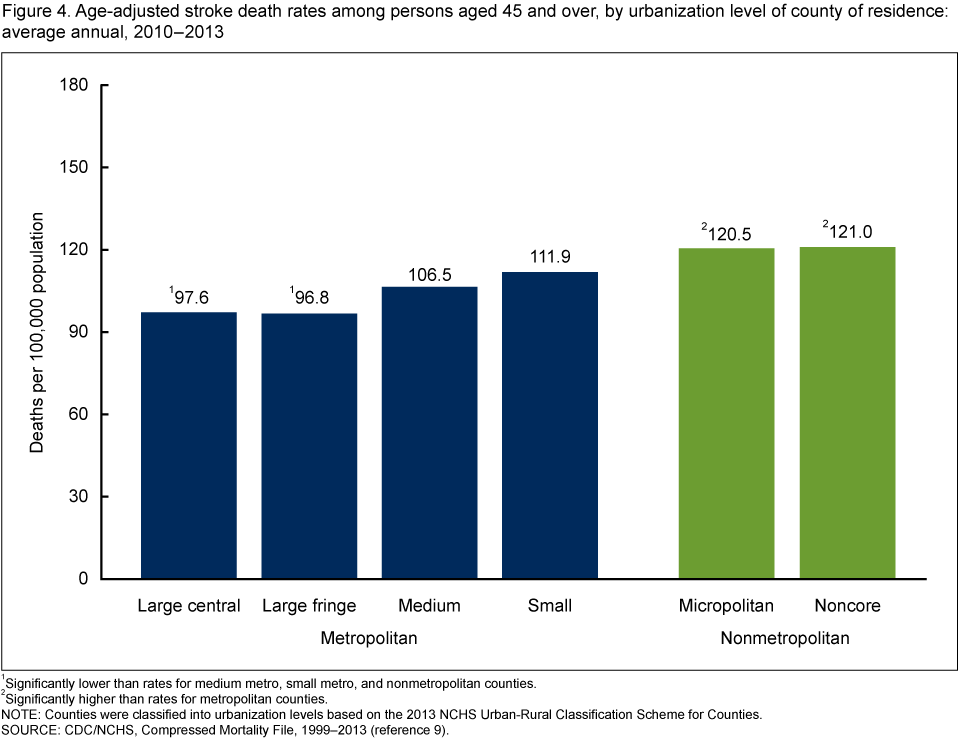
1Significantly lower than rates for medium metro, small metro, and nonmetropolitan counties.
2Significantly higher than rates for metropolitan counties.
NOTE: Counties were classified into urbanization levels based on the 2013 NCHS Urban-Rural Classification Scheme for Counties.
SOURCE: CDC/NCHS, Compressed Mortality File, 1999–2013 (reference 9).
Among persons aged 45 and over, stroke mortality inside and outside the Stroke Belt varied by race and Hispanic origin during 2010–2013.
- Non-Hispanic black and non-Hispanic white persons aged 45 and over residing inside the Stroke Belt experienced excess stroke mortality compared with their counterparts residing outside the Stroke Belt (22% and 21% higher mortality) (Figure 5).
- The age-adjusted stroke death rate for non-Hispanic Asian or Pacific Islander persons residing inside the Stroke Belt did not differ from the rate for those residing outside the Stroke Belt (88.0 compared with 87.4 deaths per 100,000 population).
- In contrast to the other population groups, Hispanic persons residing inside the Stroke Belt had substantially lower stroke mortality than Hispanic persons residing outside the Stroke Belt (50.8 compared with 87.6 deaths per 100,000 population).
Figure 5. Age-adjusted stroke death rates among persons aged 45 and over, by residence inside or outside the Stroke Belt and race and Hispanic origin: average annual, 2010–2013
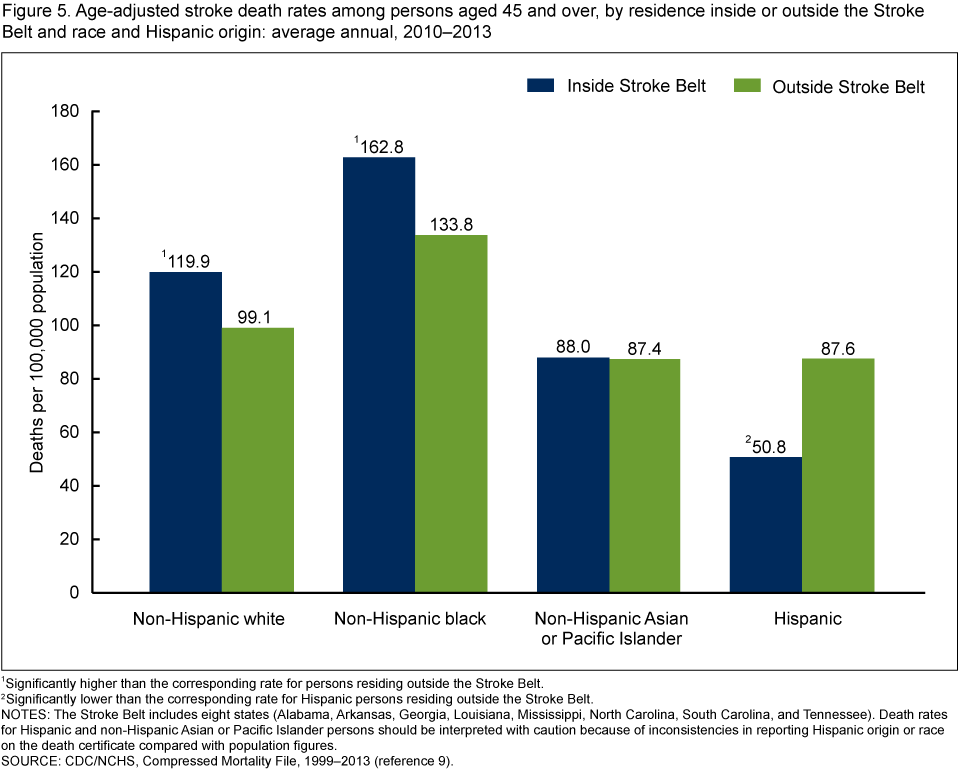
1Significantly higher than the corresponding rate for persons residing outside the Stroke Belt.
2Significantly lower than the corresponding rate for Hispanic persons residing outside the Stroke Belt.
NOTES: The Stroke Belt includes eight states (Alabama, Arkansas, Georgia, Louisiana, Mississippi, North Carolina, South Carolina, and Tennessee). Death rates for Hispanic and non-Hispanic Asian or Pacific Islander persons should be interpreted with caution because of inconsistencies in reporting Hispanic origin or race on the death certificate compared with population figures.
SOURCE: CDC/NCHS, Compressed Mortality File, 1999–2013 (reference 9).
Summary
An overarching goal of the Healthy People 2020 initiative is “to achieve health equity, eliminate disparities, and improve the health of all groups” in the United States (8). Despite significant declines in stroke mortality in recent decades, stroke continues to be one of the leading causes of death in the United States, and sociodemographic and geographic disparities persist (2–7). Consequently, there is an ongoing need to monitor the current magnitude and patterns of stroke mortality. This report describes current variations in stroke mortality by age, race and Hispanic origin, median household income, urbanization level of county of residence, and residence inside or outside the Stroke Belt.
During 2010–2013, stroke mortality among persons aged 45 and over varied by age and race and Hispanic origin. Non-Hispanic black persons had a markedly higher stroke death rate than any of the three other race-ethnicity groups, and a greater portion of their stroke deaths occurred at younger ages (45–64). Non-Hispanic Asian or Pacific Islander and Hispanic persons had lower rates than either non-Hispanic black or non-Hispanic white persons. For non-Hispanic white persons, a larger portion of stroke deaths occurred among those aged 85 and over, and a smaller portion occurred among those aged 45–64 compared with the other race-ethnicity groups. Except among non-Hispanic white persons, men had higher stroke death rates than women.
Disparities in stroke mortality also were observed by place of residence. Stroke mortality was higher for persons residing in counties with lower median household income than for persons residing in counties with higher median household income. Persons residing in nonmetropolitan counties (micropolitan and noncore) had the highest stroke mortality rates; those residing in the most urban counties (large central and large fringe metro) had the lowest rates. Excess stroke mortality was observed for non-Hispanic white and non-Hispanic black residents of the Stroke Belt but not for non-Hispanic Asian or Pacific Islander and Hispanic persons. Asian or Pacific Islander persons residing inside the Stroke Belt had a stroke death rate similar to those residing outside, while Hispanic persons residing inside the Stroke Belt had a much lower stroke death rate than those residing outside.
Definitions
Death rate, average annual: Computed by dividing the number of stroke deaths that occurred during 2010–2013 by the sum of the populations for 2010–2013. Age-adjusted rates were computed using the direct method and adjusted using the year 2000 U.S. standard population.
Metropolitan counties: Counties in metropolitan statistical areas (MSAs), as defined by the Office of Management and Budget (OMB).
Large central metro: Counties in MSAs of 1 million or more population that contain the largest principal city of the MSA, are contained within the MSA’s largest principal city, or contain at least 250,000 residents of any principal city.
Large fringe metro: Counties in MSAs of 1 million or more population that do not qualify as large central metro. They are considered to be “suburbs” of large cities.
Medium metro: Counties in MSAs of 250,000–999,999 population.
Small metro: Counties in MSAs of less than 250,000 population.
Nonmetropolitan counties: Counties not in MSAs.
Micropolitan: Nonmetropolitan counties in OMB-defined micropolitan statistical areas.
Noncore: Nonmetropolitan counties not in micropolitan statistical areas.
County median household income: Income of all members of a household aged 15 and over. The median divides the income distribution into two equal parts: one-half of the households falling below the median income and one-half above the median.
Stroke Belt: A portion of the southeastern United States that has experienced excess stroke mortality. Definitions of the area have varied with the number of states included ranging from 8 to 11, but 8 states are common to all definitions (5–7). In this report, the Stroke Belt includes Alabama, Arkansas, Georgia, Louisiana, Mississippi, North Carolina, South Carolina, and Tennessee.
Data sources and methods
Mortality and population data are from the National Center for Health Statistics’ 1999–2013 Compressed Mortality File (CMF) (9). CMF mortality data are from the National Vital Statistics System multiple cause-of-death files. Stroke deaths are those with International Statistical Classification of Diseases and Related Health Problems, 10th Revision underlying cause-of-death codes I60–I69 (10). Demographic information comes from death certificates. Population data for 2010 are April 1 bridged-race census counts, and for 2011–2013 are July 1 bridged-race estimates from the Vintage 2013 postcensal series. These 4 years were combined to improve statistical reliability because of the smaller number of stroke deaths among the non-Hispanic Asian or Pacific Islander and Hispanic groups.
Age-adjusted death rates were calculated using the direct method and the projected 2000 standard population. Death rates for Hispanic and Asian or Pacific Islander persons should be interpreted with caution because of inconsistencies in reporting Hispanic origin or race on the death certificate (death rate numerators) compared with population figures (death rate denominators). The net effect of misclassification is an underestimation of death rates for Hispanic persons and for races other than white or black (11).
County median household income comes from 2012 state and county estimates from the U.S. Census Bureau’s Small Area Income and Poverty Estimates (12). Urbanization level is from the 2013 NCHS Urban–Rural Classification Scheme for Counties (13).
The Bonferonni inequality was used to establish the critical value for statistically significant differences (overall level of significance of 0.05) based on the number of comparisons of interest for a given chart. Terms relating to differences, such as “higher than” or “lower than” indicate that the difference is statistically significant. Lack of comment regarding the difference does not mean that the difference was not significant.
About the authors
Deborah D. Ingram is with CDC’s National Center for Health Statistics, Office of Analysis and Epidemiology (OAE), and Jessica A. Montresor-Lopez is an OAE student intern from the University of Maryland School of Public Health.
References
- Kochanek KD, Murphy SL, Xu JQ, Arias E. Mortality in the United States, 2013. NCHS data brief, no 178. Hyattsville, MD: National Center for Health Statistics. 2014.
- National Center for Health Statistics. Health, United States, 2013: With special feature on prescription drugs. Table 27. Hyattsville, MD. 2014.
-
Xu J. QuickStats: Age-adjusted death rate for stroke, by Hispanic ethnicity, race for
non-Hispanic population, and sex—United States, 2000–2013. MMWR 64(04):113. 2015. -
Howard G. Ancel Keys lecture: Adventures (and misadventures) in understanding
(and reducing) disparities in stroke mortality. Stroke 44(11):3254–9. 2013. - Sergeev AV. Racial and rural–urban disparities in stroke mortality outside the Stroke Belt. Ethn Dis 21(3):307–13. 2011.
- Feinleib M, Ingster L, Rosenberg H, Maurer J, Singh G, Kochanek K. Time trends, cohort effects, and geographic patterns in stroke mortality—United States. Ann Epidemiol 3(5):458–65. 1993.
- Howard G, Labarthe DR, Hu J, Yoon S, Howard VJ. Regional differences in African Americans’ high risk for stroke: The remarkable burden of stroke for Southern African Americans. Ann Epidemiol 17(9):689–96. 2007.
- HHS. Healthy People 2020. Washington, DC.
- NCHS. Compressed Mortality File 1999–2013. CD-ROM Series 20 no 2S as compiled from data provided by the 57 vital statistics jurisdictions through the Vital Statistics Cooperative Program. Hyattsville, MD. 2015.
- WHO. International statistical classification of diseases and related health problems, 10th revision (ICD–10). 2008 ed. Geneva, Switzerland. 2009.
- Arias E, Schauman WS, Eschbach K, et al. The validity of race and Hispanic origin reporting on death certificates in the United States. National Center for Health Statistics. Vital Health Stat 2(148). 2008.
- U.S. Census Bureau. Small area income and poverty estimates: State and county estimates for 2012.
- Ingram DD, Franco SJ. 2013 NCHS urban–rural classification scheme for counties. National Center for Health Statistics. Vital Health Stat 2(166). 2014.
Suggested citation
Ingram DD, Montresor-Lopez JA. Differences in stroke mortality among adults aged 45 and over: United States, 2010–2013. NCHS data brief, no 207. Hyattsville, MD: National Center for Health Statistics. 2015.
Copyright information
All material appearing in this report is in the public domain and may be reproduced or copied without permission; citation as to source, however, is appreciated.
National Center for Health Statistics
Charles J. Rothwell, M.S., M.B.A., Director
Nathaniel Schenker, Ph.D., Deputy Director
Jennifer H. Madans, Ph.D., Associate Director for Science
Office of Analysis and Epidemiology
Irma E. Arispe, Ph.D., Director