HIV Testing in the Past Year Among the U.S. Household Population Aged 15–44: 2011–2013
- Key findings
- In 2011–2013, HIV testing in the past year among persons aged 15–44 had increased to 19% overall.
- Among females, the percentage tested for HIV in the past year varied by age, race and Hispanic origin, and education.
- Among males, the percentage tested for HIV in the past year varied by age and race and Hispanic origin, but not by education.
- Testing for HIV in the past year varied by opposite-sex and same-sex sexual contact.
- Percentages tested for HIV in the past year varied by number and sex of sexual partners.
- Summary
- Definitions
- Data source and methods
- About the authors
- References
- Suggested citation
NCHS Data Brief No. 202, June 2015
PDF Version (684 KB)
Casey E. Copen, M.P.H., Ph.D.; Anjani Chandra, Ph.D.; and Isaedmarie Febo-Vazquez, M.S.
Key findings
Data from the National Survey of Family Growth, 2011–2013
- Overall, 19% of persons aged 15–44 in 2011–2013 had been tested for HIV in the past year, including 22% of females and 16% of males.
- Higher percentages of HIV testing in the past year were seen for persons aged 15–34 compared with those aged 35–44, and for non-Hispanic black persons compared with other race and ethnicity groups.
- Four of 10 males who had same-sex sexual contact in the past year had been tested for HIV in the past year, compared with 2 of 10 who had opposite-sex sexual contact in the past year.
- Levels of HIV testing in the past year were higher for persons with behaviors that increase HIV risk, including having one or more same-sex partners or higher numbers of opposite-sex sexual partners in the past year.
In 2011, more than 1 million Americans aged 13 and over were living with HIV infection, and one in seven did not know their infection status (1). Routine, voluntary HIV testing is a recognized way to reduce HIV transmission (2). Using data from the 2011–2013 National Survey of Family Growth (NSFG), this report updates nationally representative estimates and trends for HIV testing in the past year (excluding donation of blood or blood products, during which individuals are routinely tested) among the U.S. household population aged 15–44. Patterns of reported HIV testing in 2011–2013 are shown by age, race and Hispanic origin, education, and selected sexual behaviors that may be related to an elevated risk of HIV infection (3,4).
Keywords: human immunodeficiency virus, HIV risk, sexual behaviors, National Survey of Family Growth
In 2011–2013, HIV testing in the past year among persons aged 15–44 had increased to 19% overall.
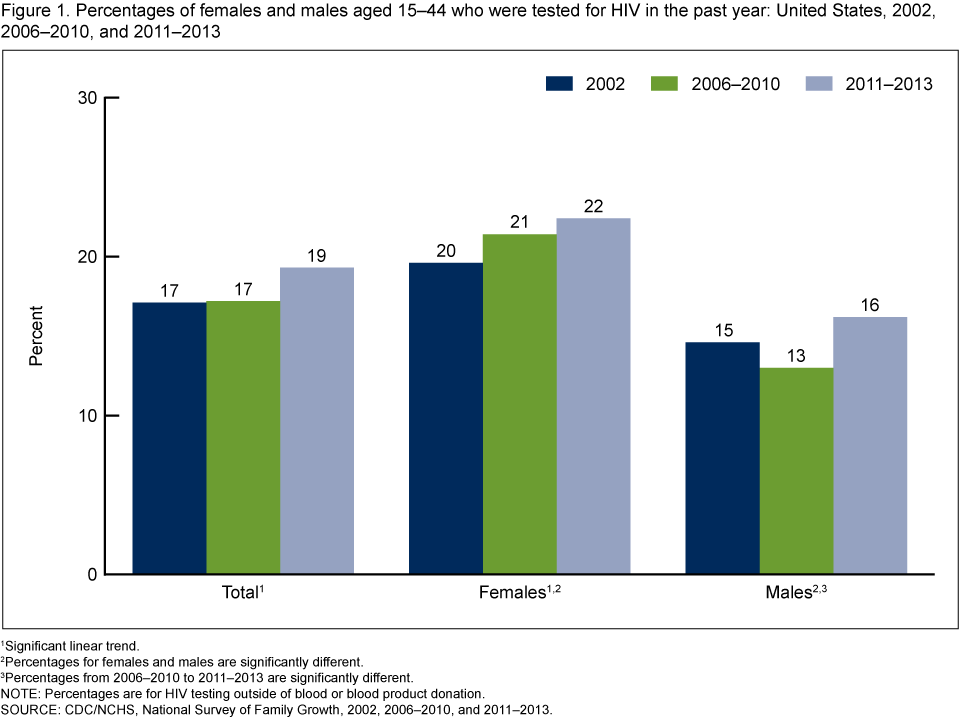
Figure 1. Percentages of females and males aged 15–44 who were tested for HIV in the past year: United States, 2002, 2006–2010, and 2011–2013
1Significant linear trend.
2Percentages for females and males are significantly different.
3Percentages from 2006–2010 to 2011–2013 are significantly different.
NOTE: Percentages are for HIV testing outside of blood or blood product donation.
SOURCE: CDC/NCHS, National Survey of Family Growth, 2002, 2006–2010, and 2011–2013.
- In 2011–2013, 19% of persons aged 15–44 had been tested for HIV in the past year, an increase from 17% in both 2002 and 2006–2010 (Figure 1).
- Among females in 2011–2013, 22% had been tested for HIV in the past year, an increase from 20% in 2002.
- Among males in 2011–2013, 16% had been tested for HIV in the past year, with no significant increase since 2002.
- For all time periods shown, females were more likely than males to have had an HIV test in the past year.
Among females, the percentage tested for HIV in the past year varied by age, race and Hispanic origin, and education.
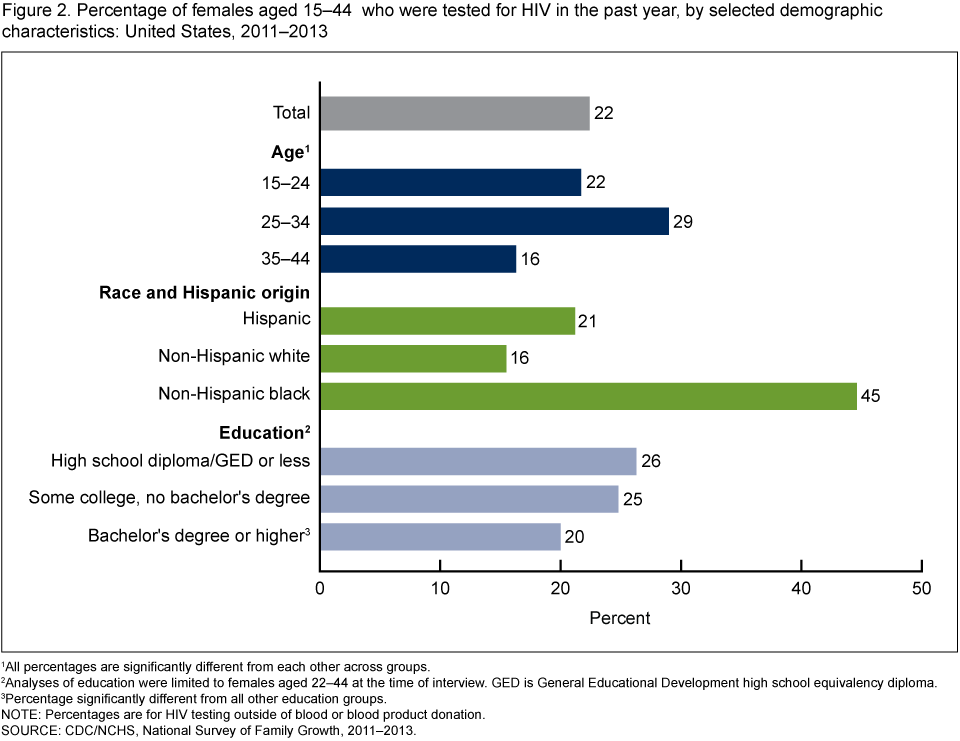
- HIV testing in the past year was most common among females aged 25–34 (29%), followed by females aged 15–24 (22%) and females aged 35–44 (16%) (Figure 2).
- Non-Hispanic black females were more likely to have been tested for HIV in the past year (45%) than Hispanic females (21%) or non-Hispanic white females (16%).
- Among females aged 22–44, HIV testing percentages in the past year were higher for those with a high school diploma or less (26%) and those with some college (25%) than for those with a bachelor’s degree or higher (20%).
Figure 2. Percentage of females aged 15–44 who were tested for HIV in the past year, by selected demographic characteristics: United States, 2011–2013
1All percentages are significantly different from each other across groups.
2Analyses of education were limited to females aged 22–44 at the time of interview. GED is General Educational Development high school equivalency diploma.
3Percentage significantly different from all other education groups.
NOTE: Percentages are for HIV testing outside of blood or blood product donation.
SOURCE: CDC/NCHS, National Survey of Family Growth, 2011–2013.
Among males, the percentage tested for HIV in the past year varied by age and race and Hispanic origin, but not by education.
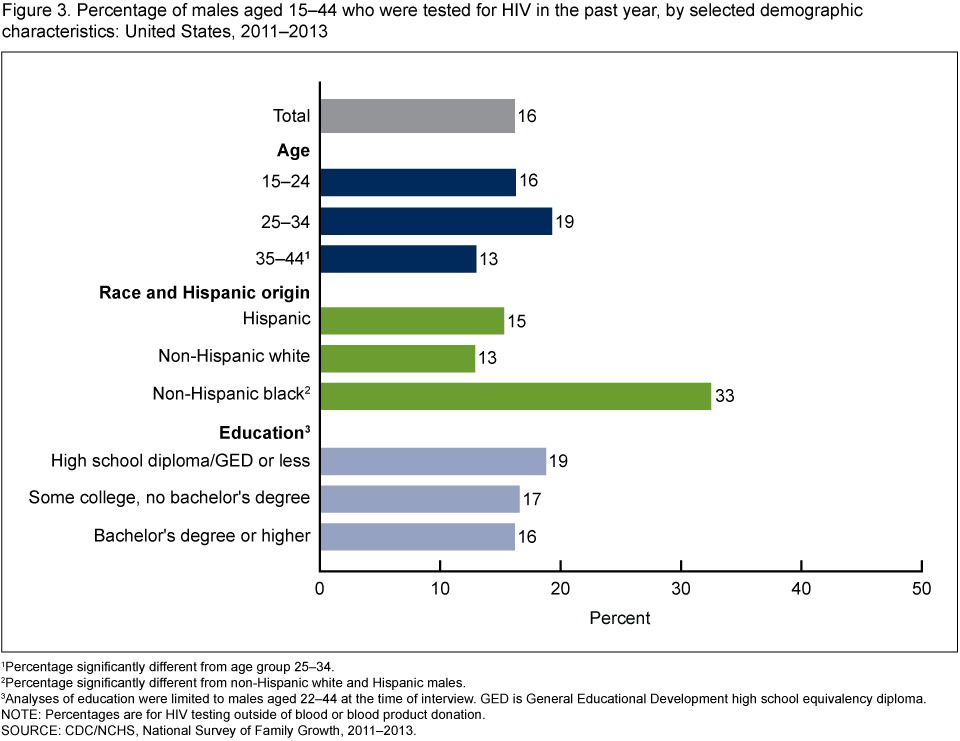
- Males aged 25–34 had a higher percentage of HIV testing in the past year (19%) than males aged 35–44 (13%) but similiar HIV testing levels to those for males aged 15–24 (16%) (Figure 3).
- As with HIV testing patterns seen for females, non-Hispanic black males were more likely to have been tested for HIV in the past year (33%) compared with Hispanic males (15%) and non-Hispanic white males (13%).
- Unlike for females, the percentage of males aged 22–44 tested for HIV in the past year did not vary significantly by education.
Figure 3. Percentage of males aged 15–44 who were tested for HIV in the past year, by selected demographic characteristics: United States, 2011–2013
1Percentage significantly different from age group 25–34.
2Percentage significantly different from non-Hispanic white and Hispanic males.
3Analyses of education were limited to males aged 22–44 at the time of interview. GED is General Educational Development high school equivalency diploma.
NOTE: Percentages are for HIV testing outside of blood or blood product donation.
SOURCE: CDC/NCHS, National Survey of Family Growth, 2011–2013.
Testing for HIV in the past year varied by opposite-sex and same-sex sexual contact.
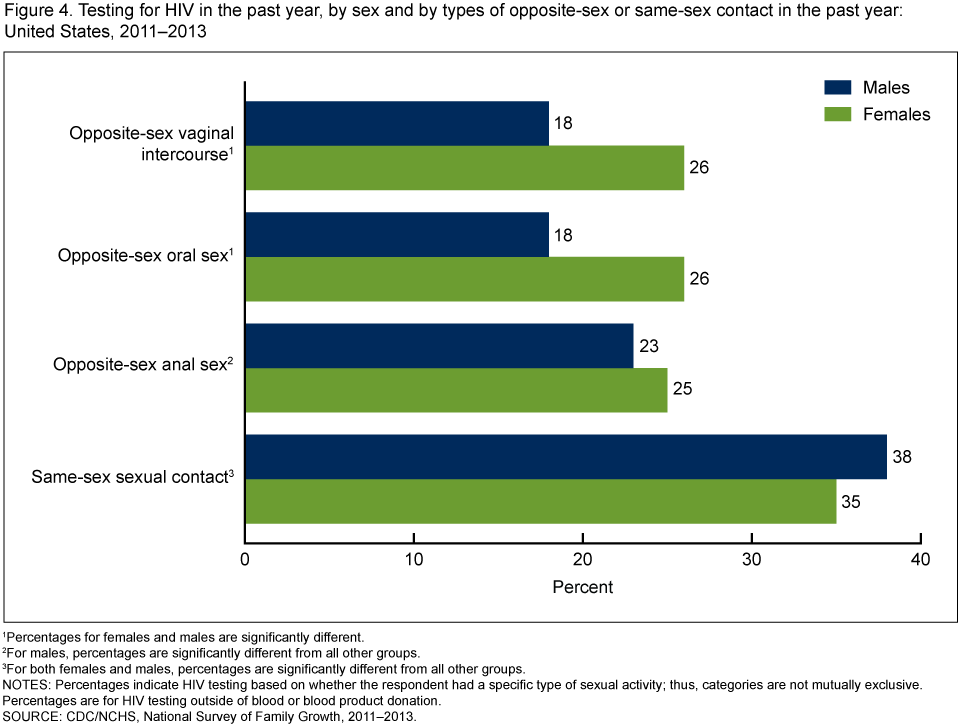
- The percentage of females tested for HIV in the past year (25%–26%) did not differ significantly by the type of opposite-sex contact in the past year (Figure 4).
- Females who reported any same-sex contact in the past year were more likely to have been tested for HIV in the past year (35%) compared with those who reported any opposite-sex contact in the past year (25%–26%).
- A higher percentage of males who had anal sex with a female partner in the past year had been tested for HIV in the past year (23%) compared with males who had oral sex or vaginal intercourse (both 18%) with a female partner in the past year.
- Four of 10 males who had same-sex contact in the past year had been tested for HIV in the past year, compared with 2 of 10 males who reported any type of opposite-sex contact in the past year.
- Females who had vaginal intercourse or oral sex with an opposite-sex partner were more likely to have been tested for HIV in the past year (both 26%) than were males (both 18%).
- Percentages of HIV testing in the past year were similar for females and males who had anal sex with an opposite-sex partner (25% and 23%, respectively) or any same-sex contact in the past year (35% females, 38% males).
Figure 4. Testing for HIV in the past year, by sex and by types of opposite-sex or same-sex contact in the past year: United States, 2011–2013
1Percentages for females and males are significantly different.
2For males, percentages are significantly different from all other groups.
3For both females and males, percentages are significantly different from all other groups.
NOTES: Percentages indicate HIV testing based on whether the respondent had a specific type of sexual activity; thus, categories are not mutually exclusive. Percentages are for HIV testing outside of blood or blood product donation.
SOURCE: CDC/NCHS, National Survey of Family Growth, 2011–2013.
Percentages tested for HIV in the past year varied by number and sex of sexual partners.
- Females and males who had one or more same-sex partners in the past year (35% and 37%, respectively) or two or more opposite-sex partners in the past year and no same-sex partners (39% females, 30% males) had higher levels of HIV testing in the past year compared with those who had only one opposite-sex partner in the past year and no same-sex partners (22% females, 14% males) or no partners in their lifetime or in the past year (6.8% females, 5.2% males) (Figure 5).
- HIV testing percentages were higher for females who had two or more opposite-sex partners and no same-sex partners (39%) or only one opposite-sex partner and no same-sex partners in the past year (22%) compared with males (30% and 14%, respectively).
Figure 5. Percentages of females and males aged 15–44 who were tested for HIV in the past year, by number and sex of sexual partners in the past year: United States, 2011–2013
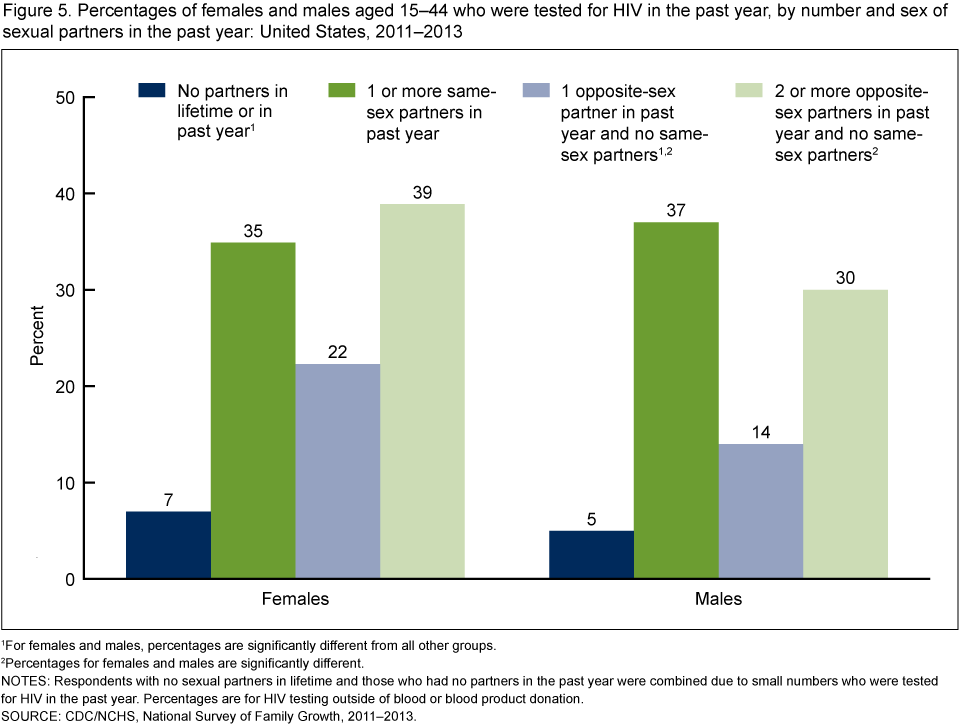
1For females and males, percentages are significantly different from all other groups.
2Percentages for females and males are significantly different.
NOTES: Respondents with no sexual partners in lifetime and those who had no partners in the past year were combined due to small numbers who were tested for HIV in the past year. Percentages are for HIV testing outside of blood or blood product donation.
SOURCE: CDC/NCHS, National Survey of Family Growth, 2011–2013.
Summary
Overall, 19% of persons aged 15–44 in 2011–2013 had been tested for HIV in the past year, including 22% of females and 16% of males. HIV testing in the past year was most common for persons aged 15–34, non-Hispanic black persons, and females aged 22–44 without a bachelor’s degree. Compared with males, females were more likely to have been tested for HIV in the past year for all time periods shown. This difference may be associated with pregnancy-related HIV testing for females who were pregnant in the past year (4). Consistent with previous results, levels of HIV testing in the past year were higher for persons with certain behaviors that may increase the risk of HIV infection, including having had a same-sex partner and having higher numbers of opposite-sex sexual partners in the past year (3,4); however, the temporal sequencing of these risk-related behaviors and the HIV test cannot be ascertained from NSFG data.
Percentages of HIV testing in the past year were similar by sex among those who had same-sex sexual contact in the past year. Among persons with same-sex experience, the risks associated with HIV acquisition and transmission are higher for males because unprotected anal intercourse carries the highest risk of sexual exposure to HIV (5). The 2006 revised recommendations on HIV testing in health care settings (6) state that people who are at higher risk for HIV infection should get tested for HIV at least annually. Results from this report can be used to track the number of people who are routinely tested for HIV, particularly among higher-risk population groups.
Definitions
Age: Respondent’s age at the time of interview.
Education: Educational attainment at the time of interview, indicating the highest degree or grade completed. Results are presented only for persons aged 22–44 because many younger persons may still be in school and not have completed their education.
Race and Hispanic origin: U.S. Office of Management and Budget (OMB) guidelines for the presentation of race and origin data in federal statistics are used for these classifications (7). Given the small sample sizes and the diversity of persons categorized as “non-Hispanic other, single and multiple race,” those results are not shown.
HIV testing in past year: NSFG asks all respondents about their donation of blood or blood products because all such donations are routinely tested for HIV. However, more detailed questions about HIV testing, including the date, reasons, and provider type for the most recent test, are asked only about tests performed outside of blood or blood product donation. As a result, this report is based on HIV testing within the past year, exclusive of any donations of blood or blood products. Females who reported HIV testing during their most recent completed pregnancy within the last 12 months are included as having been tested for HIV in the past year.
Number and sex of sexual partners in past year: In 2007, questions were added to NSFG that asked for numbers of partners by type of sex in the past year. For example, females who ever reported vaginal intercourse were asked: “Your number of male partners in the last 12 months is displayed below. Thinking of your male partners in the last 12 months, with how many of them did you have vaginal intercourse?” Females and males were asked analogous questions about numbers of opposite-sex partners by oral and anal sex, whereas males were asked questions about numbers of same-sex partners by oral and anal sex. Females were asked whether they had ever had oral sex or “any sexual experience of any kind” with another female in their lifetime, but were not asked the number of same-sex partners by type of sex in the past year. Number and sex of sexual partners by type of sex were collapsed into mutually exclusive categories that include: “No partners in lifetime or in past year,” “1 or more same-sex partners in the past year,” “1 opposite-sex partner in the past year and no same-sex partners,” and “2 or more opposite-sex partners in the past year and no same-sex partners.” The number of persons reporting exclusively same-sex partners in the past year was too small to show HIV testing percentages separately. Further details on measurement of sexual behaviors and numbers of opposite-sex and same-sex partners in NSFG are given in a prior report (8).
Data source and methods
This report is based on data collected from 5,601 females and 4,815 males in the 2011–2013 NSFG. Although HIV testing and demographic characteristics were asked directly by the interviewer, data in this report on types of sexual behavior and numbers of sexual partners were collected using the more private method of audio computer-assisted self-interviewing (ACASI). In ACASI, the respondent listens to the questions through headphones, reads them on the screen, or both, and enters his or her responses directly into the computer.
The fieldwork plan, interview content, and other procedures for the 2011–2013 NSFG are similar to prior survey years (9). All estimates in this report were weighted to reflect the reproductive-aged female and male household populations of the United States at the midpoint for each time period of the survey.
Statistics for this report were produced using SAS version 9.3 (SAS Institute, Cary, N.C.). The significance of trends was tested using weighted least-squares regression models to determine whether an apparent change over time was statistically significant, taking into account the standard error for each data point. Percentages were compared using two-tailed t tests with significance at the 0.05 level. The data presented are bivariate associations that may be explained by other factors not controlled for in the figures or included in the report.
About the authors
Casey E. Copen, Anjani Chandra, and Isaedmarie Febo-Vazquez are with CDC’s National Center for Health Statistics, Division of Vital Statistics, Reproductive Statistics Branch.
References
- CDC. Monitoring selected national HIV prevention and care objectives by using HIV surveillance data—United States and 6 dependent areas—2012 [PDF – 1.79MB]. HIV Surveillance Supplemental Report 19(3). 2014.
- U.S. Office of National AIDS Policy. National HIV/AIDS strategy for the United States [PDF – 1.20MB]. Washington, DC: The White House. 2010.
- Chandra A, Billioux VG, Copen CE, Sionean C. HIV risk-related behaviors in the United States household population aged 15–44 years: Data from the National Survey of Family Growth, 2002 and 2006–2010 [PDF – 342KB]. National health statistics reports; no 46. Hyattsville, MD: National Center for Health Statistics. 2012.
- Chandra A, Billioux VG, Copen CE, et al. HIV testing in the U.S. household population aged 15–44: Data From the National Survey of Family Growth, 2006–2010 [PDF – 421KB]. National health statistics reports; no 58. Hyattsville, MD: National Center for Health Statistics. 2012.
- Patel P, Borkowf CB, Brooks JT, Lasry A, Lansky A, Mermin J. Estimating per-act HIV transmission risk: A systematic review. AIDS 28(10):1509–19. 2014.
- CDC. Revised recommendations for HIV testing of adults, adolescents, and pregnant women in health-care settings [PDF – 255KB]. MMWR 55(RR–14):1–17. 2006.
- U.S. Office of Management and Budget. Revisions to the standards for the classification of federal data on race and ethnicity. Fed Regist 62(210):58782–90. 1997.
- Chandra A, Mosher WD, Copen C, Sionean C. Sexual behavior, sexual attraction, and sexual identity in the United States: Data from the 2006–2008 National Survey of Family Growth [PDF – 602KB]. National health statistics reports; no 36. Hyattsville, MD: National Center for Health Statistics. 2011.
- Lepkowski JM, Mosher WD, Davis KE, et al. The 2006–2010 National Survey of Family Growth: Sample design and analysis of a continuous survey [PDF – 597KB]. National Center for Health Statistics. Vital Health Stat 2(150). 2010.
Suggested citation
Copen CE, Chandra A, Febo-Vazquez I. HIV testing in the past year among the U.S. household population aged 15–44: 2011–2013. NCHS data brief, no 202. Hyattsville, MD: National Center for Health Statistics. 2015.
Copyright information
All material appearing in this report is in the public domain and may be reproduced or copied without permission; citation as to source, however, is appreciated.
National Center for Health Statistics
Charles J. Rothwell, M.S., M.B.A., Director
Nathaniel Schenker, Ph.D., Deputy Director
Jennifer H. Madans, Ph.D., Associate Director for Science
Division of Vital Statistics
Delton Atkinson, M.P.H., M.P.H., P.M.P., Director