Emergency Department Visits for Drug Poisoning: United States, 2008–2011
- Key findings
- Did ED visit rates for drug poisoning vary by age? Did the rates change from 2004–2007 to 2008–2011?
- Did ED visit rates for drug poisoning vary by sex and age in 2008–2011?
- Did ED visit rates for drug poisoning vary by intent of injury and sex in 2008–2011?
- Which drugs were associated with ED visits for drug poisoning in 2008–2011?
- What percentage of ED visits for drug poisoning led to hospitalization? Did this differ from other ED visits in 2008–2011?
- Summary
- Definitions
- Data source and methods
- About the authors
- References
- Suggested citation
NCHS Data Brief No. 196, April 2015
PDF Version (748 KB)
Michael Albert, M.D., M.P.H.; Linda F. McCaig, M.P.H.; and Sayeedha Uddin, M.D., M.P.H.
Key findings
Data from the National Hospital Ambulatory Medical Care Survey, 2008–2011
- During 2008–2011, an average of 1.1 million emergency department (ED) visits were made each year for drug poisoning, with a visit rate of 35.4 per 10,000 persons.
- The ED visit rate for drug poisoning was highest among persons aged 20–34. The rate declined with age after 20–34, and rates for those aged 0–19 were similar to those aged 50 and over.
- Drug-poisoning ED visit rates did not differ by sex and age, with the exception of persons aged 35–49, where females had a higher visit rate than males. The ED visit rate for unintentional drug poisoning was higher than self-inflicted drug poisoning overall and for males, but did not differ for females.
- About one-quarter (24.5%) of drug-poisoning ED visits resulted in hospital admission.
Poisoning is the leading cause of injury-related mortality in the United States, with more than 40,000 deaths annually (1). Drugs account for 90% of poisoning deaths, and the number of deaths from drug poisoning has increased substantially in recent years (2). The emergency department (ED) plays an important role in the treatment of poisoning. This report describes nationally representative data on ED visits for drug poisoning during 2008–2011.
Keywords: health care utilization, injury, National Hospital Ambulatory Medical Care Survey (NHAMCS)
Did ED visit rates for drug poisoning vary by age? Did the rates change from 2004–2007 to 2008–2011?
- During 2008–2011, an estimated 1.1 million ED visits for drug poisoning were made each year, comprising 2.4% of total injury-related visits.
Figure 1. Emergency department visit rates for drug poisoning, by age: United States, 2004–2007 and 2008–2011
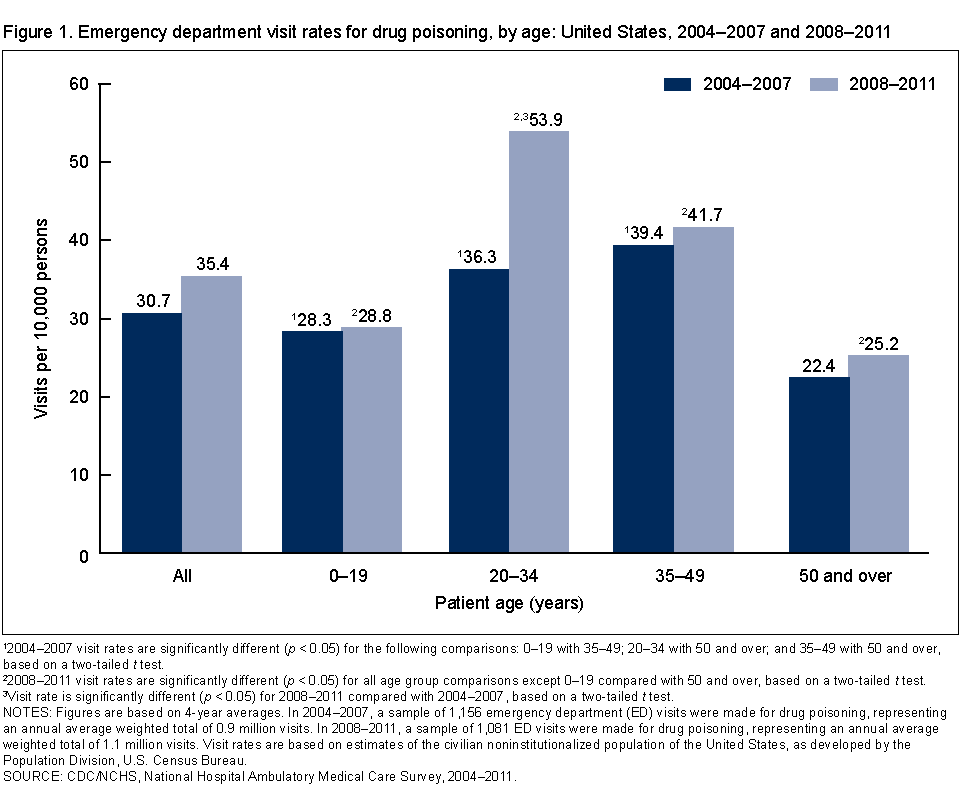
12004–2007 visit rates are significantly different (p < 0.05) for the following comparisons: 0–19 with 35–49; 20–34 with 50 and over; and 35–49 with 50 and over, based on a two-tailed t test.
22008–2011 visit rates are significantly different (p < 0.05) for all age group comparisons except 0–19 compared with 50 and over, based on a two-tailed t test.
3Visit rate is significantly different (p < 0.05) for 2008–2011 compared with 2004–2007, based on a two-tailed t test.
NOTES: Figures are based on 4-year averages. In 2004–2007, a sample of 1,156 emergency department (ED) visits were made for drug poisoning, representing an annual average weighted total of 0.9 million visits. In 2008–2011, a sample of 1,081 ED visits were made for drug poisoning, representing an annual average weighted total of 1.1 million visits. Visit rates are based on estimates of the civilian noninstitutionalized population of the United States, as developed by the Population Division, U.S. Census Bureau.
SOURCE: CDC/NCHS, National Hospital Ambulatory Medical Care Survey, 2004–2011
The overall ED visit rate for drug poisoning was 35.4 per 10,000 persons (Figure 1).
- In 2008–2011, the ED visit rate for drug poisoning was highest among persons aged 20–34. The rate increased from 28.8 per 10,000 persons among those aged 0–19 to peak at 53.9 per 10,000 persons for those aged 20–34. The rate then declined with increasing age, reaching a rate of 25.2 per 10,000 persons for those aged 50 and over.
- The ED visit rate for drug poisonings for persons aged 20–34 increased from 36.3 per 10,000 persons in 2004–2007 to 53.9 per 10,000 persons in 2008–2011. Visit rates for other age groups and the overall visit rate did not differ between the two time periods.
Did ED visit rates for drug poisoning vary by sex and age in 2008–2011?
- Among persons aged 35–49, the ED visit rate for drug poisonings was higher among females (51.2 per 10,000 persons) compared with males (31.9 per 10,000 persons). The visit rate did not differ by sex for other age groups or overall (Figure 2).
- The ED visit rate for males was higher for those in the 20–34 age group compared with other age groups.
- The ED visit rate for females was higher among those aged 20–34 and 35–49 compared with those aged 0–19 and 50 and over.
Figure 2. Emergency department visit rates for drug poisoning, by age and sex: United States, 2008–2011

1Visit rate is significantly different (p < 0.05) compared with males of other age groups, based on a two-tailed t test.
2Visit rate is significantly different (p < 0.05) compared with females aged 0–19 and 50 and over, based on a two-tailed t test.
3Visit rate is significantly different (p < 0.05) for males compared with females, based on a two-tailed t test.
NOTES: Figures are based on 4-year averages. Visit rates are based on the set of estimates of the U.S. civilian noninstitutionalized population, as developed by the Population Division, U.S. Census Bureau.
SOURCE: CDC/NCHS, National Hospital Ambulatory Medical Care Survey, 2008–2011.
Did ED visit rates for drug poisoning vary by intent of injury and sex in 2008–2011?
- The ED visit rate was highest for unintentional drug poisoning (17.0 per 10,000), followed by self-inflicted drug poisoning (13.4 per 10,000) and drug poisoning of undetermined intent (5.0 per 10,000) (Figure 3).
- The ED visit rate for unintentional drug poisoning (18.0 per 10,000 persons) was higher than the rate for self-inflicted drug poisoning (10.2 per 10,000) among males, but these rates did not differ in females (16.0 per 10,000 and 16.4 per 10,000, respectively).
- Females had a higher ED visit rate for drug poisonings that were self-inflicted compared with males. The ED visit rate for unintentional drug poisoning was not significantly different between males and females.
Figure 3. Emergency department visit rates for drug poisoning, by intent and sex: United States, 2008–2011
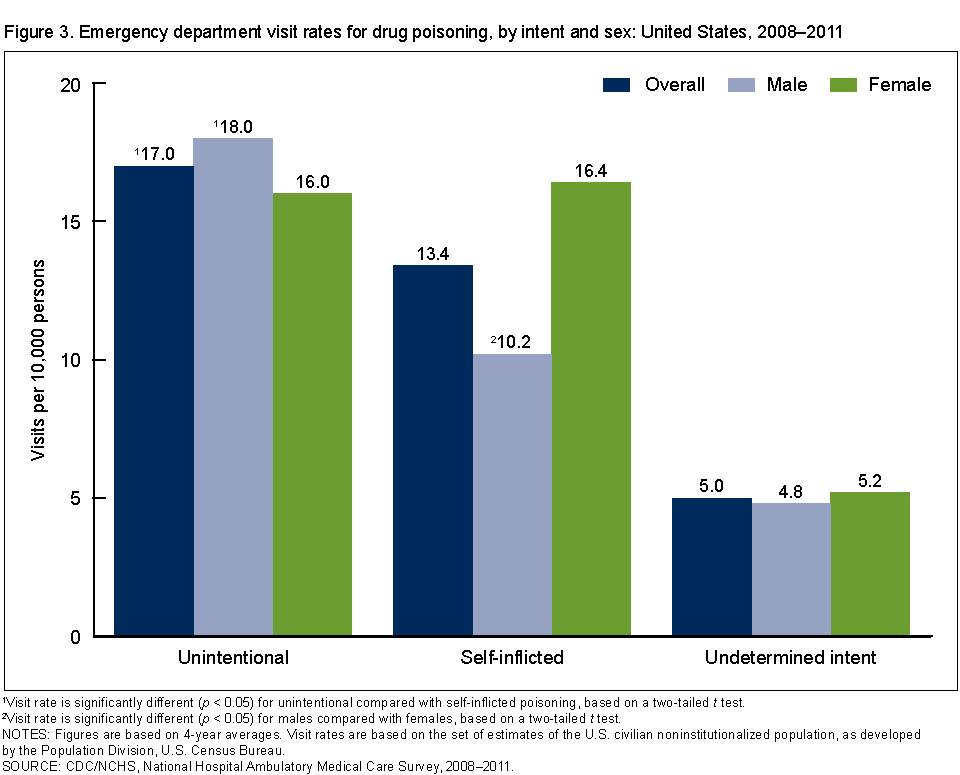
1Visit rate is significantly different (p < 0.05) for unintentional compared with self-inflicted poisoning, based on a two-tailed t test.
2Visit rate is significantly different (p < 0.05) for males compared with females, based on a two-tailed t test.
NOTES: Figures are based on 4-year averages. Visit rates are based on the set of estimates of the U.S. civilian noninstitutionalized population, as developed by the Population Division, U.S. Census Bureau.
SOURCE: CDC/NCHS, National Hospital Ambulatory Medical Care Survey, 2008–2011.
Which drugs were associated with ED visits for drug poisoning in 2008–2011?
- For both unintentional and self-inflicted drug-poisoning ED visits, about one-half of visits resulted from poisoning by drugs in the categories of analgesics, antipyretics, and antirheumatics or sedatives, hypnotics, tranquilizers, and other psychotropic agents (Figure 4).
- Analgesics that were specifically opiates or related narcotics, including heroin and methadone, accounted for 14.0% of ED visits for unintentional drug poisoning.
Figure 4. Percentage of emergency department visits for drug poisoning, by intent and drug category: United States, 2008–2011
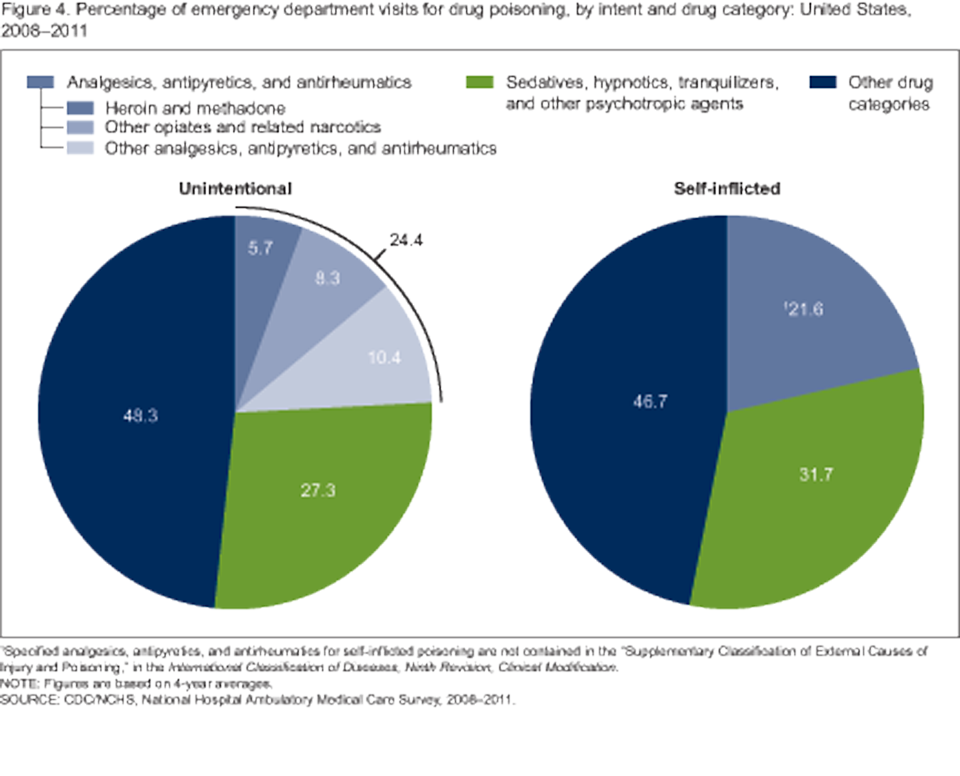
1Specified analgesics, antipyretics, and antirheumatics for self-inflicted poisoning are not contained in the “Supplementary Classification of External Causes of Injury and Poisoning,” in the International Classification of Diseases, Ninth Revision, Clinical Modification.
NOTE: Figures are based on 4-year averages.
SOURCE: CDC/NCHS, National Hospital Ambulatory Medical Care Survey, 2008–2011.
What percentage of ED visits for drug poisoning led to hospitalization? Did this differ from other ED visits in 2008–2011?
- About one-quarter (24.5%) of drug-poisoning ED visits resulted in hospital admission, which was higher compared with other ED visits (12.7%) (Figure 5).
- The percentage of ED visits for drug poisoning that resulted in hospital admission was higher than the percentage for other ED visits for all age groups except persons aged 50 and over.
- The percentage of ED visits for drug poisoning resulting in hospitalization increased with age for both ED visits for drug poisoning and other ED visits.
Figure 5. Percentage of emergency department visits admitted to the hospital, by age and cause of visit: United States, 2008–2011
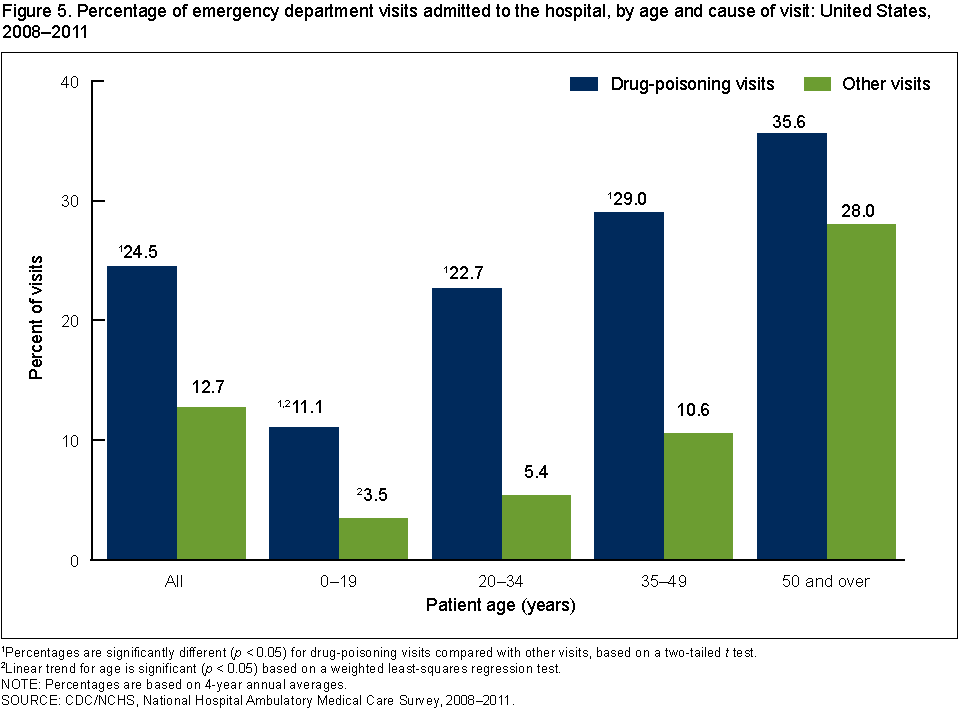
1Percentages are significantly different (p < 0.05) for drug-poisoning visits compared with other visits, based on a two-tailed t test.
2Linear trend for age is significant (p < 0.05) based on a weighted least-squares regression test.
NOTE: Percentages are based on 4-year annual averages.
SOURCE: CDC/NCHS, National Hospital Ambulatory Medical Care Survey, 2008–2011.
Summary
This analysis of National Hospital Ambulatory Medical Care Survey (NHAMCS) data indicates that in 2008–2011, an annual average of 1.1 million ED visits were made for drug poisoning, corresponding to an overall visit rate of 35.4 per 10,000 persons. The highest visit rate was observed for persons aged 20–34, and this age group showed a statistically significant increase from 2004–2007 to 2008–2011. For persons aged 35–49, the visit rate was higher for females than males. Females had a higher visit rate for self-inflicted drug poisoning than males. Drugs classified as analgesics, antipyretics, and antirheumatics; or sedatives, hypnotics, tranquilizers, and other psychotropic agents were involved in a substantial portion of drug-poisoning visits. Although visits for drug poisoning made up a small percentage of overall ED visits, they tended to be more serious, resulting in more frequent hospitalization.
Preventing increases in both poisoning deaths and nonfatal poisonings are Healthy People 2020 objectives (3). This report examining national data on ED visits for drug poisoning can help inform injury-prevention efforts to meet these objectives.
Definitions
Injury-related visit: A visit that met one of the following three conditions: a “yes” was marked in response to the question, “Is this visit related to an injury, poisoning, or adverse effect of medical treatment?”; a cause of injury or a nature of injury diagnosis was provided; or an injury-related reason for the visit was reported.
Visit for drug poisoning: An injury-related visit with a first-listed external cause-of-injury code of E850–E858, E950.0–E950.5, or E980.0–E980.5 based on the International Classification of Diseases, Ninth Revision, Clinical Modification (4). Codes for unintentional drug poisoning were: E850 analgesics, antipyretics, antirheumatics; E851–E854 sedatives, hypnotics, tranquilizers, and other psychotropic agents; and E855–E858 other and unspecified drug categories. Subcategories of unintentional drug poisoning by analgesics, antipyretics, antirheumatics were: E850.0–E850.1 heroin and methadone; E850.2 other opiates and related narcotics; and E850.3–E850.9 other and unspecified drugs. Codes for self-inflicted drug poisoning were: E950.0 analgesics, antipyretics, antirheumatics; E950.1–E950.3 sedatives, hypnotics, tranquilizers, and other psychotropic agents; and E950.4–E950.5 other and unspecified drugs. Codes for drug poisoning of undetermined intent were E980.0–E980.5. Injury visits resulting from assault by drug poisoning (E962.0) were not included in this analysis due to the small number of visits.
Data source and methods
Data are from the 2004–2011 NHAMCS, an annual nationally representative survey of nonfederal, general, and short-stay hospitals that is conducted by the Centers for Disease Control and Prevention’s (CDC) National Center for Health Statistics. NHAMCS uses a multistage probability design with samples of geographic primary sampling units (PSUs), hospitals within PSUs, and patient visits within EDs. Each year, approximately 480 hospitals are selected for inclusion in NHAMCS, and data are collected on approximately 35,000 ED visits. Additional information on the methodology of NHAMCS is available online (5).
Data were imputed for patient birth year and sex. Less than 1% of drug-poisoning visit records had missing data for either of these variables. Data analyses were performed using the statistical packages SAS version 9.3 (SAS Institute, Cary, N.C.) and SAS-callable SUDAAN version 11.0 (RTI International, Research Triangle Park, N.C.). Differences among subgroups were evaluated using a two-tailed t test. A weighted least-squares regression analysis was used to test the significance of linear trends by age in Figure 5. Comparisons reported in the text are statistically significant (p < 0.05) unless otherwise indicated.
About the authors
Michael Albert, Linda F. McCaig, and Sayeedha Uddin are with CDC’s National Center for Health Statistics, Division of Health Care Statistics.
References
- Warner M, Chen LH, Makuc DM, et al. Drug poisoning deaths in the United States, 1980–2008. NCHS data brief, no 81. Hyattsville, MD: National Center for Health Statistics. 2011.
- Chen LH, Hedegaard H, Warner M. Drug-poisoning deaths involving opioid analgesics: United States, 1999–2011. NCHS data brief, no 166. Hyattsville, MD: National Center for Health Statistics. 2014.
- HHS. Office of Disease Prevention and Health Promotion. Healthy People 2020 topics and objectives: Injury and violence prevention.
- Centers for Medicare & Medicaid Services. International classification of diseases, ninth revision, clinical modification, 6th ed. DHHS Pub No. (PHS) 06–1260. 2006.
- NCHS. 2010 NHAMCS micro-data file documentation. 2010.
Suggested citation
Albert M, McCaig LF, Uddin S. Emergency department visits for drug poisoning: United States, 2008–2011. NCHS data brief, no 196. Hyattsville, MD: National Center for Health Statistics. 2015.
Copyright information
All material appearing in this report is in the public domain and may be reproduced or copied without permission; citation as to source, however, is appreciated.
National Center for Health Statistics
Charles J. Rothwell, M.S., M.B.A., Director
Nathaniel Schenker, Ph.D., Deputy Director
Jennifer H. Madans, Ph.D., Associate Director for Science
Division of Health Care Statistics
Clarice Brown, M.S., Director