Acceptance of New Patients With Public and Private Insurance by Office-based Physicians: United States, 2013
- Key findings
- How did acceptance of new patients by office-based physicians vary by the patient’s source of payment?
- Did acceptance of new patients by office-based physicians differ by metropolitan status?
- Did acceptance of new privately insured patients by office-based physicians differ by state?
- Did acceptance of new Medicare patients by office-based physicians differ by state?
- Did acceptance of new Medicaid patients by office-based physicians differ by state?
- Summary
- Definition
- Data source and methods
- About the authors
- References
- Suggested citation
NCHS Data Brief No. 195, March 2015
PDF Version (945 KB)
Esther Hing, M.P.H.; Sandra L. Decker, Ph.D.; and Eric Jamoom, Ph.D., M.P.H., M.S.
Key findings
Data from the 2013 National Electronic Health Records Survey
- In 2013, most office-based physicians (95.3%) were accepting new patients.
- The percentage of physicians accepting new Medicaid patients (68.9%) was lower than the percentage accepting new Medicare (83.7%) or new privately insured (84.7%) patients.
- The percentage of physicians accepting new Medicaid and Medicare patients was lower for physicians within metropolitan statistical areas (MSAs) compared with physicians outside of MSAs.
- The percentage of physicians who accepted new privately insured, Medicare, and Medicaid patients each varied by state.
Physician acceptance of new Medicaid patients has shown to be lower than acceptance of new Medicare patients or new privately insured patients (1). Acceptance of new Medicaid patients also has shown to be lower in states with lower Medicaid payment rates to physicians (2). Using the 2013 National Electronic Health Records Survey (NEHRS), this report summarizes physician acceptance of new patients with Medicaid, Medicare, and private insurance. It also summarizes information on how these acceptance rates vary by select physician characteristics and by state.
Keywords: Medicaid, Medicare, National Electronic Health Records Survey
How did acceptance of new patients by office-based physicians vary by the patient’s source of payment?
- In 2013, 95.3% of physicians were accepting new patients (Figure 1).
- The percentage of physicians accepting new privately insured patients (84.7%) was greater than the percentage accepting new Medicaid patients (68.9%).
Figure 1. Office-based physicians accepting new patients, by patient source of payment: United States, 2013
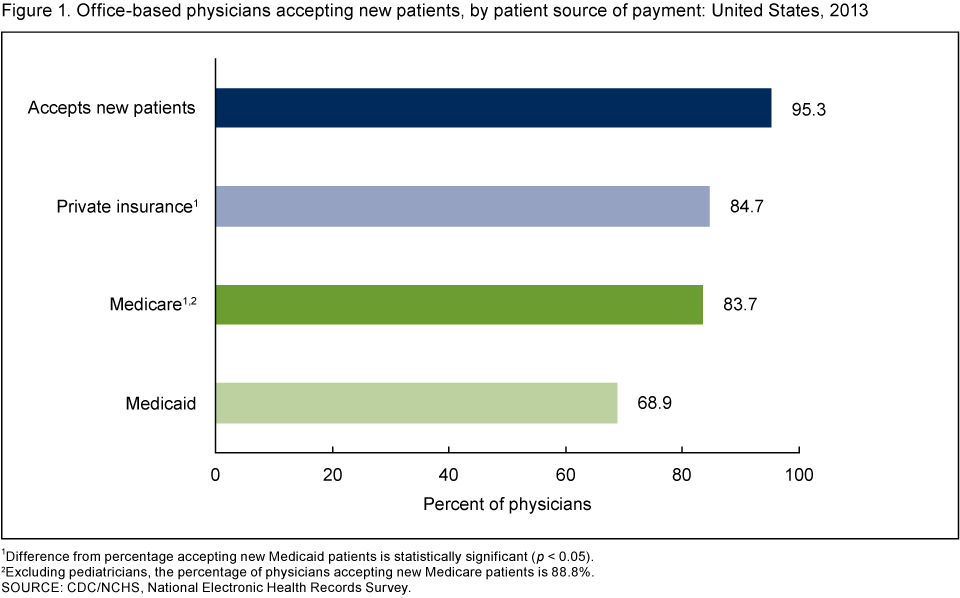
1Difference from percentage accepting new Medicaid patients is statistically significant (p < 0.05).
2Excluding pediatricians, the percentage of physicians accepting new Medicare patients is 88.8%.
SOURCE: CDC/NCHS, National Electronic Health Records Survey.
- The percentage of physicians accepting new Medicare patients (83.7%) was also greater than the percentage accepting new Medicaid patients.
Did acceptance of new patients by office-based physicians differ by metropolitan status?
- Within metropolitan statistical areas (MSAs), the percentage of physicians accepting new privately insured patients (84.6%) was greater than the percentage accepting new Medicaid patients (67.2%) (Figure 2).
- The percentage of physicians accepting new Medicare patients was higher than the percentage accepting new Medicaid patients both within and outside of MSAs.
- The percentage of physicians accepting new Medicare patients was lower within MSAs (82.9%) compared with those outside of MSAs (91.2%).
- The percentage of physicians accepting new Medicaid patients (67.2%) was also lower within MSAs compared with those outside of them (85.7%).
Figure 2. Office-based physicians accepting new patients, by patient payment source and metropolitan status: United States, 2013
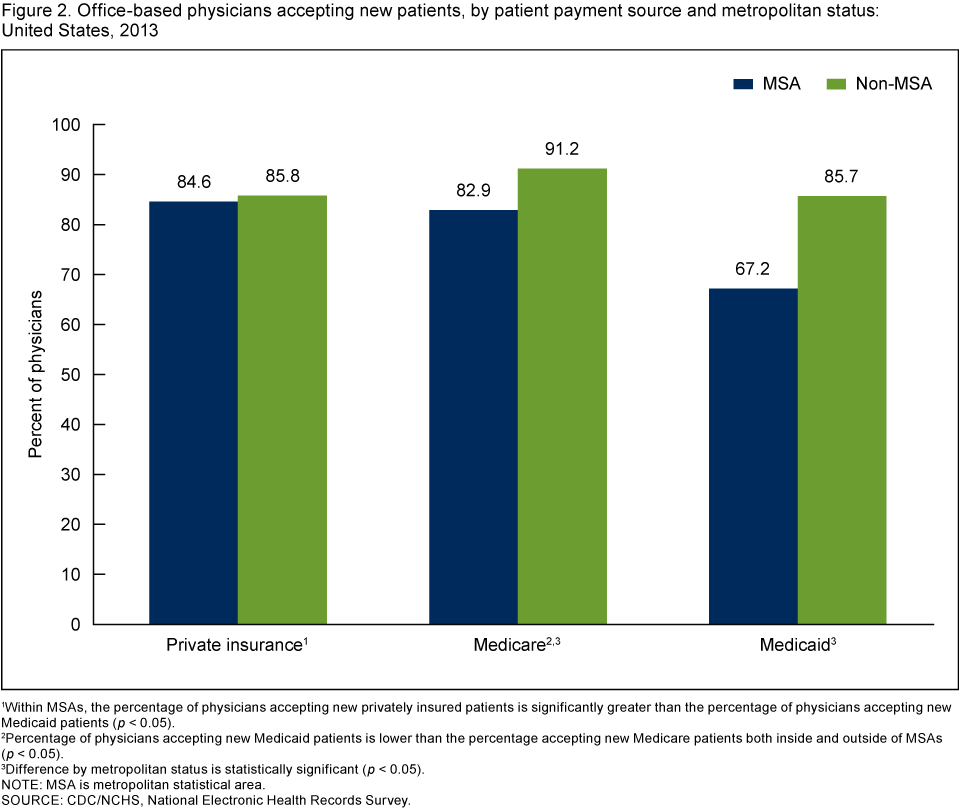
1Within MSAs, the percentage of physicians accepting new privately insured patients is significantly greater than the percentage of physicians accepting new Medicaid patients (p < 0.05).
2Percentage of physicians accepting new Medicaid patients is lower than the percentage accepting new Medicare patients both inside and outside of MSAs (p < 0.05).
3Difference by metropolitan status is statistically significant (p < 0.05).
NOTE: MSA is metropolitan statistical area.
SOURCE: CDC/NCHS, National Electronic Health Records Survey.
Did acceptance of new privately insured patients by office-based physicians differ by state?
- In 2013, the percentage of physicians who accepted new privately insured patients varied from 67.1% in the District of Columbia (DC) to 95.1% in Illinois (Figure 3).
- In 2013, the percentage of physicians who accepted new privately insured patients was significantly higher than the national average (84.7%) in eight states (Arkansas, Illinois, Minnesota, Nebraska, New Hampshire, Oklahoma, West Virginia, and Wyoming).
- In 2013, only DC had a significantly lower percentage of physicians accepting new privately insured patients (67.1%) compared with the national average.
Figure 3. Percentage of office-based physicians accepting new privately insured patients, by state: United States, 2013

SOURCE: CDC/NCHS, National Electronic Health Records Survey.
Did acceptance of new Medicare patients by office-based physicians differ by state?
- In 2013, the percentage of physicians who accepted new Medicare patients ranged from 75.5% in Hawaii to 95.2% in North Dakota (Figure 4).
- The percentage of physicians who accepted new Medicare patients was significantly higher than the national average (83.7%) in seven states (Minnesota, Nebraska, New Hampshire, North Dakota, Pennsylvania, South Dakota, and Wyoming).
- Compared with the national average, no state had a significantly lower percentage of physicians accepting new Medicare patients.
Figure 4. Percentage of office-based physicians accepting new Medicare patients, by state: United States, 2013
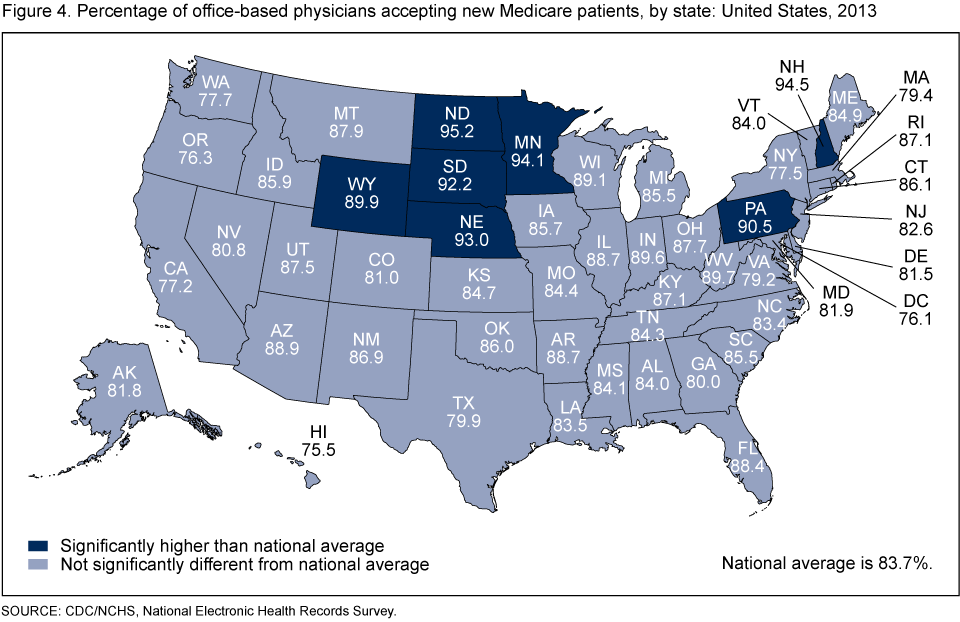
SOURCE: CDC/NCHS, National Electronic Health Records Survey.
Did acceptance of new Medicaid patients by office-based physicians differ by state?
- In 2013, the percentage of physicians who accepted new Medicaid patients ranged from 38.7% in New Jersey to 96.5% in Nebraska (Figure 5).
- The percentage of physicians who accepted new Medicaid patients was significantly lower than the national average of 68.9% in five states: California (54.2%), Florida (55.9%), Louisiana (56.8%), New Jersey (38.7%), and New York (57.1%).
- The percentage of physicians accepting new Medicaid patients was significantly higher than the national average in 25 states.
Figure 5. Percentage of office-based physicians accepting new Medicaid patients, by state: United States, 2013
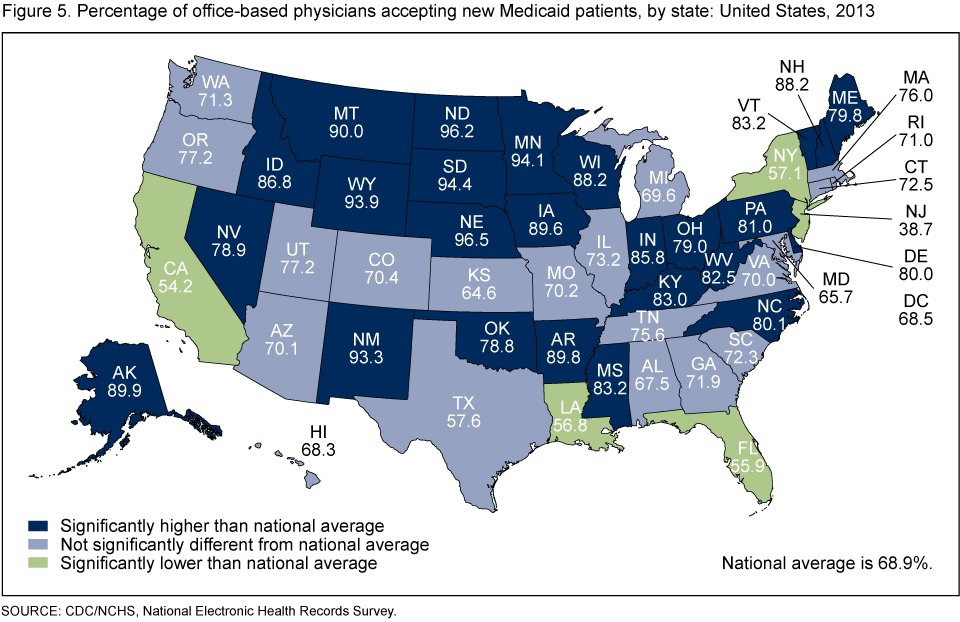
SOURCE: CDC/NCHS, National Electronic Health Records Survey.
Summary
In 2013, most office-based physicians (95.3%) accepted new patients. The percentage of physicians accepting new Medicaid patients (68.9%) was lower than the percentage accepting new Medicare patients (83.7%) or new privately insured patients (84.7%). The percentage of physicians accepting new Medicare or Medicaid patients was lower for physicians within MSAs compared with those outside of MSAs. For example, only 67.2% of physicians within MSAs accepted new Medicaid patients compared with 85.7% of physicians outside of these areas. By state, the percentage of physicians who accepted new Medicaid patients ranged from 38.7% in New Jersey to 96.5% in Nebraska.
One provision of the Affordable Care Act called for Medicaid payment rates for some primary care services provided by primary care physicians to equal Medicare rates with full federal financing in 2013 and 2014 (3). This payment change is expected to greatly increase Medicaid payment rates in some states where rates were well below Medicare rates (4). However, many states experienced delays in implementing payment increases, which meant that most states had not implemented the payment increases by the time NEHRS was fielded in early 2013 (5). Data from 2014 will be needed to determine if physician acceptance of new Medicaid patients increased.
Definition
Acceptance of new patients: Physicians in NEHRS were asked if they accepted any new patients. Those who accepted new patients were questioned about which payment sources they accepted. Those who accepted no new patients were considered not to accept privately insured patients or those with Medicare or Medicaid.
Data source and methods
Data for this report come from NEHRS, which is conducted by the Centers for Disease Control and Prevention’s National Center for Health Statistics (NCHS) as an annual, nationally representative survey of office-based physicians affiliated with the National Ambulatory Medical Care Survey. The survey is funded by the Office of the National Coordinator for Health Information Technology. The target universe consists of physicians classified as providing direct patient care in office-based practices. Radiologists, anesthesiologists, and pathologists are excluded. The survey was conducted from February 2013 through June 2013. The unweighted response rate was 70% (67% weighted). A copy of the survey is available from the NCHS website (6). The unweighted percentage of physicians not providing information on acceptance of patients with private insurance, Medicare, and Medicaid was 2.5%, 5.1%, and 6.9%, respectively. Analyses in this report were based on a responding sample of 4,220 physicians after excluding 430 physicians (9%) missing information on acceptance of new Medicaid, Medicare, or privately insured patients.
Physicians’ updated information on practice location was used to generate state-level estimates. Statements of differences in estimates are based on two-tailed t tests with significance at the p < 0.05 level. Data analyses incorporate survey weights and standard errors that accounted for the complex design of NEHRS using the statistical packages SAS version 9.2 (SAS Institute, Cary, N.C.) and SUDAAN version 10.0 (RTI International, Research Triangle Park, N.C.)
About the authors
Esther Hing is with CDC’s National Center for Health Statistics (NCHS), Division of Health Care Statistics; Sandra L. Decker is with NCHS’ Office of Analysis and Epidemiology; and Eric Jamoom is with the Division of Health Care Statistics.
References
- Decker SL. In 2011 nearly one-third of physicians said they would not accept new Medicaid patients, but rising fees may help. Health Aff (Millwood) 31(8):1673–9. 2012.
- Decker SL. Medicaid physician fees and the quality of medical care of Medicaid patients in the USA. Rev Econ Househ 5(1):95–112. 2007.
- Patient Protection and Affordable Care Act. Pub L No 111–148, 124 Stat 119, 132. 2010.
- Zuckerman S, Goin D. How much will Medicaid physician fees for primary care rise in 2013? Evidence from a 2012 survey of Medicaid physician fees [PDF – 1.12KB]. 2012.
- Kaiser Commission on Medicaid and the Uninsured. Increasing Medicaid primary care fees for certain physicians in 2013 and 2014: A primer on the health reform provision and final rule [PDF – 901.95KB]. 2012.
- NCHS. National Electronic Health Records Survey 2013 [PDF – 171.52KB]. 2013.
Suggested citation
Hing E, Decker SL, Jamoom E. Acceptance of new patients with public and private insurance by office-based physicians: United States, 2013. NCHS data brief, no 195. Hyattsville, MD: National Center for Health Statistics. 2015.
Copyright information
All material appearing in this report is in the public domain and may be reproduced or copied without permission; citation as to source, however, is appreciated.
National Center for Health Statistics
Charles J. Rothwell, M.S., M.B.A., Director
Nathaniel Schenker, Ph.D., Deputy Director
Jennifer H. Madans, Ph.D., Associate Director for Science
Division of Health Care Statistics
Clarice Brown, MS., Director
Office of Analysis and Epidemiology
Irma E. Arispe, Ph.D., Director