Characteristics of Residents Living in Residential Care Communities, by Community Bed Size: United States, 2012
- Key findings
- In 2012, residents in larger communities were older than those in smaller communities.
- A higher percentage of residents in communities with 4–25 beds were male, minority, and receiving Medicaid, compared with residents in communities with 26–50 beds and more than 50 beds.
- The prevalence of Alzheimer’s disease and other dementias was higher in communities with 4–25 beds (49%) than in communities with 26–50 beds (41%) and more than 50 beds (38%).
- The percentages of residents needing assistance with bathing, dressing, toileting, transferring in or out of a bed, and eating were highest in communities with 4–25 beds.
- About 1 in 10 residents in residential care communities had an emergency department visit or was discharged from an overnight hospital stay in the previous 90 days.
- Summary
- Definitions
- Data source and methods
- About the authors
- References
- Suggested citation
NCHS Data Brief No. 171, November 2014
PDF Version (376.26 KB)
Christine Caffrey, Ph.D.; Lauren Harris-Kojetin, Ph.D.; Vincent Rome, M.P.H.; and Manisha Sengupta, Ph.D.
Key findings
Data from the National Study of Long-Term Care Providers, 2012
- In 2012, 16% of residents living in residential care communities with 4–25 beds were under age 65 compared with 5% of residents living in communities with more than 50 beds.
- A higher percentage of residents in communities with 4–25 beds were male, minority, and receiving Medicaid, compared with residents in communities with 26–50 beds and more than 50 beds.
- The prevalence of Alzheimer’s disease and other dementias was higher in communities with 4–25 beds (49%) than in communities with 26–50 beds (41%) and more than 50 beds (38%).
- The percentages of residents needing assistance with bathing, dressing, toileting, transferring in or out of a bed, and eating were highest in communities with 4–25 beds.
Residents in residential care, including assisted living, are individuals that cannot live independently, but generally do not require the skilled level of care provided by nursing homes. On any given day in 2012, there were 713,300 residents in residential care communities (1). With the aging of the population, the numbers in residential care communities will likely increase, making them an important group within the long-term care population. Using data from the first wave of the National Study of Long-Term Care Providers (NSLTCP), this report describes characteristics of residents in residential care and compares selected characteristics by bed size. State-level estimates for the characteristics presented in this data brief are available from the NSLTCP website.
Keywords: assisted living, long-term care, National Study of Long-Term Care Providers
In 2012, residents in larger communities were older than those in smaller communities.
Figure 1. Age distribution among residential care residents, by community bed size: United States, 2012
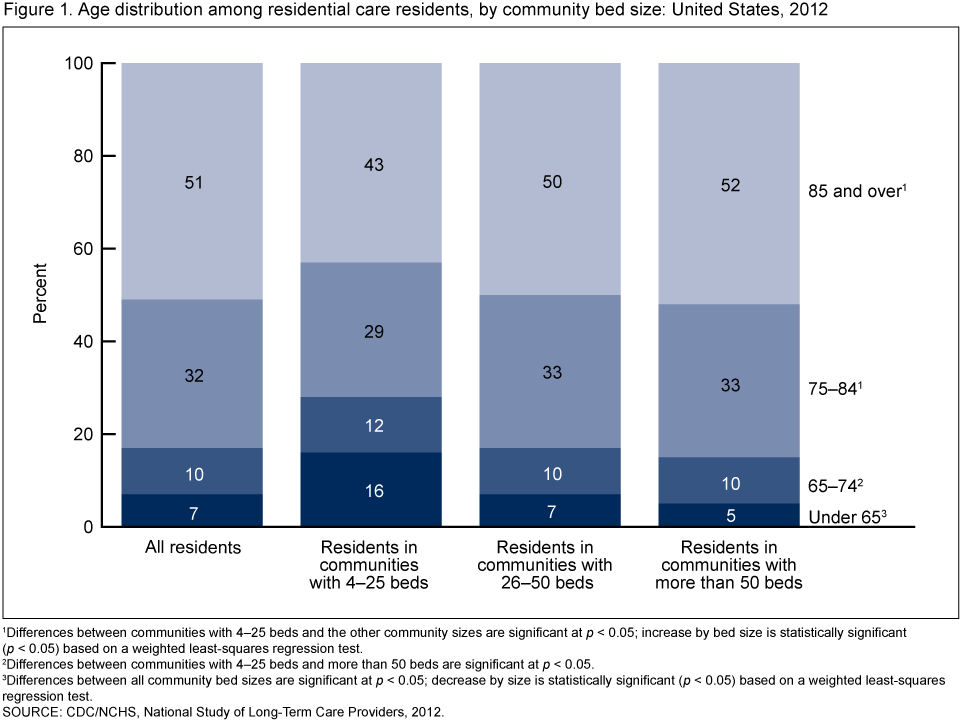
1Differences between communities with 4–25 beds and the other community sizes are significant at p < 0.05; increase by bed size is statistically significant (p < 0.05) based on a weighted least-squares regression test.
2Differences between communities with 4–25 beds and more than 50 beds are significant at p < 0.05.
3Differences between all community bed sizes are significant at p < 0.05; decrease by size is statistically significant (p < 0.05) based on a weighted least-squares regression test.
SOURCE: CDC/NCHS, National Study of Long-Term Care Providers, 2012.
- In 2012, 16% of residents living in residential care communities with 4–25 beds were under 65, compared with 5% in communities with more than 50 beds (Figure 1).
- Residents aged 85 and over made up a higher percentage in communities with 26–50 beds and more than 50 beds (50% and 52%) than they did in communities with 4–25 beds (43%).
A higher percentage of residents in communities with 4–25 beds were male, minority, and receiving Medicaid, compared with residents in communities with 26–50 beds and more than 50 beds.
- Seventy-two percent of residents in residential care communities were female. The percent female was somewhat lower in communities with 4–25 beds (68%) than in communities with 26–50 beds and more than 50 beds (73%) (Figure 2).
- Eighty-three percent of residents in communities with 4–25 beds were non-Hispanic white compared with 90% in communities with 26–50 beds and 88% in communities with more than 50 beds.
- Twenty-seven percent of residents in communities with 4–25 beds had at least some services paid for by Medicaid compared with 20% of residents in communities with 26–50 beds and 14% of residents in communities with more than 50 beds.
Figure 2. Selected characteristics among residential care residents, by community bed size: United States, 2012
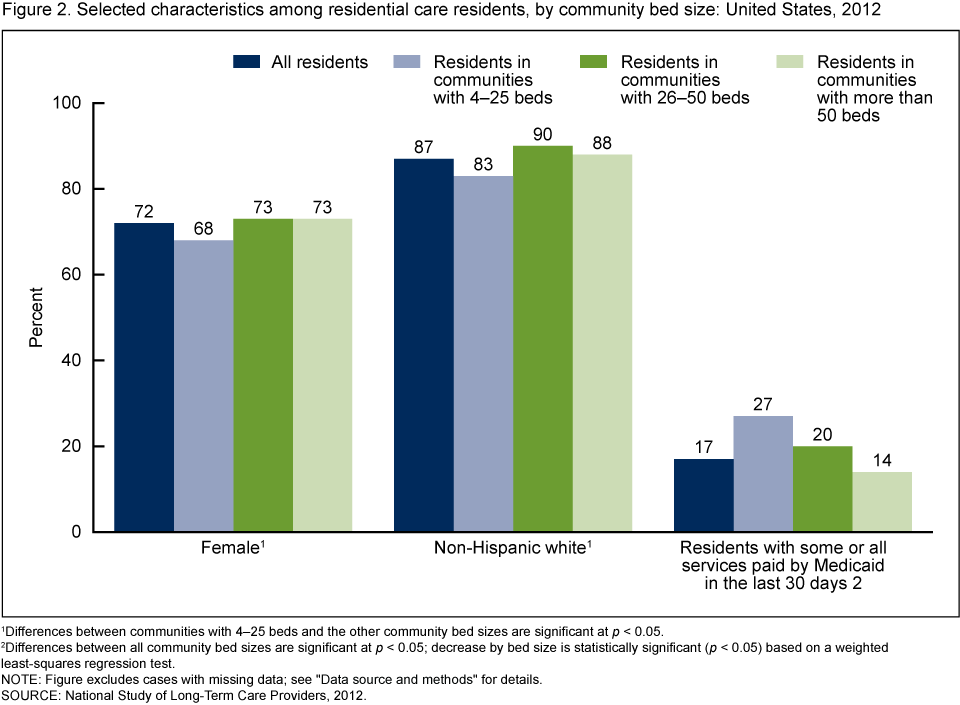
1Differences between communities with 4–25 beds and the other community bed sizes are significant at p < 0.05.
2Differences between all community bed sizes are significant at p < 0.05; decrease by bed size is statistically significant (p < 0.05) based on a weighted least-squares regression test.
NOTE: Figure excludes cases with missing data; see “Data source and methods” for details.
SOURCE: CDC/NCHS, National Study of Long-Term Care Providers, 2012.
The prevalence of Alzheimer’s disease and other dementias was higher in communities with 4–25 beds (49%) than in communities with 26–50 beds (41%) and more than 50 beds (38%).
- The highest percentage of residents with a diagnosis of Alzheimer’s disease and other dementias was among residents in residential care communities with 4–25 beds (49%) while the lowest percentage was among residents in communities with more than 50 beds (38%) (Figure 3).
- A higher percentage of residents in communities with 4–25 beds had been diagnosed with depression (31%) compared with residents in communities with 26–50 beds and more than 50 beds (24% each).
Figure 3. Selected diagnosed medical conditions among residential care residents, by community bed size: United States, 2012
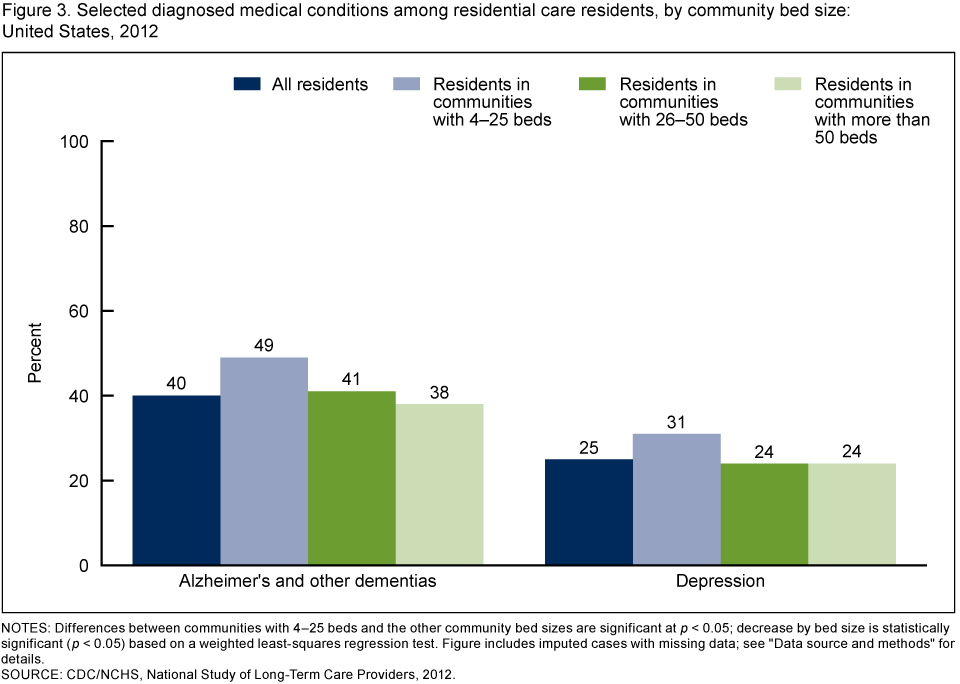
NOTES: Differences between communities with 4–25 beds and the other community bed sizes are significant at p < 0.05; decrease by bed size is statistically significant (p < 0.05) based on a weighted least-squares regression test. Figure includes imputed cases with missing data; see “Data source and methods” for details.
SOURCE: CDC/NCHS, National Study of Long-Term Care Providers, 2012.
The percentages of residents needing assistance with bathing, dressing, toileting, transferring in or out of a bed, and eating were highest in communities with 4–25 beds.
- The percentage of residents needing assistance with bathing decreased with increasing community bed size, with 78% of those in communities with 4–25 beds needing help with bathing compared with 57% of those in communities with more than 50 beds (Figure 4).
- A higher percentage of residents in communities with 4–25 beds than those in larger communities needed help with dressing, toileting, transferring in or out of a bed, and eating.
- The need for assistance with walking or locomotion did not vary significantly by community bed size.
Figure 4. Need for assistance with selected activities of daily living among residential care residents, by community bed size: United States, 2012
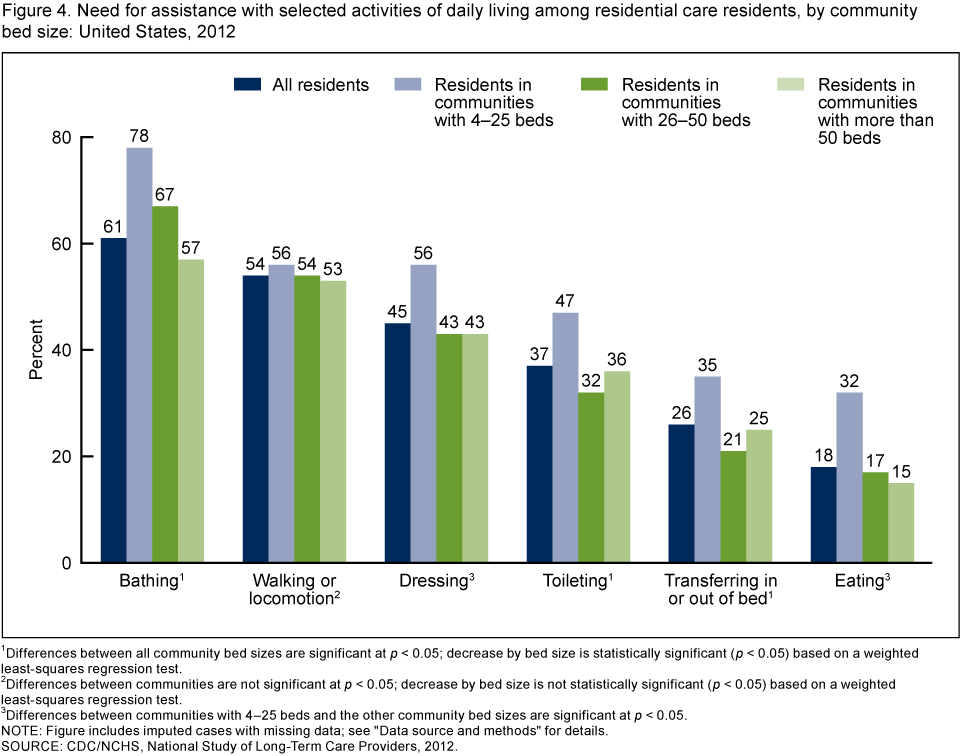
1Differences between all community bed sizes are significant at p < 0.05; decrease by bed size is statistically significant (p < 0.05) based on a weighted least-squares regression test.
2Differences between communities are not significant at p < 0.05; decrease by bed size is not statistically significant (p < 0.05) based on a weighted least-squares regression test.
3Differences between communities with 4–25 beds and the other community bed sizes are significant at p < 0.05.
NOTE: Figure includes imputed cases with missing data; see “Data source and methods” for details.
SOURCE: CDC/NCHS, National Study of Long-Term Care Providers, 2012.
About 1 in 10 residents in residential care communities had an emergency department visit or was discharged from an overnight hospital stay in the previous 90 days.
- Overall, 12% of residents in residential care communities visited the emergency department in the last 90 days, and there was little variation by community bed size (Figure 5).
- Of the 10% of residents who had a discharge from an overnight hospital stay in a 90-day period, 18% were subsequently readmitted to the hospital within 30 days of discharge.
- Discharges from overnight hospital stays and subsequent readmissions did not vary by community bed size.
Figure 5. Emergency department visits, discharges from overnight hospital stays, and hospital readmissions among residential care residents, by community bed size: United States, 2012
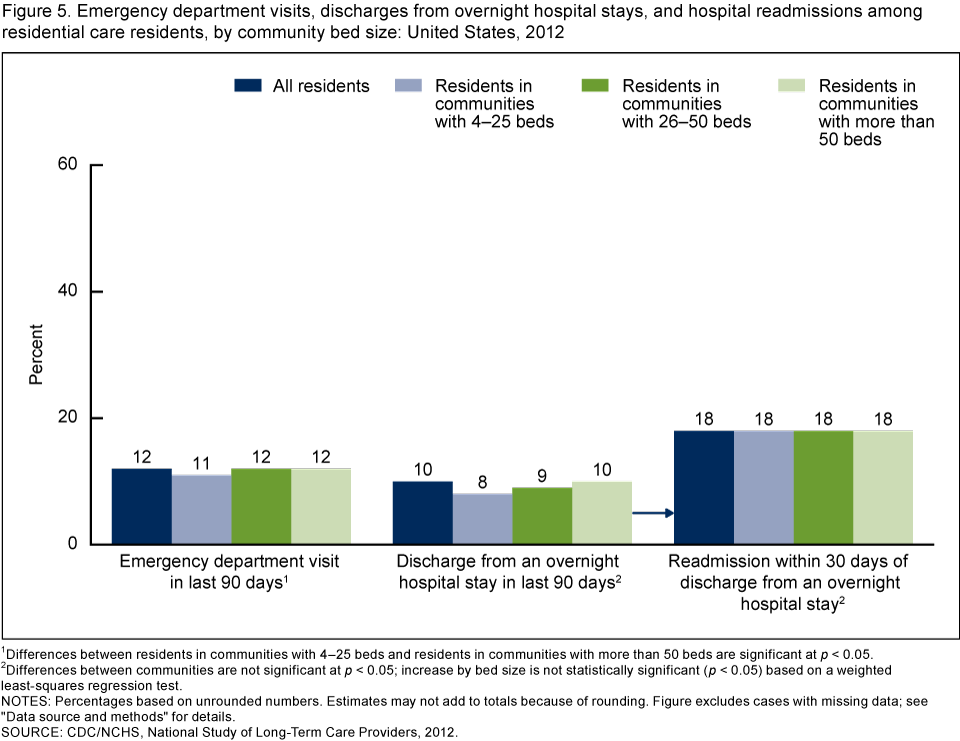
1Differences between residents in communities with 4–25 beds and residents in communities with more than 50 beds are significant at p < 0.05.
2Differences between communities are not significant at p < 0.05; increase by bed size is not statistically significant (p < 0.05) based on a weighted least-squares regression test.
NOTES: Percentages based on unrounded numbers. Estimates may not add to totals because of rounding. Figure excludes cases with missing data; see “Data source and methods” for details.
SOURCE: CDC/NCHS, National Study of Long-Term Care Providers, 2012.
Summary
In 2012, there was a higher percentage of older, female residents in communities with more than 25 beds compared with communities with 4–25 beds. Residents in communities with 4–25 beds were more racially diverse than residents in larger communities. The percentage of Medicaid beneficiaries was higher in communities with 4–25 beds than it was in communities with 26–50 and more than 50 beds. A higher percentage of residents living in communities with 4–25 beds had a diagnosis of Alzheimer’s disease or other dementias compared with residents in larger communities. Need for assistance with each of the activities of daily living (ADLs) examined (except walking or locomotion) was substantially higher among residents in communities with 4–25 beds, compared with residents in larger communities. Emergency department visits and discharges from an overnight hospital stay in a 90-day period did not vary across residents by community bed size.
This report presents national estimates of residents living in residential care, using data from the first wave of NSLTCP. This brief profile of residential care residents provides useful information to policymakers, providers, researchers, and consumer advocates as they plan to meet the needs of an aging population. The findings also highlight the diversity of residents across the different sizes of residential care communities. Corresponding state estimates and their standard errors for the national figures in this data brief can be found on the NSLTCP website. These national and state estimates establish a baseline for monitoring trends among residents living in residential care.
Definitions
Assistance with selected activities of daily living (ADLs): Refers to need for assistance with six limitations in activities of daily living (bathing, walking or locomotion, dressing, transferring in or out of a bed, toileting, and eating) that reflect a resident’s capacity for self-care. The walking or locomotion ADL includes using a cane, walker, wheelchair, or receiving help from another person.
Community bed size: Residents were grouped based on the number of licensed, registered, or certified residential care beds (both occupied and unoccupied) in their residential care community: 4–25, 26–50, and more than 50 beds.
Emergency department visits: Includes residents who were treated in a hospital emergency department in the 90 days prior to the survey.
Overnight hospital stays: Includes discharges from an overnight hospital stay in the 90 days prior to the survey. Trips to the emergency department that did not result in a discharge from an overnight hospital stay were excluded.
Readmissions after an overnight hospital stay: Refers to readmissions to the hospital for an overnight stay within 30 days of a hospital discharge. Asked about when a respondent reported at least one resident with a discharge from an overnight hospital stay in the 90 days prior to the survey.
Residential care communities: Includes assisted living and other residential care communities (e.g., personal care homes, adult care homes, board care homes, and adult foster care) that meet the study eligibility criteria; see “Data source and methods.”
Residents with some or all long-term care services paid for by Medicaid: Refers to residents who had some or all of their long-term care services paid for by Medicaid during the last 30 days.
Data source and methods
These analyses used data from the residential care community component of the 2012 NSLTCP, which is conducted by the Centers for Disease Control and Prevention’s National Center for Health Statistics (NCHS). NCHS intends to conduct NSLTCP every 2 years.
To be eligible for the study, a residential care community must have:
- Been licensed, registered, listed, certified, or otherwise regulated by the state to:
- Provide room and board with at least two meals a day and around-the-clock, onsite supervision
- Help with personal care such as bathing and dressing or health-related services such as medication management
- Had four or more licensed, certified, or registered beds
- Had at least one resident currently living in the community
- Served a predominantly adult population
Residential care communities licensed to exclusively serve individuals with severe mental illness or intellectual or developmental disabilities were excluded. Nursing homes were also excluded.
The 2012 NSLTCP used a combination of probability sampling and census-taking. Probability samples were selected in the states that had sufficient numbers of residential care communities to enable state-level, sample-based estimation. A census was taken of residential care communities in the states that did not have sufficient numbers of communities or where the number of communities needed for a sample was very close to the total number of communities. From 39,779 communities in the sampling frame, 11,690 residential care communities were sampled and stratified by state and facility bed size. Data were collected through three modes: self-administered, hard-copy questionnaires; self-administered Web questionnaires; and computer-assisted telephone interviews conducted by interviewers. The questionnaire was completed for 4,694 communities, for a weighted response rate (for differential probabilities of selection) of 55.4%. State-level response rates ranged from 40.4% in Michigan to 84.0% in Wyoming.
Aggregate data on resident demographics were collected from each participating residential care community. These data included race and ethnicity, age, sex, living arrangements, select medical conditions, need for assistance with ADLs, hospital stays, and emergency department visits. For example, respondents were asked: “Of the residents currently living in this residential care community, how many are in each of the following categories? a. Male b. Female.” The total number of residents they provided here should have been the same as the overall number of residents they had provided earlier in the survey.
Differences among subgroups were evaluated using chi-square and t tests. If chi-square tests were statistically significant, a post hoc t test procedure was used to make pairwise comparisons of different facility sizes. A weighted least-squares regression method was used to test the significance of trends. All significance tests were two-sided using p < 0.05 as the level of significance. Data analyses were performed using SAS version 9.3; SAS-callable SUDAAN version 11.0.0 statistical package (RTI International, 2012); and STATA/SE 12.1 (STATACorp LLP, 2013). Cases with missing data were excluded from the analyses on a variable-by-variable basis, ranging from 1.0% for Medicaid to 9.3% for emergency department visits. Imputed variables were used for the following resident topics: age, sex, race and ethnicity, select ADLs (bathing and eating), and select conditions (Alzheimer’s disease and other dementias and depression). Because estimates were rounded, individual estimates may not sum to totals. The estimate of the number of residential care communities and residents varied between the 2010 National Survey of Residential Care Facilities and the 2012 NSLTCP (2,3). For more details, see Chapter 5 of “Long-Term Care Services in the United States: 2013 Overview “[PDF – 3.49 MB].
About the authors
Christine Caffrey, Lauren Harris-Kojetin, Vincent Rome, and Manisha Sengupta are with CDC’s National Center for Health Statistics, Division of Health Care Statistics.
References
- Harris-Kojetin L, Sengupta M, Park-Lee E, Valverde R. Long-term care services in the United States: 2013 overview. National health care statistics reports; no 1. Hyattsville, MD: National Center for Health Statistics. 2013.
- Park-Lee E, Caffrey C, Sengupta M, Moss AJ, Rosenoff E, Harris-Kojetin LD. Residential care facilities: A key sector in the spectrum of long-term care providers in the United States. NCHS data brief, no 78. Hyattsville, MD: National Center for Health Statistics. 2011.
- Caffrey C, Sengupta M, Park-Lee E, et al. Residents living in residential care facilities: United States, 2010. NCHS data brief, no 91. Hyattsville, MD: National Center for Health Statistics. 2012.
Suggested citation
Caffrey C, Harris-Kojetin L, Rome V, Sengupta M. Characteristics of residents living in residential care communities, by community bed size: United States, 2012. NCHS data brief, no 171. Hyattsville, MD: National Center for Health Statistics. 2014.
Copyright information
All material appearing in this report is in the public domain and may be reproduced or copied without permission; citation as to source, however, is appreciated.
National Center for Health Statistics
Charles J. Rothwell, M.S., M.B.A., Director
Jennifer H. Madans, Ph.D., Associate Director for Science
Division of Health Care Statistics
Clarice Brown, M.S., Director