One-Third of U.S. Adults Embraced Most Heart Healthy Behaviors in 1999-2002
- Key findings
- How many U.S. adults engaged in each of the behaviors recommended to reduce CVD risk?
- What population subgroups were more likely to follow six or more recommendations?
- What population subgroups were more likely to follow three or fewer recommendations?
- What recommendations were least likely to be followed?
- What recommendations were most likely to be followed among persons with low compliance?
- What recommendations were least likely to be followed among those with high compliance?
- Summary
- Definitions
- Data source and methods
- About the authors
- References
- Suggested Citation
NCHS Data Brief No. 17, May 2009
PDF Version (1 MB)
Jacqueline D. Wright, Dr.P.H.; Rosemarie Hirsch, M.D., M.P.H.; and Chia-Yih Wang, Ph.D.
Key findings
- About one-third of adults complied with most-six or more out of nine-of the recommendations. Persons 60 years and older were more likely to have high compliance than those 20-59 years old.
- Persons with higher income were more likely to have high compliance than persons in the lower income categories.
- Over 90 percent of adults reported having their blood pressure checked in the last two years and only 62.6% of adults reported having their blood cholesterol checked in the past five years.
- Dietary recommendations in general and the daily fruit intake recommendation in particular were least likely to be followed, even among those with high compliance.
A number of U.S. Department of Health and Human Services programs recommend behaviors to reduce risk of cardiovascular disease (CVD), including the National High Blood Pressure Education Program (NHBPEP) and the National Cholesterol Education Program (NCEP) (1-6). The objective of this report is to estimate the prevalence of persons engaging in multiple behaviors recommended to reduce risk of CVD. Behaviors identified by NHBPEP and NCEP as primary lifestyle modifications to reduce CVD risk include physical activity, four dietary recommendations, smoking abstention, moderate alcohol consumption, and screening for high blood pressure and high blood cholesterol (5,6).
Keywords: cardiovascular disease risk, dietary intake, National Health and Nutrition Examination Survey, prevalence
How many U.S. adults engaged in each of the behaviors recommended to reduce CVD risk?
Overall, adults did very well for two recommendations (Figure 1). Over 90 percent of adults reported having their blood pressure checked in the last two years (92.3%). This figure is nearly at the goal of 95% set by the Healthy People 2010 (HP 2010) program. About four out of five adults reported moderate or no alcohol use which exceeds the HP 2010 population goal of 50%.
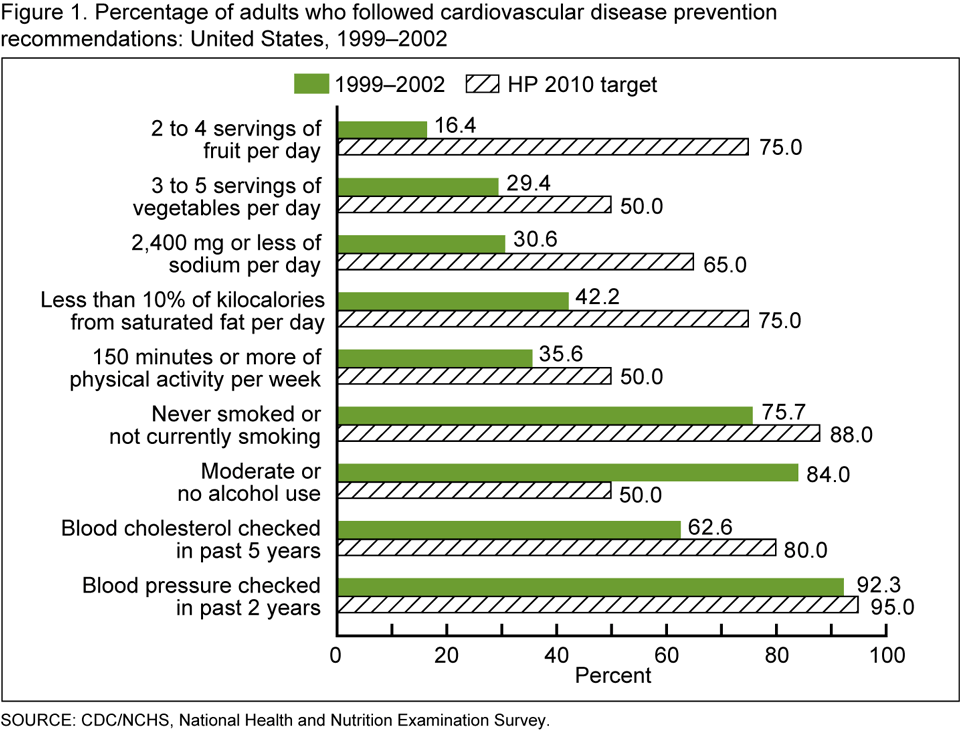
Despite three out of four adults reporting that they did not smoke cigarettes (75.7%), this result remains below the HP 2010 population goal of 88%. Nearly 65 percent of adults reported having their blood cholesterol checked in the past five years, also below the HP 2010 target of 80%.
Results were not as high for physical activity and diet. About one out of three adults engaged in recommended physical activity during leisure time. For the dietary recommendations, 42.2% of adults limited saturated fat intake, 30.6% limited sodium intake, 29.4% consumed recommended daily servings of vegetables, and only 16.4% consumed recommended daily servings of fruit.
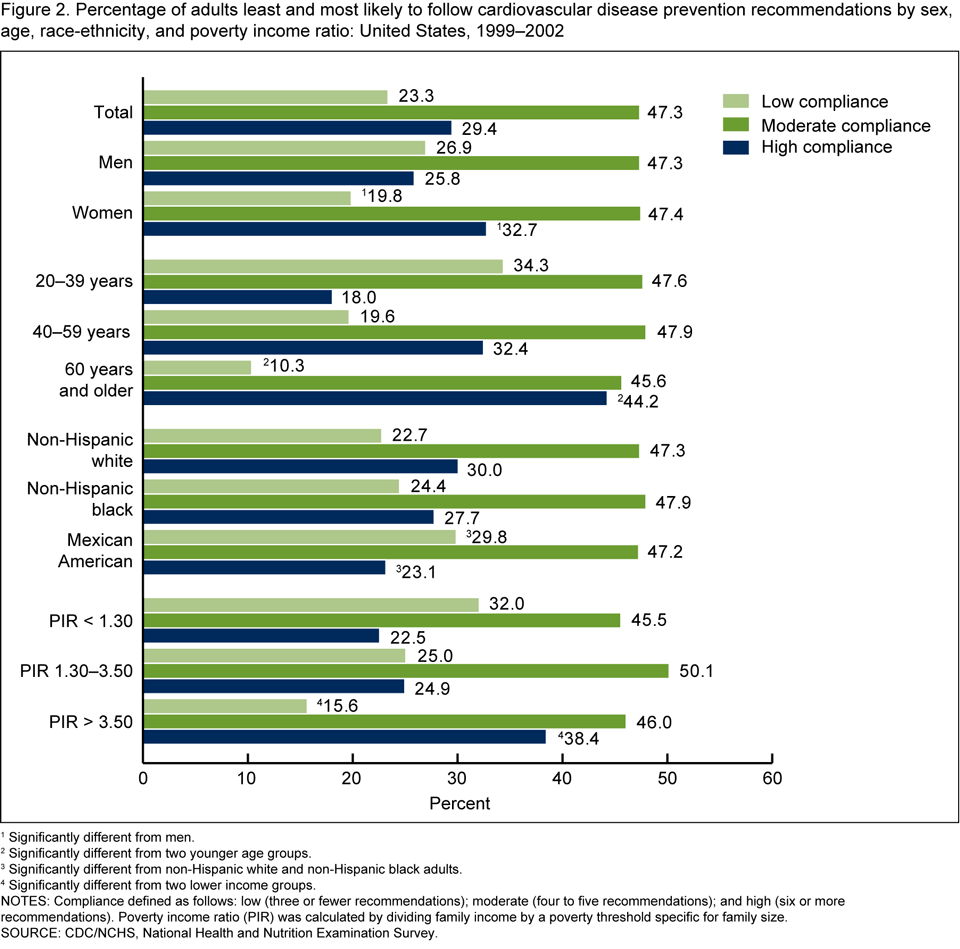
What population subgroups were more likely to follow six or more recommendations?
About 30 percent of adults followed six or more recommendations (Figure 2). One-third of women (32.7%) followed six or more recommendations compared with about one-quarter of men (25.8%). Persons 60 years and older (44.2%) were more likely than those 20-39 years old (18%) and 40-59 years old (32.4%) to have high compliance. Non-Hispanic white (30%) and non-Hispanic black adults (27.7%) were more likely to have high compliance than Mexican-American adults (23.1%). Persons in the highest income group (Poverty Income Ratio or PIR greater than 3.50) (38.4%) were more likely to follow six or more recommendations than persons in the two lower income groups (22.5% for PIR less than 1.30 and 24.9% for PIR 1.30-3.50).
What population subgroups were more likely to follow three or fewer recommendations?
About one out of five adults (23.3%) followed three or fewer recommendations. Approximately one-quarter of men (26.9%) followed three or fewer of the recommendations compared with 19.8% of women. Persons 20-39 years old (34.3%) were more likely to have low compliance than older age groups (19.6% for those 40-59 years old and 10.3% for persons 60 years and older). Mexican-American adults (29.8%) were more likely to have low compliance than non-Hispanic white (22.7%) or non-Hispanic black adults (24.4%). Persons in the lowest and middle income groups (32% for PIR less than 1.30 and 25% for PIR 1.30-3.50) were more likely to have low compliance than persons in the higher income group (15.6% for PIR greater than 3.50).
What recommendations were least likely to be followed?
The daily fruit intake recommendation was least likely to be followed (Figure 3). This was true among those with high compliance (37.4%), moderate compliance (9.4%), and low compliance (1.8%).
The recommendations on limiting saturated fat intake and engaging in physical activity were followed by a majority of those with high compliance but were less likely to be followed by persons in the moderate or low compliance groups. Of those with high compliance, 63.8% met physical activity recommendations compared with 30.1% of those with moderate compliance and 13.3% of those with low compliance; 72.7% of those with high compliance met the recommendation on limiting saturated fat intake compared with 33.5% of persons with moderate compliance and only 17% of those with low compliance.
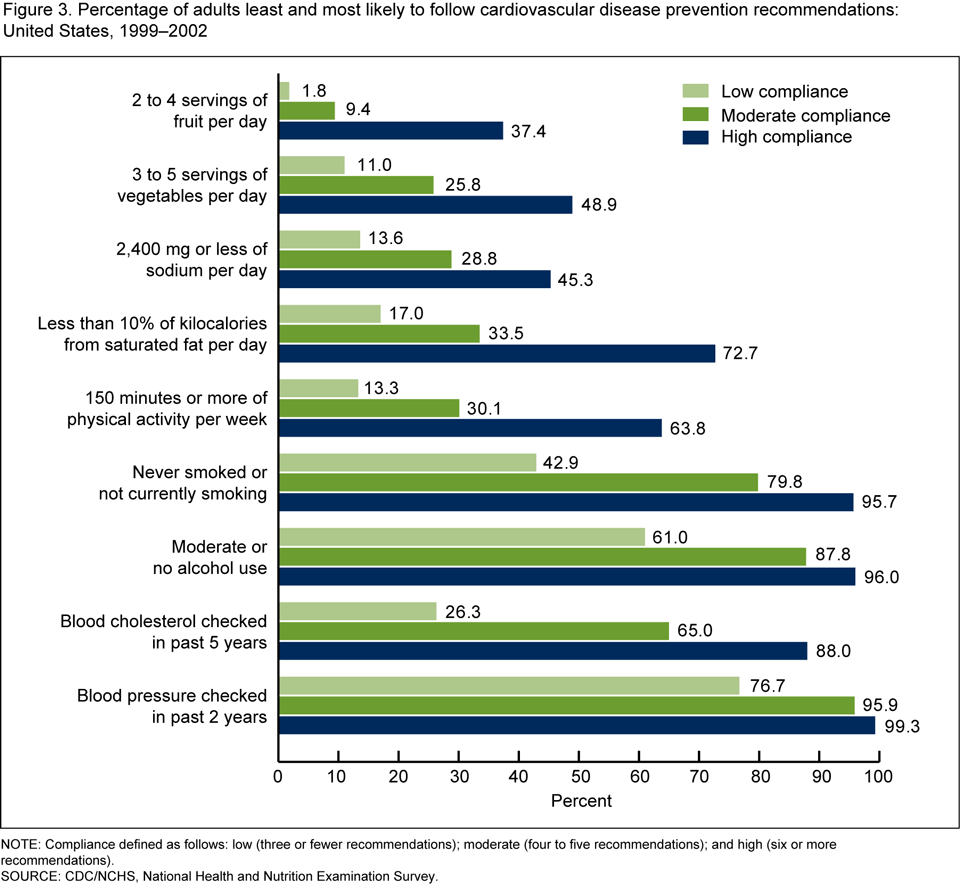
What recommendations were most likely to be followed among persons with low compliance?
The recommendations on moderate or no alcohol use (61%) and regular screening of blood pressure (76.7%) were the behaviors most likely to be followed among those with low compliance.
What recommendations were least likely to be followed among those with high compliance?
Among persons with high compliance, the recommendations on daily fruit intake (37.4%) and sodium intake (45.3%) were least likely to be followed.
Summary
The National Heart, Lung, and Blood Institute is developing guidelines that integrate scientific evidence across all CVD risk factors and these findings may be useful in that endeavor (7). Overall, the characteristics associated with high compliance in following multiple CVD prevention recommendations were female sex, age of 60 years and older, non-Hispanic white and non-Hispanic black, and a PIR of greater than 3.50. These results identify population subgroups that engage in more of the recommended behaviors to reduce CVD risk and help to define characteristics associated with success in following the recommendations.
Population subgroups engaging in fewer recommended behaviors were identified. The population subgroups that were more likely to have low compliance were those who were male, 20-39 and 40-59 years old, and Mexican American, and persons with PIR 1.30-3.50 and less than 1.30. These findings may be used to develop targeted education programs and focused research on barriers to successful CVD risk behavior modification for these population subgroups.
Finally, recommendations that were more likely to be followed among those with low and high compliance were examined. The recommendations on moderate or no alcohol use and regular screening of blood pressure were followed by the majority of the population, even among those with low compliance. In contrast, the dietary recommendations in general and the daily fruit intake recommendation in particular were least likely to be followed, even among those with high compliance. In addition, the recommendation on physical activity was followed by more than one-half of persons with high compliance but by less than one-third of persons with either moderate or low compliance. These results help identify recommendations where research may be focused to better understand barriers to successfully adopting these particular behaviors.
Definitions
High compliance: is defined as following six or more out of nine recommendations.
Moderate compliance: is defined as following four to five out of nine recommendations.
Low compliance: is defined as following three or fewer out of nine recommendations.
Data source and methods
National Health and Nutrition Examination Survey (NHANES) data were used for these analyses (8,9). The survey period 1999-2002 is the most recent period for which complete data are available for all CVD prevention recommendations presented in this report. NHANES is designed to monitor the health and nutritional status of the civilian, noninstitutionalized U.S. population. The survey consists of interviews conducted in participants’ homes and standardized physical examinations conducted in mobile examination centers.
The NHANES sample is selected through a complex, multistage design that includes selection of primary sampling units (counties), household segments within the counties, households, and persons from selected households. The sample design includes oversampling to provide more precise estimates for certain population subgroups. In the 1999-2002 survey years, the following subgroups were oversampled: African American, Mexican American, persons with low income, adolescents 12-19 years old, and adults 60 years and older. In 1999, NHANES became a continuous survey fielded on an ongoing basis. Each year of data collection is based on a representative sample covering all ages of the civilian noninstitutionalized U.S. population. Public-use data files are released in two-year cycles.
The behaviors estimated in this report were frequently recommended or primary lifestyle modifications to reduce CVD risk (1-4). The data for the daily dietary intake recommendations were from the Healthy Eating Index (HEI). HEI has scores based on components of a healthy diet including intake of five major food groups and a maximum score was assigned for intakes that met or exceeded the recommendation in the Dietary Guidelines for Americans (10). The HP 2010 program identifies over 400 objectives for monitoring the health of the U.S. population (11). The prevalence for each recommended behavior was compared to the HP 2010 target for the objectives most closely matching the recommended behaviors (Table).
| Behavior | Healthy People 2010 objective | NHANES definition |
|---|---|---|
|
Daily fruit intake |
19-5: consumed at least 2 servings of fruit |
At least 2 to 4 servings of fruit |
|
Daily vegetable intake |
19-6: consumed at least 3 servings of vegetables |
At least 3 to 5 servings of vegetables |
|
Daily sodium intake |
19-10: consumed 2,400 mg or less of sodium |
2,400 mg or less of sodium |
|
Daily saturated fat intake |
19-8: consumed less than 10% of total calories from saturated fat |
Less than 10% of total calories from saturated fat |
|
Physical activity |
22-2: moderate physical activity daily, at least 30 minutes per day |
Moderate or vigorous leisure-time physical activity for 150 minutes or more per week |
|
Smoking abstention or cessation |
27-1: did not smoke cigarettes |
Never smoked or not currently smoking |
|
Moderate or no alcohol consumption |
26-13: did not exceed the guidelines for low-risk drinking |
1 drink or less per day for women and 2 drinks or less per day for men |
|
Cholesterol screening |
12-15: blood cholesterol measured in past 5 years |
Blood cholesterol measured in past 5 years |
|
Blood pressure screening |
12-12: blood pressure measured in past 2 years and can state whether it was normal or high |
Blood pressure measured in past 2 years |
Sample weights were incorporated into the estimation process. All data analyses were performed using the statistical software SAS version 9.1 (SAS Institute, Cary, NC) and SUDAAN version 9.0 (RTI, Research Triangle Park, NC). In order to compare prevalence estimates between subgroups that differed with respect to age distribution, all estimates, except age-specific estimates, were adjusted by the direct method to the 2000 U.S. population age distribution, using the 20-year age intervals 20-39 years, 40-59 years, and 60 years and older. Statistical tests of differences between subgroups were performed using t tests at the p<0.05 level. Adjustments for multiple comparison were made using the Bonferroni method (12). All comparison findings reported are statistically significant unless otherwise indicated.
About the authors
Jacqueline D. Wright, Rosemarie Hirsch, and Chia-Yih Wang are with the Centers for Disease Control and Prevention’s National Center for Health Statistics, Division of Health and Nutrition Examination Surveys.
References
- National Heart, Lung, and Blood Institute. National Institutes of Health. National Cholesterol Education Program.
- National Heart, Lung, and Blood Institute. National Institutes of Health. National High Blood Pressure Education Program.
- U.S. Department of Health and Human Services. Physical Activity Guidelines for Americans.
- U.S. Department of Health and Human Services and U.S. Department of Agriculture. Dietary guidelines for Americans, 2005.
- Chobanian AV, Bakris GL, Black HR, et al. Seventh report of the Joint National Committee on Prevention, Detection, Evaluation, and Treatment of High Blood Pressure. Hypertension 42(6):1206-52. 2003.
- Expert Panel on Detection, Evaluation, and Treatment of High Blood Cholesterol in Adults. Executive summary of the third report of the National Cholesterol Education Program (NCEP) Expert Panel on Detection, Evaluation, and Treatment of High Blood Cholesterol in Adults (Adult Treatment Panel III). JAMA 285(19):2486-97. 2001.
- National Heart, Lung, and Blood Institute. National Institutes of Health. Cardiovascular disease risk reduction, adults cholesterol guidelines update, ATP IV hypertension guidelines update, JNC 8 obesity guidelines update, adults.
- Centers for Disease Control and Prevention. National Center for Health Statistics. NHANES 1999-2000 data file documentation.
- Centers for Disease Control and Prevention. National Center for Health Statistics. NHANES 2001-2002 data file documentation.
- U.S. Department of Agriculture. Center for Nutrition Policy and Promotion. Healthy Eating Index.
- U.S. Department of Health and Human Services. Healthy People 2010, second edition, vol I, II. Washington: Public Health Service. 2000.
- Neter J, Wasserman W, Kutner M. Applied linear statistical models, second edition. Homewood, IL: Richard D. Irwin, Inc. 1985.
Suggested Citation
Wright JD, Hirsch R, Wang C-Y. One-third of U.S. adults embraced most heart healthy behaviors in 1999-2002. NCHS data brief, no 17. Hyattsville, MD: National Center for Health Statistics. 2009.
Copyright information
All material appearing in this report is in the public domain and may be reproduced or copied without permission; citation as to source, however, is appreciated.
National Center for Health Statistics
Director
Edward J. Sondik, Ph.D.
Acting Co-Deputy Directors
Jennifer H. Madans, Ph.D
Michael H. Sadagursky