Fruit and Vegetable Consumption of U.S. Youth, 2009–2010
- Key findings
- Were there differences by age in the percentage of U.S. youth who consumed fruit on a given day in 2009–2010?
- Were there differences by age in the percentage of U.S. youth who consumed vegetables on a given day in 2009–2010?
- Were there differences by race and Hispanic origin in the percentage of U.S. youth who consumed fruit on a given day in 2009–2010?
- Were there differences by race and Hispanic origin in the percentage of U.S. youth who consumed vegetables on a given day in 2009–2010?
- Summary
- Definitions
- Data source and methods
- About the authors
- References
- Suggested citation
NCHS Data Brief No. 156, July 2014
PDF Version (512 KB)
Samara Joy Nielsen, Ph.D., M.Div., Lauren M. Rossen, Ph.D., M.S., Diane M. Harris, Ph.D., M.P.H., and Cynthia L. Ogden, Ph.D., M.R.P.
Key findings
Data from the National Health and Nutrition Examination Survey, 2009–2010
- More than three-quarters of youth aged 2–19 years (77.1%) consumed fruit on a given day.
- Almost 92% of youth aged 2–19 years consumed vegetables on a given day.
- Nine out of 10 children aged 2–5 years consumed fruit, while only 6 out of 10 adolescents consumed fruit on a given day.
- More children aged 2–5 years than adolescents consumed vegetables on a given day.
The Dietary Guidelines for Americans (DGA), 2010 encourage Americans, including youth, to increase their consumption of fruits and vegetables. Individuals are encouraged to “eat a variety of vegetables, especially dark-green and red and orange vegetables.” Fruits and vegetables are sources of many under-consumed nutrients and consuming fruits and vegetables is associated with a decreased risk of chronic disease (1–3). This report examines the percentage of youth aged 2–19 years who consumed fruits and vegetables on a given day in 2009–2010, using data from one 24-hour dietary recall interview.
Keywords: National Health and Nutrition Examination Survey
Were there differences by age in the percentage of U.S. youth who consumed fruit on a given day in 2009–2010?
More than three-quarters (77.1%) of all youth aged 2–19 years consumed any fruit on a given day; 29.7% consumed citrus, melon, and/or berries, 50.4% consumed other fruit, and 53.0% drank fruit juice (Figure 1).
Figure 1. Percentage of youth aged 2–19 years who consumed fruit on a given day: United States, 2009–2010

1Linear trend by age, p < 0.001.
NOTE: Access data table for Figure 1 [PDF – 127KB].
SOURCE: CDC/NCHS, National Health and Nutrition Examination Survey.
The percentage of youth who consumed fruit decreased with age, both for any fruit and for specific types of fruit (citrus, melon, and berries; other fruit; and fruit juice). For example, 91.7% of children aged 2–5 years, 82.0% of children aged 6–11 years, and 66.3% of adolescents aged 12–19 years consumed any fruit on a given day in 2009–2010. Similarly, about one-third of children aged 2–5 years (37.2%) and children aged 6–11 years (35.7%) consumed citrus, melon, and/or berries, while only 21.6% of adolescents aged 12–19 years consumed citrus, melon, and/or berries. About two-thirds (69.2%) of children aged 2–5 years consumed other fruit, while approximately one-half (52.9%) of children aged 6–11 years and 39.1% of adolescents aged 12–19 years consumed other fruit on a given day. Similarly, 72.1% of children aged 2–5 years, 55.1% of children aged 6–11 years, and 42.1% of adolescents aged 12–19 years consumed fruit juice.
Were there differences by age in the percentage of U.S. youth who consumed vegetables on a given day in 2009–2010?
Almost 92% of youth aged 2–19 years consumed any vegetables on a given day in 2009–2010. More than 11% consumed dark green vegetables, 75.1% consumed red and/or orange vegetables, 53.0% consumed starchy vegetables, and 60.1% consumed other vegetables (Figure 2).
Figure 2. Percentage of youth aged 2–19 years who consumed vegetables on a given day: United States, 2009–2010
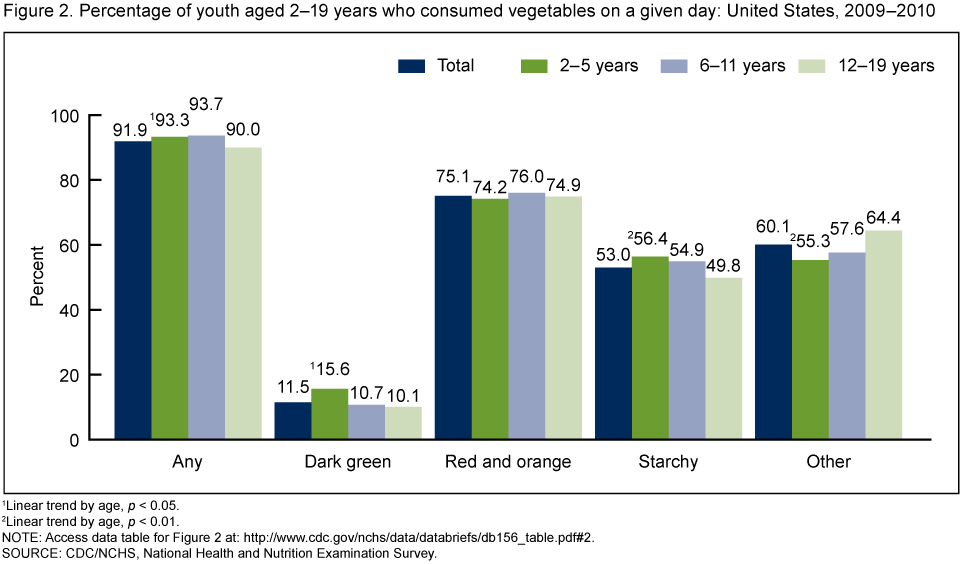
1Linear trend by age, p < 0.05.
2Linear trend by age, p < 0.01.
NOTE: Access data table for Figure 2 [PDF – 127KB].
SOURCE: CDC/NCHS, National Health and Nutrition Examination Survey.
The percentage of youth who consumed any vegetables, dark green vegetables, and starchy vegetables decreased slightly with age. For example, 93.3% of children aged 2–5 years and 93.7% of children aged 6–11 years consumed any vegetables on a given day, while 90.0% of adolescents aged 12–19 years consumed vegetables on a given day. About 16% of children aged 2–5 years, 10.7% of children aged 6–11 years, and 10.1% of adolescents aged 12–19 years consumed dark green vegetables on a given day. More than 56% of children aged 2–5 years, 54.9% of children aged 6–11 years, and about one-half (49.8%) of adolescents aged 12–19 years consumed starchy vegetables on a given day.
The percentage of youth who consumed other vegetables increased slightly with age. More than one-half (55.3%) of children aged 2–5 years, 57.6% of children aged 6–11 years, and 64.4% of adolescents aged 12–19 years consumed other vegetables on a given day.
Were there differences by race and Hispanic origin in the percentage of U.S. youth who consumed fruit on a given day in 2009–2010?
Differences existed by race and Hispanic origin in the percentage of youth who consumed fruit. On a given day, more non-Hispanic black youth (81.9%) than non-Hispanic white youth (74.8%) consumed any fruit (Figure 3). In contrast, fewer non-Hispanic black youth (20.2%) than both non-Hispanic white youth (33.1%) and Hispanic youth (26.9%) consumed citrus, melon, and/or berries. Almost one-half (46.3%) of non-Hispanic white youth consumed juice, while 68.8% of non-Hispanic black youth and 58.3% of Hispanic youth consumed juice. Approximately 50% of youth consumed other fruit, but there were no differences between race and Hispanic origin groups.
Figure 3. Percentage of youth aged 2–19 years who consumed fruit on a given day, by race and Hispanic origin: United States, 2009–2010
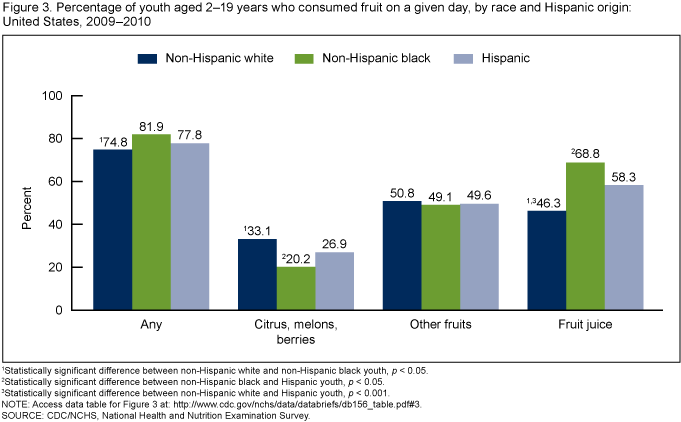
1Statistically significant difference between non-Hispanic white and non-Hispanic black youth, p < 0.05.
2Statistically significant difference between non-Hispanic black and Hispanic youth, p < 0.05.
3Statistically significant difference between non-Hispanic white and Hispanic youth, p < 0.001.
NOTE: Access data table for Figure 3 [PDF – 127KB].
SOURCE: CDC/NCHS, National Health and Nutrition Examination Survey.
Were there differences by race and Hispanic origin in the percentage of U.S. youth who consumed vegetables on a given day in 2009–2010?
No differences existed by race and Hispanic origin in the percentage of youth who consumed any vegetables. This was also true for dark green vegetables and red and orange vegetables (Figure 4). More non-Hispanic black youth (60.0%) consumed starchy vegetables compared with non-Hispanic white youth (52.1%) and Hispanic youth (49.3%). A higher proportion of Hispanic youth consumed other vegetables (66.1%) on a given day, compared to non-Hispanic white youth (59.0%) and non-Hispanic black youth (55.8%).
Figure 4. Percentage of youth aged 2–19 years who consumed vegetables on a given day, by race and Hispanic origin: United States, 2009–2010
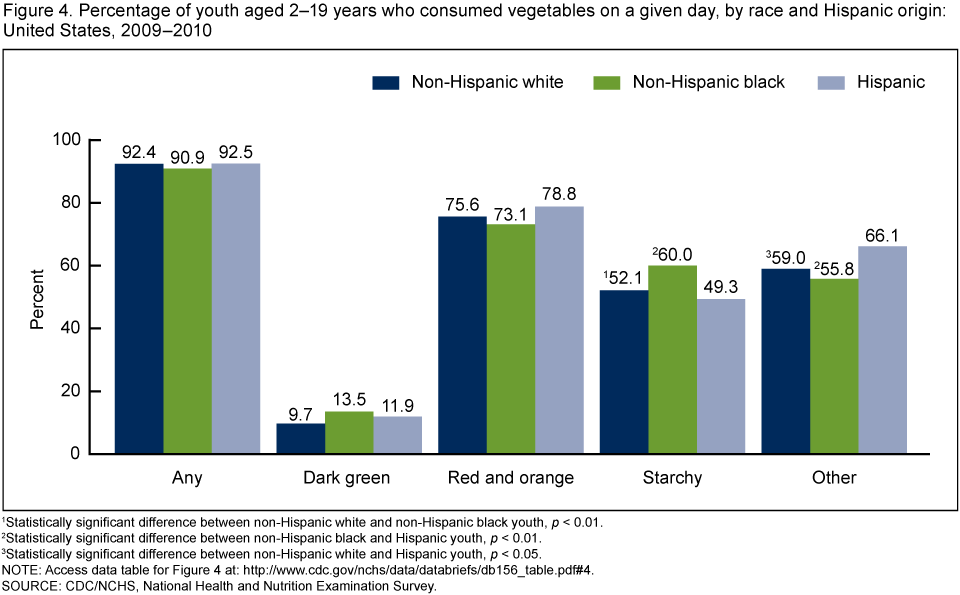
1Statistically significant difference between non-Hispanic white and non-Hispanic black youth, p < 0.01.
2Statistically significant difference between non-Hispanic black and Hispanic youth, p < 0.01.
3Statistically significant difference between non-Hispanic white and Hispanic youth, p < 0.05.
NOTE: Access data table for Figure 4 [PDF – 127KB].
SOURCE: CDC/NCHS, National Health and Nutrition Examination Survey.
Summary
On a given day during 2009–2010, more than three-quarters of youth aged 2–19 years consumed fruit, and 9 out of 10 consumed vegetables.
There were differences in consumption of fruits and vegetables by age. A greater percentage of children aged 2–5 years consumed any fruit and each category of fruit than did adolescents aged 12–19 years. Smaller differences exist in vegetable consumption by age. Slightly more children aged 2–5 years consumed dark green and starchy vegetables compared with adolescents. In contrast, more adolescents than children aged 2–5 years consumed other vegetables.
Fewer race and Hispanic origin differences existed in the percentage of youth who consumed vegetables than in the percentage who consumed fruit. More non-Hispanic black youth than non-Hispanic white youth and Hispanic youth consumed fruit juice. A smaller percentage of non-Hispanic black youth, however, consumed citrus, melon, and/or berries on a given day compared to the other race and Hispanic origin groups. The only differences in vegetable consumption were in starchy vegetable and other vegetable consumption. A greater percentage of non-Hispanic black youth compared to other race and Hispanic origin groups consumed starchy vegetables. More Hispanic youth consumed other vegetables in comparison to the other race and Hispanic origin groups.
The U.S. Department of Agriculture (USDA) food pattern, a food pattern consistent with the DGA, 2010, states that everyone, including youth, should consume at least the equivalent of 1 cup of fruit and 1 cup of vegetables daily. The total amount depends on the individual’s estimated caloric needs (1). Increasing U.S. fruit and vegetable consumption is a national public health priority (4). These results show that a high percentage of youth do consume at least some fruits and vegetables on a given day. However, about one-quarter of youth did not consume any fruit on a given day. Less than 10% of youth did not consume any vegetables on a given day.
Definitions
Food groups are from the USDA Food Patterns Equivalents Database (5). The National Health and Nutrition Examination Survey (NHANES) collects dietary intake information using 24-hour dietary recall interviews. The USDA Food Patterns Equivalents Database is a file that contains the NHANES 24-hour dietary data in a form that represents food patterns related to recommendations in the DGA (e.g., fruit, vegetables, grains, dairy, and protein) in equivalent amounts (5).
The Fruit Group consists of three components: citrus, melons, and berries; other fruits; and fruit juice (5). The citrus, melons, and berries component includes blackberries, blueberries, cranberries, currants, dewberries, huckleberries, kiwifruit, loganberries, mulberries, raspberries, and strawberries; melons, such as cantaloupe, casaba, honeydew, and watermelon; and citrus fruit, such as calamondins, grapefruits, kumquats, lemons, limes, mandarin oranges, oranges, tangerines, and tangelos (5). The other fruits component includes apples, apricots, bananas, cherries, dates, figs, grapes, guavas, lychees, mangoes, nectarines, papayas, passion fruits, peaches, pears, pineapples, plums, pomegranates, prunes, raisins, rhubarbs, and tamarinds (5). The fruit juice component includes juice of citrus, melons, berries, and other fruits (5).
The Vegetables Group consists of four components: dark green, red and orange, starchy, and other. Vegetable juices were included with the respective vegetables (5). Dark green vegetables include arugula, basil, beet greens, bitter melon leaves, broccoli, Chinese cabbage (pak choi), chrysanthemum garland, chard, cilantro, collards, cress, dandelion greens, kale, lambsquarters, lettuce (Boston, butterhead, cos, romaine, green leaf, and red leaf), mustard cabbage, mustard greens, parsley, poke greens, recaito (Puerto Rican little coriander), spinach, turnip greens, and watercress (5). Red and orange vegetables include calabazas (Spanish pumpkin), carrots, red chili peppers, red or orange bell peppers, pimentos, pumpkins, squash (most winter types), sweet potatoes, and tomatoes (5). Starchy vegetables include breadfruit, burdock, cassava (yuca blanca), corn, lima beans, immature peas (e.g., cowpeas, black-eyed peas, green peas, and pigeon peas), jicama or yambeans, plantain, poi, white potatoes, salsify, tapioca, taro, water chestnuts, and yams (5). Other vegetables include artichokes, asparagus, avocados, bamboo shoots, beans (green and string), bean sprouts, beets, bitter melons (bitter gourd and balsam pear), broccoflower, Brussels sprouts, cabbage (green, red, and savoy), cactus (nopales), cauliflower, celeriac, celery, chayote or christophine, chives, cucumber, eggplant, fennel bulb, garlic, ginger root, kohlrabi, leeks, lettuce (iceberg and others not included under dark green category), luffa (Chinese okra), mushrooms, okra, olives, onions, peppers (chili and bell types that are not red or orange in color), radicchio, sprouted beans (e.g., sprouted mung beans), radishes, rutabagas, squash (summer), snow peas, tomatillos, turnips, and winter melons (5).
Data source and methods
NHANES data for 2009–2010 were used for these analyses. NHANES is conducted by the Centers for Disease Control and Prevention’s National Center for Health Statistics to assess the health and nutritional status of the civilian noninstitutionalized U.S. population. The survey combines an in-home interview and a standardized physical examination at a mobile examination center (MEC). For this report, data were collected via an in-person 24-hour dietary recall interview in the MEC. Dietary recalls cover intake during the day (24 hours) prior to the standardized physical examination on the MEC. Proxy interviews are done up to the age of 11. Youth aged 12 and over, in most cases, respond for themselves (6).
The sample design includes oversampling to obtain reliable estimates of health and nutritional measures for population subgroups. For 2009–2010, the Hispanic and non-Hispanic black populations were oversampled (7). Data were analyzed using the day 1 dietary sample weights to account for differential probabilities of selection, nonresponse, and noncoverage. The standard errors of the percentages were estimated using Taylor series linearization, a method that incorporates the sample design.
Differences between groups were evaluated using a t statistic at the p less than 0.05 significance level. Tests for linear trends by age were set at the p less than 0.05 significance level. All differences reported are statistically significant unless otherwise indicated. Statistical analyses were conducted using SAS version 9.3 (SAS Institute, Cary, N.C.) and SUDAAN version 11.0 (RTI International, Research Triangle Park, N.C.).
About the authors
Samara Joy Nielsen and Cynthia L. Ogden are with CDC’s National Center for Health Statistics (NCHS), Division of Health and Nutrition Examination Surveys; and Lauren M. Rossen is with NCHS Office of Analysis and Epidemiology. Diane M. Harris is with CDC’s National Center for Chronic Disease Prevention and Health Promotion.
References
- U.S. Department of Agriculture, U.S. Department of Health and Human Services. Dietary guidelines for Americans, 2010. 7th ed. Washington, DC: U.S. Government Printing Office. 2010.
- Shay CM, Stamler J, Dyer AR, Brown IJ, Chan Q, Elliott P, et al. Nutrient and food intakes of middle-aged adults at low risk of cardiovascular disease: The international study of macro-/micronutrients and blood pressure (INTERMAP). Eur J Nutr 51(8):917–26. 2012.
- Bazzano LA, He J, Ogden LG, Loria CM, Vupputuri S, Myers L, Whelton PK. Fruit and vegetable intake and risk of cardiovascular disease in US adults: The first National Health and Nutrition Examination Survey Epidemiologic Follow-up Study. Am J Clin Nutr 76(1):93–9. 2002.
- Centers for Disease Control and Prevention. State indicator report on fruits and vegetables, 2013. Atlanta, GA: Centers for Disease Control and Prevention, U.S. Department of Health and Human Services. 2013.
- Bowman S, Clemens J, Thoerig R, et al. Food Patterns Equivalents Database 2009–10: Methodology and user guide. Beltsville, MD: Food Surveys Research Group, Beltsville Human Nutrition Research Center, Agricultural Research Service, U.S. Department of Agriculture. 2013.
- Centers for Disease Control and Prevention, National Center for Health Statistics. National Health and Nutrition Examination Survey MEC in-person dietary interviewers procedures manual [PDF – 10.21MB]. Hyattsville, MD: Centers for Disease Control and Prevention, U.S. Department of Health and Human Services. 2009.
- Johnson CL, Paulose-Ram R, Ogden CL, et al. National Health and Nutrition Examination Survey: Analytic guidelines, 1999–2010. National Center for Health Statistics. Vital Health Stat 2(161). 2013.
Suggested citation
Nielsen SJ, Rossen LM, Harris DM, Ogden CL. Fruit and vegetable consumption of U.S. youth, 2009–2010. NCHS data brief, no 156. Hyattsville, MD: National Center for Health Statistics. 2014.
Copyright information
All material appearing in this report is in the public domain and may be reproduced or copied without permission; citation as to source, however, is appreciated.
National Center for Health Statistics
Charles J. Rothwell, M.S., M.B.A., Director
Jennifer H. Madans, Ph.D., Associate Director for Science
Division of Health and Nutrition Examination Surveys
Kathryn S. Porter, M.D., M.S., Director