Measures of Muscular Strength in U.S. Children and Adolescents, 2012
- Key findings
- Were there differences in core muscle strength by sex and age group among children and adolescents?
- Were there differences in lower body muscle strength by sex and age group among children and adolescents?
- Were there differences in upper body muscle strength as measured by the modified pull-up by sex among children and adolescents?
- Were there differences in upper body muscle strength as measured by the grip strength test by age group among children and adolescents?
- Summary
- Definitions
- Data source and methods
- About the authors
- References
- Suggested citation
NCHS Data Brief No. 139, December 2013
PDF Version (389 KB)
R. Bethene Ervin, Ph.D.; Chia-Yih Wang, Ph.D.; Cheryl D. Fryar, M.S.P.H.; Ivey M. Miller, R.T.R.; and Cynthia L. Ogden, Ph.D., M.R.P.
Key findings
Data from the National Health and Nutrition Examination Survey, National Youth Fitness Survey
- There were no significant differences by sex in core, lower, or upper body measures of strength for younger boys and girls. In contrast, adolescent boys had higher values than adolescent girls on all measures of strength.
- Adolescent boys and girls had higher scores than younger boys and girls on the core and lower body strength measures and upper body strength as measured by the grip strength test.
- Adolescent boys completed more modified pull-ups, a measure of upper body strength, than younger boys. There was no significant difference in the number of modified pull-ups completed between adolescent and younger girls.
In 2008, the federal government released the Physical Activity Guidelines for Americans, which provide guidance on the types and amounts of physical activities that provide substantial health benefits for Americans of all ages. Regular physical activity reduces the risk of many adverse health outcomes and helps control the percentage of body fat in children and adolescents (1). This report provides the first nationally representative data on core, upper body, and lower body measures of muscle strength among U.S. children and adolescents aged 6–15 years by sex and age group.
Keywords: muscle force, strength measurements, weight status, National Health and Nutrition Examination Survey
Were there differences in core muscle strength by sex and age group among children and adolescents?
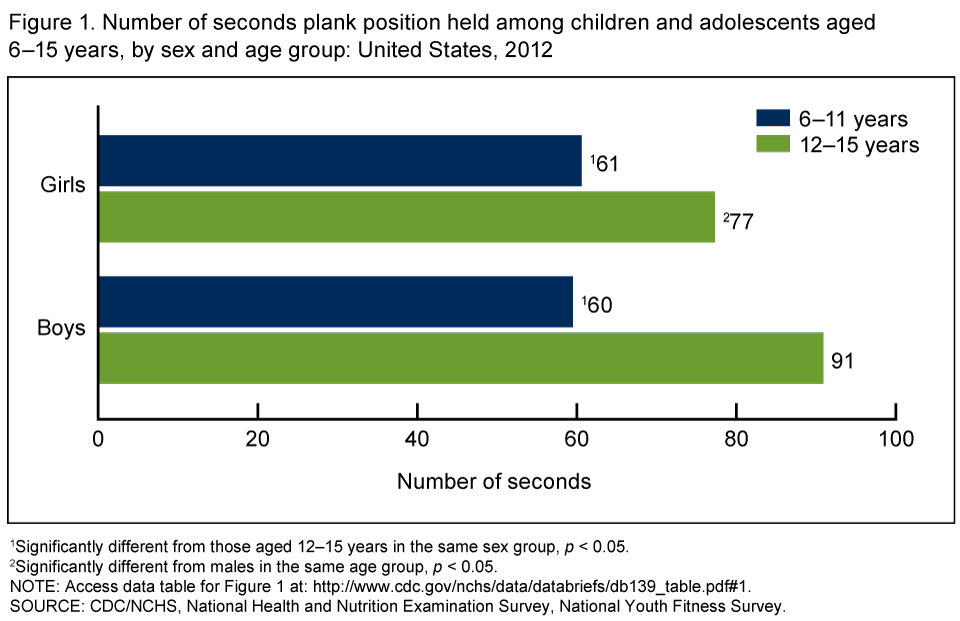
- There were no significant differences between younger girls and boys aged 6–11 years on the plank test, which is a measure of core body strength. Girls held the plank for 61 seconds and boys held it for 60 seconds (Figure 1).
Figure 1. Number of seconds plank position held among children and adolescents aged 6–15 years, by sex and age group: United States, 2012
1Significantly different from those aged 12–15 years in the same sex group, p < 0.05.
2Significantly different from males in the same age group, p < 0.05.
NOTE: Access data table for Figure 1 [PDF – 126 KB].
SOURCE: CDC/NCHS, National Health and Nutrition Examination Survey, National Youth Fitness Survey.
- There were significant differences between adolescent girls and boys aged 12–15 years on the plank test. Girls held the plank for 77 seconds, while boys held it for 91 seconds.
- Adolescent boys and girls held the plank position longer than younger boys and girls.
Were there differences in lower body muscle strength by sex and age group among children and adolescents?
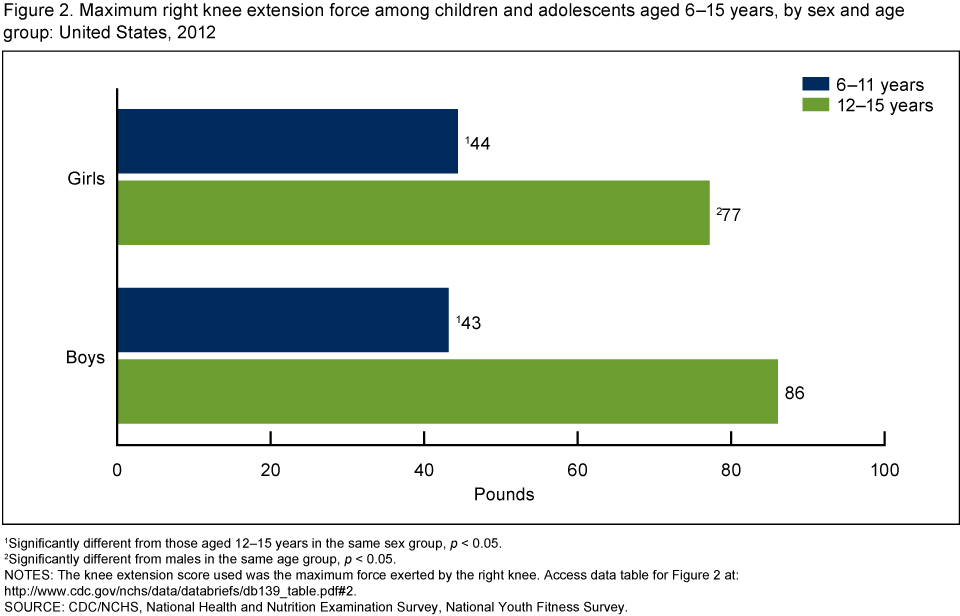
- There were no significant differences between younger girls and boys on the knee extension test, which is a measure of lower body strength. Girls exerted a maximum of 44 pounds and boys exerted 43 pounds (Figure 2).
- There were significant differences between adolescent girls and boys on the knee extension test. Girls exerted a maximum of 77 pounds, while boys exerted 86 pounds.
- Adolescent boys and girls exerted more pounds of force on the knee extension test than younger boys and girls.
Figure 2. Maximum right knee extension force among children and adolescents aged 6–15 years, by sex and age group: United States, 2012
1Significantly different from those aged 12–15 years in the same sex group, p < 0.05.
2Significantly different from males in the same age group, p < 0.05.
NOTES: The knee extension score used was the maximum force exerted by the right knee. Access data table for Figure 2 [PDF – 126 KB].
SOURCE: CDC/NCHS, National Health and Nutrition Examination Survey, National Youth Fitness Survey.
Were there differences in upper body muscle strength as measured by the modified pull-up by sex among children and adolescents?
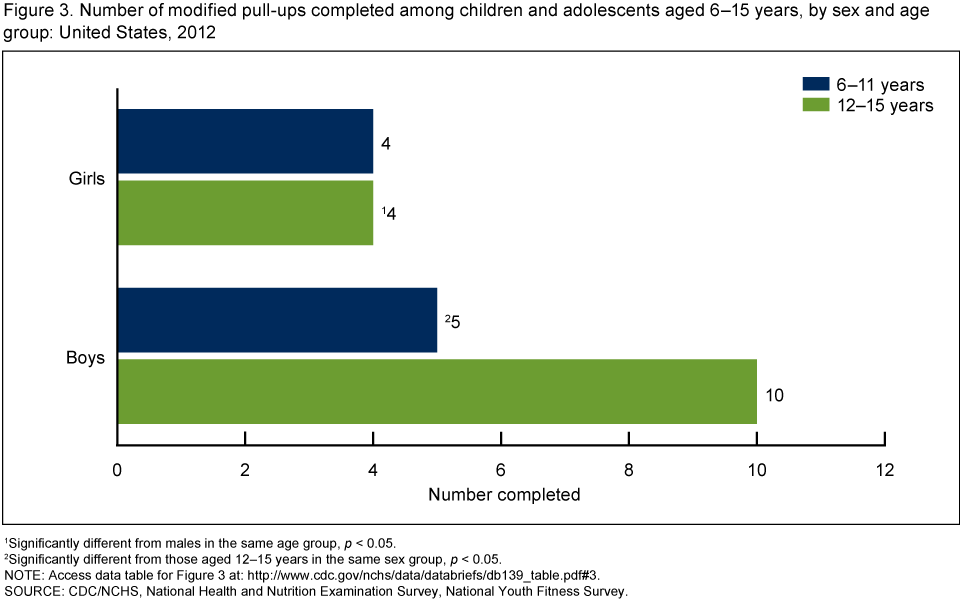
- There were no significant differences between younger girls and boys on the modified pull-up, which is a measure of upper body strength. Girls performed four modified pull-ups and boys performed five (Figure 3).
- There were significant differences between adolescent girls and boys in the number of modified pull-ups completed. Girls completed 4 modified pull-ups, while boys completed 10.
- There was no significant difference between younger and older girls in the number of modified pull-ups they could complete; however, adolescent boys completed twice as many modified pull-ups as the younger boys.
Figure 3. Number of modified pull-ups completed among children and adolescents aged 6–15 years, by sex and age group: United States, 2012
1Significantly different from males in the same age group, p < 0.05.
2Significantly different from those aged 12–15 years in the same sex group, p < 0.05.
NOTE: Access data table for Figure 3 [PDF – 126 KB].
SOURCE: CDC/NCHS, National Health and Nutrition Examination Survey, National Youth Fitness Survey.
Were there differences in upper body muscle strength as measured by the grip strength test by age group among children and adolescents?
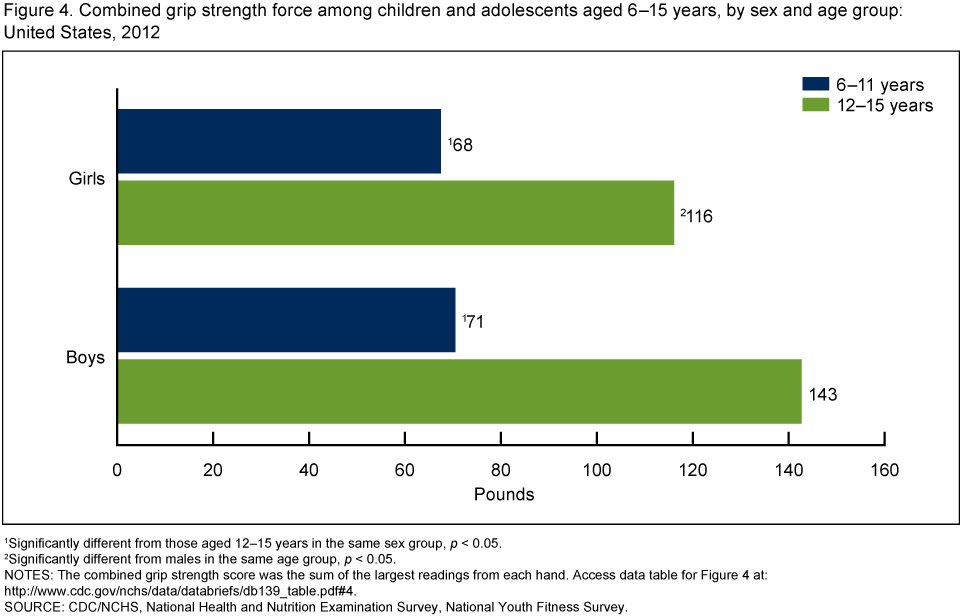
- There were no significant differences between younger girls and boys on grip strength, which is a measure of upper body strength. Girls squeezed 68 pounds and boys squeezed 71 pounds (Figure 4).
- There were significant differences between adolescent girls and boys on grip strength. Girls squeezed 116 pounds on the grip strength test, while boys squeezed 143 pounds.
- Adolescent boys and girls had higher scores on the grip strength test than younger boys and girls.
Figure 4. Combined grip strength force among children and adolescents aged 6–15 years, by sex and age group: United States, 2012
1Significantly different from those aged 12–15 years in the same sex group, p < 0.05.
2Significantly different from males in the same age group, p < 0.05.
NOTES: The combined grip strength score was the sum of the largest readings from each hand. Access data table for Figure 4 [PDF – 126 KB].
SOURCE: CDC/NCHS, National Health and Nutrition Examination Survey, National Youth Fitness Survey.
Summary
This report provides the first nationally representative estimates of strength for U.S. children aged 6–11 years and adolescents aged 12–15 years by sex and age group. The measures of muscle strength examined in this study were the plank (measures core muscles around the trunk and pelvis), modified pull-up (measures upper body strength), knee extension (measures lower body muscle strength), and grip strength (measures upper body muscle strength).
Consistent with other research (2–5), these results demonstrated that adolescent boys had more strength than adolescent girls as reflected by higher scores on all measures of strength, but there were no significant differences between the sexes for younger children. Also, adolescent boys and girls had more strength or higher scores on most of the measures of strength than younger aged boys and girls. These sex and age differences are likely the result of physical changes that occur during puberty. Researchers have attributed these changes in strength to changes in height and weight as well as an increase in muscle mass in puberty (2,4,6).
Definitions
Plank: This exercise works core muscles around the trunk and pelvis. Participants begin by lying face-down on a mat. The participant lifts his or her body off the mat, keeping his or her toes and forearms resting on the mat and his or her back straight. The objective of the exercise is to hold this position without movement for as long as possible.
Modified pull-up: This exercise measures upper body strength. Participants lie on their back with outstretched arms under a horizontal bar above their fingers. The participant grasps the bar with an overhand grip while maintaining a straight body with his or her heels on the floor. The participant raises and lowers his or her body as many times as possible so that his or her chest touches a band hanging 8 inches down from the bar.
Knee extension force: This exercise measures lower body strength. Participants are seated in a testing chair with their legs hanging over the edge of the seat. The participant’s hips, thighs, and trunk are restrained with web belts to limit use of other muscles during the test. A hand-held dynamometer (HHD) is placed on the shin just above the ankle. The participant presses his or her leg forward into the HHD as hard as possible. Each leg was tested; maximum force was recorded.
Grip strength: This exercise measures upper body strength. Grip strength was measured using a handgrip dynamometer. While standing, the participant squeezes the handle of the dynamometer as hard as possible. Each hand was tested; maximum force was recorded.
Data source and methods
Data from the National Health and Nutrition Examination Survey (NHANES), National Youth Fitness Survey (NNYFS) were used for these analyses.
NNYFS was a nationally representative survey of the resident noninstitutionalized U.S. population aged 3–15 years. NNYFS excluded all children in supervised care or custody in institutional settings and any other U.S. citizens residing outside the 50 states and the District of Columbia. It consisted of questionnaires administered in the home followed by a standardized physical examination in specially equipped mobile examination centers (MECs). The examination included physical activity and fitness tests, body measurements, and an in-person, 24-hour dietary recall interview conducted in the NNYFS MEC.
The NNYFS sample was selected using a complex, multistage, probability sampling design. The survey was conducted in conjunction with the 2012 NHANES, with the NNYFS sample selected from an independent sample of dwelling units within the segments selected for NHANES. The sample design did not include oversampling by race and ethnicity.
Sample weights, which account for the differential probabilities of selection, nonresponse, and noncoverage, were incorporated into the estimation process. The standard errors of the percentages were estimated using Taylor series linearization, a method that incorporates the sample weights and sample design.
Differences between groups were evaluated using a t statistic at the p < 0.05 significance level. Test for trends by weight status were evaluated using linear regression, and the significance level was set at p < 0.05. All differences reported are statistically significant unless otherwise indicated. Statistical analyses were conducted using the SAS System for Windows (release 9.3; SAS Institute Inc., Cary, N.C.) and SUDAAN (release 11.0; RTI International, Research Triangle Park, N.C.).
About the authors
R. Bethene Ervin, Chia-Yih Wang, Cheryl D. Fryar, Ivey M. Miller, and Cynthia L. Ogden are with the Centers for Disease Control and Prevention’s National Center for Health Statistics, Division of Health and Nutrition Examination Surveys.
References
- U.S. Department of Health and Human Services. 2008 Physical activity guidelines for Americans. 2008.
- Macfarlane TS, Larson CA, Stiller C. Lower extremity muscle strength in 6- to 8-year-old children using hand-held dynamometry. Pediatr Phys Ther 20(2):128–36. 2008.
- Beenakker EAC, van der Hoeven JH, Fock JM, Maurits NM. Reference values of maximum isometric muscle force obtained in 270 children aged 4–16 years by hand-held dynamometry. Neuromuscul Disord 11(5):441–6. 2001.
- Bäckman E, Odenrick P, Henriksson KG, Ledin T. Isometric muscle force and anthropometric values in normal children aged between 3.5 and 15 years. Scand J Rehabil Med 21(2):105–14. 1989.
- Eek MN, Kroksmark A-K, Beckung E. Isometric muscle torque in children 5 to 15 years of age: Normative data. Arch Phys Med Rehabil 87(8):1091–9. 2006.
- Lundgren SS, Nilsson JÅ, Ringsberg KAM, Karlsson MK. Normative data for tests of neuromuscular performance and DXA-derived lean body mass and fat mass in pre-pubertal children. Acta Pædiatr 100(10):1359–67. 2011.
Suggested citation
Ervin RB, Wang C-Y, Fryar CD, et al. Measures of muscular strength in U.S. children and adolescents, 2012. NCHS data brief, no 139. Hyattsville, MD: National Center for Health Statistics. 2013.
Copyright information
All material appearing in this report is in the public domain and may be reproduced or copied without permission; citation as to source, however, is appreciated.
National Center for Health Statistics
Charles J. Rothwell, M.S., Acting Director
Jennifer H. Madans, Ph.D., Associate Director for Science
Division of Health and Nutrition Examination Surveys
Kathryn S. Porter, M.D., M.S., Director