Prevalence of Obesity Among Adults: United States, 2011–2012
- Key findings
- What was the prevalence of obesity among adults in 2011–2012?
- Were differences seen in the prevalence of obesity among adults by race and Hispanic origin in 2011–2012?
- How many adults were obese in 2011–2012?
- Did the prevalence of obesity change between 2009–2010 and 2011–2012?
- Summary
- Definition
- Data source and methods
- About the authors
- References
- Suggested citation
NCHS Data Brief No. 131, October 2013
PDF Version (765 KB)
Cynthia L. Ogden, Ph.D.; Margaret D. Carroll, M.S.P.H.; Brian K. Kit, M.D., M.P.H.; Katherine M. Flegal, Ph.D.
Key findings
Data from the National Health and Nutrition Examination Survey, 2011–2012
- More than one-third (34.9%) of adults were obese in 2011–2012.
- In 2011–2012, the prevalence of obesity was higher among middle-aged adults (39.5%) than among younger (30.3%) or older (35.4%) adults.
- The overall prevalence of obesity did not differ between men and women in 2011–2012. Among non-Hispanic black adults, however, 56.6% of women were obese compared with 37.1% of men.
- In 2011–2012, the prevalence of obesity was higher among non-Hispanic black (47.8%), Hispanic (42.5%), and non-Hispanic white (32.6%) adults than among non-Hispanic Asian adults (10.8%).
- The prevalence of obesity among adults did not change between 2009–2010 and 2011–2012.
The health risks associated with obesity (1) make reducing the high prevalence of obesity a public health priority (2). Previous publications have shown both racial and ethnic disparities in obesity prevalence and no change in the prevalence of obesity among adults since 2003–2004 (3,4). National obesity prevalence estimates for non-Hispanic Asian persons are possible for the first time, using newly available data. This report presents national estimates of obesity among adults in the United States in 2011–2012, based on measured weight and height.
Keywords: obese adults, National Health and Nutrition Examination Survey
What was the prevalence of obesity among adults in 2011–2012?
More than one-third (age-adjusted 34.9%, crude 35.1%) of U.S. adults were obese in 2011–2012. Overall, the prevalence of obesity among middle-aged adults aged 40–59 was higher than among younger adults aged 20–39 or older adults aged 60 and over (Figure 1).
Men aged 40–59 had a higher prevalence of obesity (39.4%) than did men aged 20–39 (29.0%) and men aged 60 and over (32.0%). However, there was no difference in the prevalence of obesity between men aged 20–39 and those aged 60 and over. Among women, the prevalence of obesity did not differ between those aged 40–59 and 60 and over (39.5% compared with 38.1%). The prevalence of obesity among younger women was lower than among either middle-aged or older women.
Figure 1. Age-adjusted prevalence of obesity, by sex and age group, among adults aged 20 and over: United States, 2011–2012
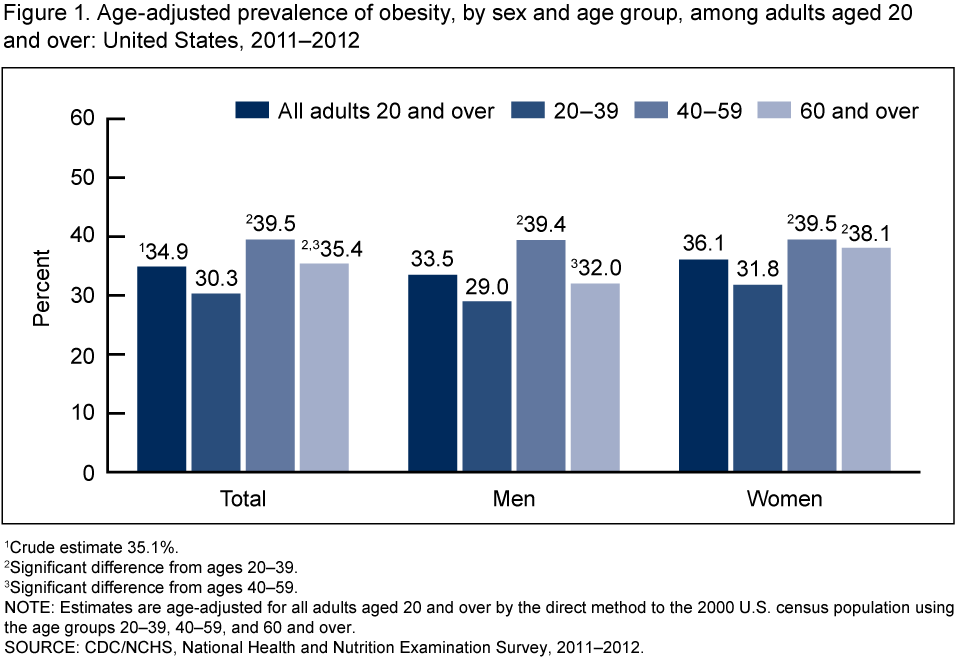
1Crude estimate 35.1%.
2Significant difference from ages 20–39.
3Significant difference from ages 40–59.
NOTE: Estimates are age-adjusted for all adults aged 20 and over by the direct method to the 2000 U.S. census population using the age groups 20–39, 40–59, and 60 and over.
SOURCE: CDC/NCHS, National Health and Nutrition Examination Survey, 2011–2012.
Were differences seen in the prevalence of obesity among adults by race and Hispanic origin in 2011–2012?
The prevalence of obesity among non-Hispanic Asian adults (10.8%) was lower than among non-Hispanic white (32.6%), Hispanic (42.5%), and non-Hispanic black (47.8%) adults (Figure 2). The prevalence of obesity among Hispanic men (40.1%) was higher than among non-Hispanic Asian (10.0%) and non-Hispanic white (32.4%) men. The prevalence of obesity was higher among non-Hispanic black women (56.6%) than among Hispanic (44.4%), non-Hispanic white (32.8%), and non-Hispanic Asian (11.4%) women.
The only difference by sex was found among non-Hispanic black adults: 56.6% of non-Hispanic black women were obese compared with 37.1% of non-Hispanic black men.
Figure 2. Age-adjusted prevalence of obesity, by sex and race and Hispanic origin, among adults aged 20 and over: United States, 2011–2012
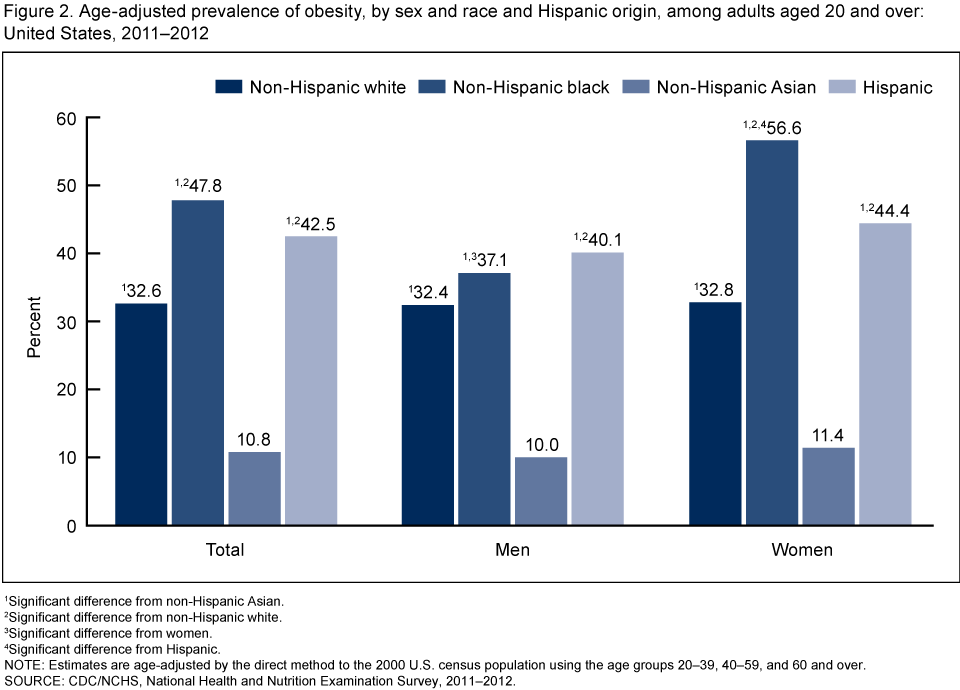
1Significant difference from non-Hispanic Asian.
2Significant difference from non-Hispanic white.
3Significant difference from women.
4Significant difference from Hispanic.
NOTE: Estimates are age-adjusted by the direct method to the 2000 U.S. census population using the age groups 20–39, 40–59, and 60 and over.
SOURCE: CDC/NCHS, National Health and Nutrition Examination Survey, 2011–2012.
How many adults were obese in 2011–2012?
As in 2009–2010 (3), more than 78 million adults were obese in 2011–2012. The majority of these obese adults (more than 50 million) were non-Hispanic white (Figure 3).
Figure 3. Number of obese adults aged 20 and over, by race and Hispanic origin: United States, 2011–2012
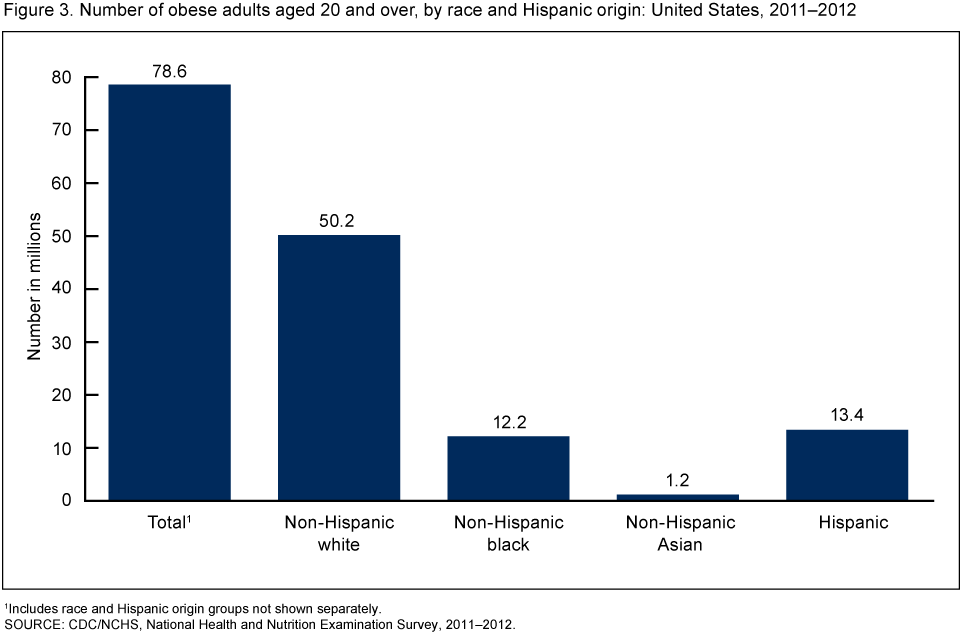
1Includes race and Hispanic origin groups not shown separately.
SOURCE: CDC/NCHS, National Health and Nutrition Examination Survey, 2011–2012.
Did the prevalence of obesity change between 2009–2010 and 2011–2012?
There was no significant change in obesity prevalence between 2009–2010 and 2011–2012 among either men or women. In 2011–2012, the prevalence of obesity among men was 33.5%, compared with 35.5% in 2009–2010. Among women, obesity prevalence was 36.1% in 2011–2012 and 35.8% in 2009–2010 (Figure 4).
Figure 4. Age-adjusted prevalence of obesity, by sex, among adults aged 20 and over: United States, 2009–2010 and 2011–2012
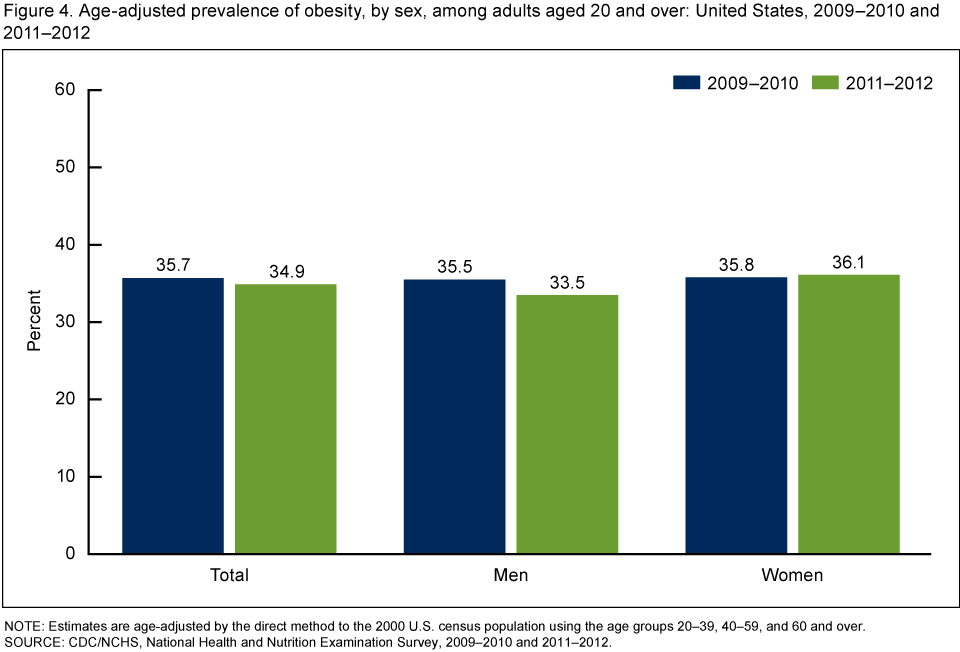
NOTE: Estimates are age-adjusted by the direct method to the 2000 U.S. census population using the age groups 20–39, 40–59, and 60 and over.
SOURCE: CDC/NCHS, National Health and Nutrition Examination Survey, 2009–2010 and 2011–2012.
Summary
The most recent national data from 2011–2012 on obesity prevalence among U.S. adults show that there was no significant change since 2009–2010. The prevalence of obesity among adults continues to be greater than one-third of the population.
As in 2009–2010, there was no difference in the prevalence of obesity between men and women (3). But unlike in 2009–2010, the prevalence of obesity among the oldest adults aged 60 and over was lower, not higher, than among middle-aged adults.
Disparities in obesity prevalence continue to exist. Newly available data show a lower prevalence of obesity among non-Hispanic Asian adults than among non-Hispanic white, non-Hispanic black, and Hispanic adults. At a given body mass index (BMI) level, body fat may vary by age, sex, and racial and ethnic group (5–7). In particular, at a given BMI, Asian adults may have more body fat than white adults (7). Morbidity and mortality risk may be influenced by factors—such as body composition and fat distribution—that are not completely captured by BMI (8).
Disparities in obesity prevalence show the highest prevalence among non-Hispanic black and Hispanic adults. Nonetheless, the burden of obesity in terms of number of obese adults shows that the majority of obese adults are non-Hispanic white. Overall, the prevalence of obesity among U.S. adults remains above the Healthy People 2020 goal of 30.5% (9).
Definition
Obesity: BMI is calculated as weight in kilograms divided by height in meters squared, rounded to one decimal place. Obesity in adults is defined as BMI greater than or equal to 30 (1). Examples of adult obesity cut points at specific heights are shown in the Table.
| Height | Obesity weight range |
|---|---|
| 5 feet 4 inches, or 1.63 meters | 174 pounds or more, or 79 kilograms or more |
| 5 feet 9 inches, or 1.75 meters | 203 pounds or more, or 92 kilograms or more |
Data source and methods
Data from the National Health and Nutrition Examination Surveys (NHANES) 2011–2012 and 2009–2010 were used for these analyses. NHANES is a cross-sectional survey designed to monitor the health and nutritional status of the civilian noninstitutionalized U.S. population (10). It is conducted by the Centers for Disease Control and Prevention’s (CDC) National Center for Health Statistics (NCHS). The survey consists of interviews conducted in participants’ homes and standardized physical examinations conducted in mobile examination centers.
The NHANES sample is selected through a complex, multistage probability design. In 2011–2012, non-Hispanic black, non-Hispanic Asian, and Hispanic persons, among other groups, were oversampled in order to obtain reliable estimates for these population subgroups. Race- and Hispanic origin-specific estimates reflect individuals reporting only one race; those reporting more than one race are included in the total but not reported separately.
Sample weights, which account for the differential probabilities of selection, nonresponse, and noncoverage, were incorporated into the estimation process. All variance estimates accounted for the complex survey design by using Taylor series linearization. Pregnant women were excluded from analyses.
Estimates of the number of obese adults were calculated using the alternative population control totals for 2011–2012, based on the American Community Survey (11) and on crude, rather than age-adjusted, obesity prevalence estimates.
Prevalence estimates for the total adult population were age-adjusted using the direct method to the 2000 U.S. census population using the age groups 20–39, 40–59, and 60 and over. Differences between groups were tested using a univariate t statistic at the
p < 0.05 significance level. All differences reported are statistically significant unless otherwise indicated. Adjustments were not made for multiple comparisons. Statistical analyses were conducted using the SAS system for Windows, release 9.3 (SAS Institute Inc., Cary, N.C.) and SUDAAN, release 11.1 (RTI International, Research Triangle Park, N.C.).
About the authors
Cynthia Ogden, Margaret Carroll, and Brian Kit are with CDC’s National Center for Health Statistics, Division of Health and Nutrition Examination Surveys. Katherine Flegal is with NCHS’ Office of the Director.
References
- Clinical guidelines on the identification, evaluation, and treatment of overweight and obesity in adults—The evidence report. National Institutes of Health. Obes Res 6(Suppl 2):51S–209S. 1998.
- HHS. The surgeon general’s vision for a healthy and fit nation. Rockville, MD: HHS, Office of the Surgeon General. 2010.
- Ogden CL, Carroll MD, Kit BK, Flegal KM. Prevalence of obesity in the United States, 2009–2010. NCHS data brief, no 82. Hyattsville, MD: National Center for Health Statistics. 2012.
- Flegal KM, Carroll MD, Kit BK, Ogden CL. Prevalence of obesity and trends in the distribution of body mass index among US adults, 1999–2010. JAMA 307(5):491–7. 2012.
- Flegal KM, Ogden CL, Yanovski JA, Freedman DS, Shepherd JA, Graubard BI, Borrud LG. High adiposity and high body mass index-for-age in US children and adolescents overall and by race-ethnic group. Am J Clin Nutr 91(4):1020–6. 2010.
- Flegal KM, Shepherd JA, Looker AC, Graubard BI, Borrud LG, Ogden CL, et al. Comparisons of percentage body fat, body mass index, waist circumference, and waist-stature ratio in adults. Am J Clin Nutr 89(2):500–8. 2009.
- Deurenberg P, Deurenberg-Yap M, Guricci S. Asians are different from Caucasians and from each other in their body mass index/body fat per cent relationship. Obes Rev 3(3):141–6. 2002.
- Ahima RS, Lazar MA. Physiology. The health risk of obesity—Better metrics imperative. Science. 341(6148):856–8. 2013.
- HHS. Office of Disease Prevention and Health. Healthy People 2020 topics and objectives: Nutrition and weight status. Washington, DC. 2011.
- National Center for Health Statistics. Questionnaires, datasets, and related documentation. 2012.
- National Center for Health Statistics. NHANES response rates and CPS totals: 2011–2012. 2013.
Suggested citation
Ogden CL, Carroll MD, Kit BK, Flegal KM. Prevalence of obesity among adults: United States, 2011–2012. NCHS data brief, no 131. Hyattsville, MD: National Center for Health Statistics. 2013.
Copyright information
All material appearing in this report is in the public domain and may be reproduced or copied without permission; citation as to source, however, is appreciated.
National Center for Health Statistics
Charles J. Rothwell, M.S., Acting Director
Jennifer H. Madans, Ph.D., Associate Director for Science
Division of Health and Nutrition Examination Surveys
Kathryn S. Porter, M.D., M.S., Director