Environmental Tobacco Smoke Exposure in Children Aged 3‒19 Years With and Without Asthma in the United States, 1999‒2010
- Key findings
- The percentage of children aged 3‒19 years without asthma exposed to ETS decreased from 1999 to 2010, while the percentage with asthma exposed to ETS did not change.
- In 2007‒2010, the percentage of ETS exposure was higher in girls with asthma than in girls without asthma.
- A higher percentage of Mexican-American children with asthma had ETS exposure than Mexican-American children without asthma.
- Among children with family income below 350% of the federal poverty guidelines, those with asthma experienced higher prevalence of ETS exposure than those without asthma.
- Children aged 6‒11 with asthma experienced a higher percentage of ETS exposure than children without asthma.
- Summary
- Definitions
- Data source and methods
- About the authors
- References
- Suggested citation
NCHS Data Brief No. 126, August 2013
PDF Version (1.5 MB)
Kenneth B. Quinto, M.D., M.P.H; Brian K. Kit, M.D., M.P.H.; Susan L. Lukacs, D.O., M.S.P.H.; and Lara J. Akinbami, M.D.
Key findings
Data from the National Health and Nutrition Examination Survey, 1999‒2010
- From 1999 to 2010, the percentage of children without asthma exposed to environmental tobacco smoke (ETS) decreased from 57.3% to 44.2%, while children with asthma showed no change, with 57.9% exposed to ETS in 1999‒2002 and 54.0% exposed in 2007‒2010.
- In 2007‒2010, a higher percentage of children with asthma were exposed to ETS than children without asthma.
- In 2007‒2010, children with asthma were more likely to be exposed to ETS than children without asthma, if they were girls, Mexican American, aged 6‒11 years, or had family income below 350% of the federal poverty guidelines.
Environmental tobacco smoke (ETS) has harmful effects on children’s respiratory health and has been linked to higher risk of middle ear infections, bronchitis and pneumonia, coughing and wheezing, worse lung function, and asthma development (1). Children with asthma whose parents smoke have more severe symptoms and more frequent exacerbations (1). National asthma guidelines recommend ETS exposure be minimized among persons with asthma (2). ETS exposure in children with and without asthma has not been directly compared in a national sample of the U.S. population. This report presents trends in ETS exposure in children with and without asthma from 1999 to 2010, and describes differences by sex, race and ethnicity, income, and age group in 2007–2010.
Keywords: National Health and Nutrition Examination Survey, childhood asthma
The percentage of children aged 3‒19 years without asthma exposed to ETS decreased from 1999 to 2010, while the percentage with asthma exposed to ETS did not change.
Figure 1. Percentage of children aged 3–19 years exposed to ETS, by asthma status, 1999–2010
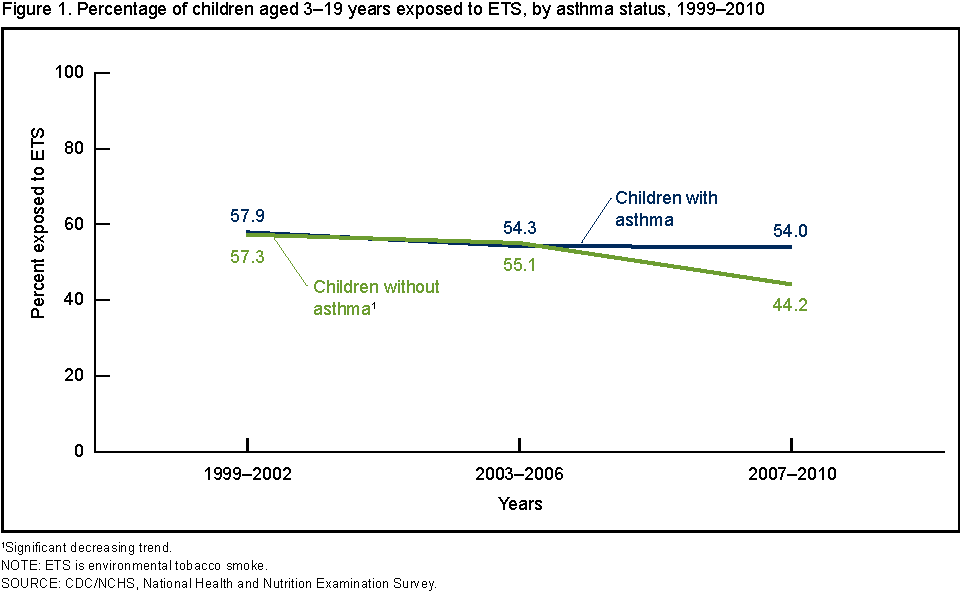
1Significant decreasing trend.
NOTE: ETS is environmental tobacco smoke.
SOURCE: CDC/NCHS, National Health and Nutrition Examination Survey.
From 1999 to 2010, the percentage of children without asthma exposed to ETS decreased from 57.3% to 44.2%, while the percentage of exposed children with asthma showed no decline; 57.9% in 1999‒2002 and 54.0% in 2007‒2010 (Figure 1). There was no difference in ETS exposure between children with asthma and children without asthma in 1999–2002 and 2003–2006. The percentage of children exposed to ETS was higher among children with asthma than those without asthma in 2007–2010.
In 2007‒2010, the percentage of ETS exposure was higher in girls with asthma than in girls without asthma.
In girls with asthma, 57.6% experienced ETS exposure, while 43.6% of girls without asthma had ETS exposure. No difference was seen in the percentage exposed to ETS between boys with asthma (50.8%) and without asthma (44.7%) (Figure 2).
Figure 2. Percentage of children aged 3–19 years exposed to ETS, by asthma status and sex, 2007–2010
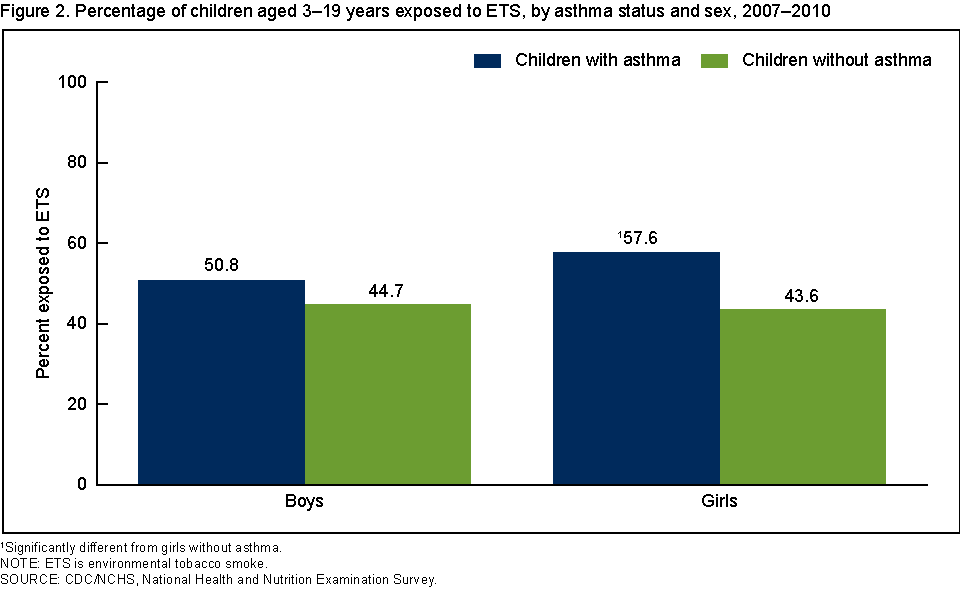
1Significantly different from girls without asthma.
NOTE: ETS is environmental tobacco smoke.
SOURCE: CDC/NCHS, National Health and Nutrition Examination Survey.
A higher percentage of Mexican-American children with asthma had ETS exposure than Mexican-American children without asthma.
The percentage exposed to ETS was higher for Mexican-American children with asthma (38.2%) than those without asthma (27.4%) (Figure 3). No other differences were seen between children with and without asthma by race and ethnicity.
Figure 3. Percentage of children aged 3–19 years exposed to ETS, by asthma status and race and ethnicity, 2007–2010
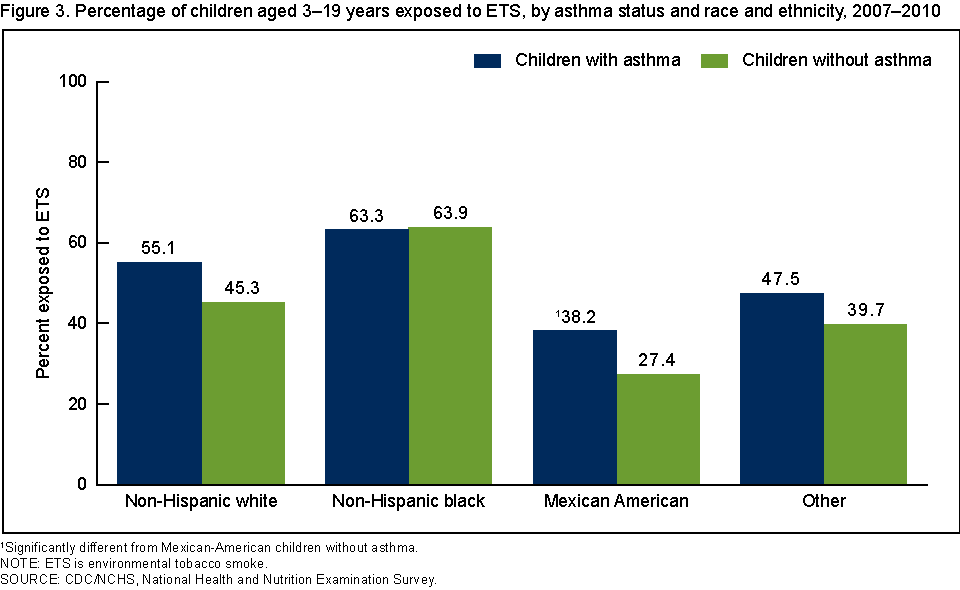
1Significantly different from Mexican-American children without asthma.
NOTE: ETS is environmental tobacco smoke.
SOURCE: CDC/NCHS, National Health and Nutrition Examination Survey.
Among children with family income below 350% of the federal poverty guidelines, those with asthma experienced higher prevalence of ETS exposure than those without asthma.
Among children in families with income below 185% of the federal poverty guidelines, children with asthma had higher prevalence of ETS exposure than children without asthma. The same was also true among children from families with income between 185% and 350% of the federal poverty guidelines. No difference in ETS exposure was seen between children with and without asthma from higher-income families (350% of the federal poverty guidelines and above) (Figure 4).
Figure 4. Percentage of children aged 3–19 years exposed to ETS, by asthma status and family income to poverty ratio, 2007–2010
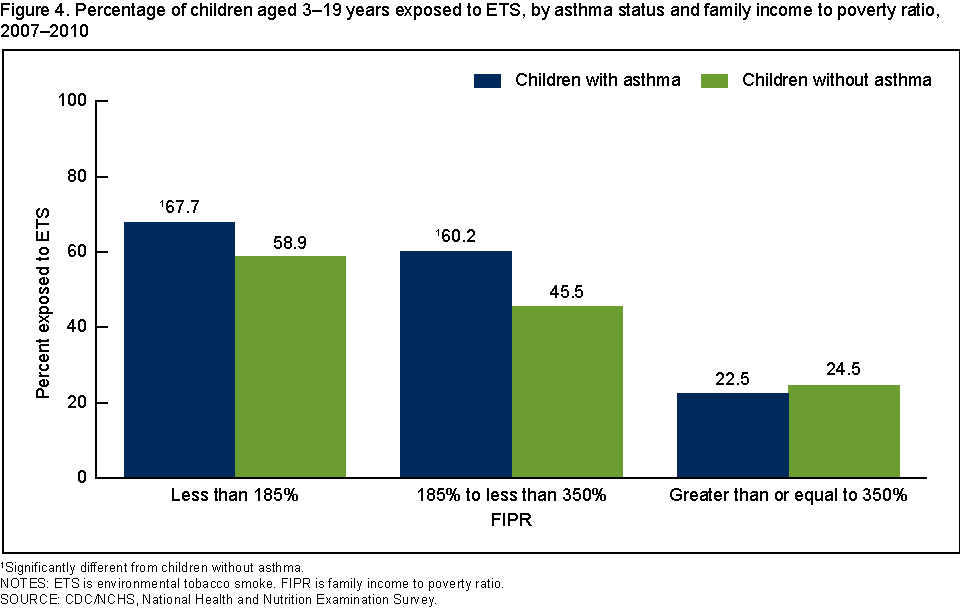
1Significantly different from children without asthma.
NOTES: ETS is environmental tobacco smoke. FIPR is family income to poverty ratio.
SOURCE: CDC/NCHS, National Health and Nutrition Examination Survey.
Children aged 6‒11 with asthma experienced a higher percentage of ETS exposure than children without asthma.
Among children aged 6‒11, those with asthma had a higher percentage of ETS exposure (58.8%) than those without asthma (44.7%) (Figure 5). No difference was seen in ETS exposure between children with and without asthma in the other age groups.
Figure 5. Percentage of children aged 3–19 years exposed to ETS, by asthma status and age group, 2007–2010
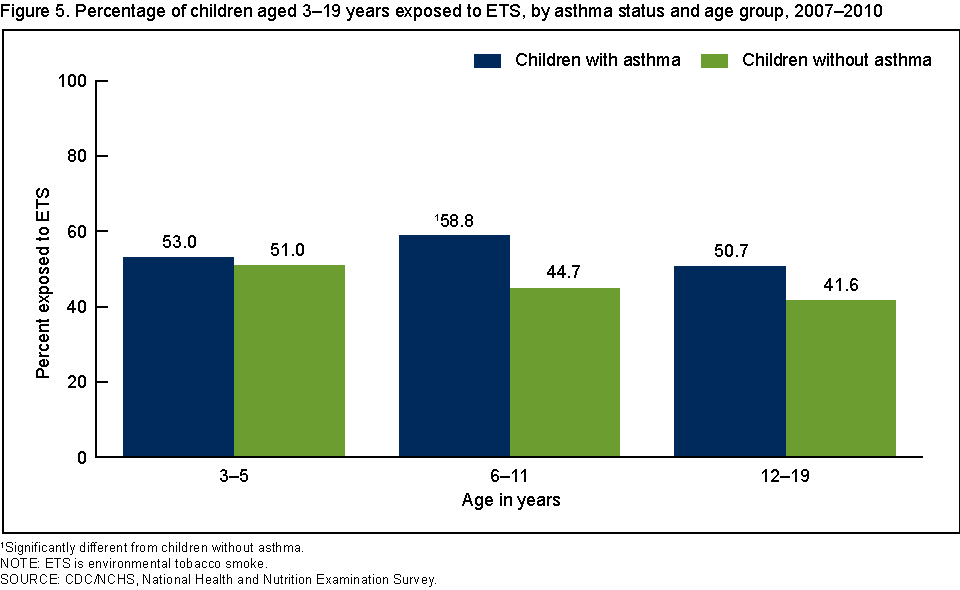
1Significantly different from children without asthma.
NOTE: ETS is environmental tobacco smoke.
SOURCE: CDC/NCHS, National Health and Nutrition Examination Survey.
Summary
The National Asthma Education and Prevention Program Guidelines for Diagnosis and Management of Asthma recommend that people with asthma avoid tobacco smoke exposure (2). Asthma is common among children in the United States. In 2007‒2010, 1 child in 10 had asthma. However, while ETS exposure among children aged 3‒19 without asthma decreased from 57.3% to 44.2% from 1999‒2010, there was no change during this period in the percentage of children with asthma who were exposed to ETS. As a result, ETS exposure among children with asthma was higher (54.0%) than for those without asthma (44.2%) in 2007‒2010. Among demographic subgroups of children with asthma, girls, Mexican-American children, those with family income below 350% of the federal poverty guidelines, and children aged 6‒11 experienced higher ETS exposure than their counterparts without asthma. More in-depth analysis may provide an explanation for these differences among these subgroups.
Definitions
Child with asthma: Based on an affirmative response to both the following questions: “Has a doctor or other health professional ever told you that [sample child] has asthma?” and “Does [sample child] still have asthma?”
Environmental tobacco smoke (ETS) exposure: Only children who were classified as nonsmokers were included in the analysis. Smokers were defined as respondents aged 12–19 who answered “yes” to the question of use of tobacco products in the last 5 days or whose serum cotinine measurement was greater than 10 ng/mL. Serum cotinine is a breakdown product of nicotine. Among nonsmokers, serum cotinine measurements greater than or equal to 0.05 ng/mL and less than or equal to 10 ng/mL were considered to indicate recent exposure to ETS, and those less than 0.05 ng/mL were considered to indicate no exposure (3,4).
Family income to poverty ratio (FIPR): An index representing the ratio of family income to the federal poverty threshold based on family size. The U.S. Department of Health and Human Services’ poverty guidelines were used as the poverty measure to calculate this index (5). Income eligibility for participation in some federal programs, including reduced-price lunches during the study period, is 185% (FIPR less than 1.85) of the poverty guidelines (6).
Data source and methods
National Health and Nutrition Examination Survey (NHANES) data were used for these analyses. NHANES is conducted by the Centers for Disease Control and Prevention’s National Center for Health Statistics to assess the health and nutritional status of the civilian noninstitutionalized U.S. population. The survey consists of both an in-home interview and a standardized physical examination at a mobile examination center (MEC). The data for this report were collected from in-home interviews and an in-person standardized physical examination conducted at a MEC where participants had blood samples taken to perform various testing, including serum cotinine measurement. Serum cotinine was measured only in participants aged 3 years and over. Between 1999‒2000 and 2009‒2010, the response rate to the survey ranged from 78.4% in 2007‒2008 to 84.0% in 2001‒2002 (7).
The sample design includes oversampling to obtain reliable estimates of health and nutritional measures for population subgroups. In 2007‒2010, NHANES oversampled low-income persons, non-Hispanic black persons, and Hispanic persons. Data were analyzed using sample weights to account for differential probabilities of selection, nonresponse, and noncoverage. The standard errors of the percentages were estimated using Taylor series linearization, a method that accounts for the complex sampling design of NHANES.
Differences between groups were evaluated using a t statistic at the p < 0.05 significance level with the appropriate degrees of freedom. Differences between percentages were evaluated using two-sided significance tests at the 0.05 level. To test for linear trends between ETS exposure and children with and without asthma over time, the null hypothesis of nonlinear trend was examined using univariate logistic regression. Terms such as “higher than” and “less than” indicate statistically significant differences. Terms such as “similar” and “no difference” indicate that the statistics being compared were not significantly different. Lack of comment regarding the difference between any two statistics does not necessarily suggest that the difference was tested and found to be not significant. Statistical analyses were conducted using SAS System for Windows version 9.3 (SAS Institute Inc., Cary, N.C.) and SUDAAN version 11.0 (RTI International, Research Triangle Park, N.C.).
About the authors
Kenneth B. Quinto is with the Centers for Disease Control and Prevention’s (CDC) Epidemic Intelligence Service and the National Center for Health Statistics, Office of Analysis and Epidemiology. Brian K. Kit is with CDC’s National Center for Health Statistics, Division of Health and Nutrition Examination Surveys. Susan L. Lukacs and Lara J. Akinbami are with CDC’s National Center for Health Statistics, Office of Analysis and Epidemiology.
References
- U.S. Department of Health and Human Services. The health consequences of involuntary exposure to tobacco smoke: A report of the Surgeon General. Rockville, MD: Public Health Service. 2006.
- National Asthma Education and Prevention Program. Expert panel report 3: Guidelines for the diagnosis and management of asthma. Bethesda, MD: National Heart, Lung, and Blood Institute. 2007.
- Pirkle JL, Flegal KM, Bernert JT, Brody DJ, Etzel RA, Maurer KR. Exposure of the US population to environmental tobacco smoke: The Third National Health and Nutrition Examination Survey, 1988 to 1991. JAMA 275(16):1233–40. 1996.
- Centers for Disease Control and Prevention. Disparities in secondhand smoke exposure—United States, 1988–1994 and 1999–2004. MMWR 57(27):744–7. 2008.
- U.S. Department of Health and Human Services. Poverty guidelines, research, and measurement. 2013. [Accessed March 11, 2013].
- U.S. Department of Agriculture. Child nutrition programs—Income eligibility guidelines [PDF – 259 KB]. Fed Regist 74(58):13410–2. 2009. [Accessed March 11, 2013].
- National Health and Nutrition Examination Survey. NHANES response rates and CPS totals. 1999–2010 response rates. [Accessed May 28, 2013].
Suggested citation
Quinto KB, Kit BK, Lukacs SL, Akinbami LJ. Environmental tobacco smoke exposure in children aged 3‒19 years with and without asthma in the United States, 1999‒2010. NCHS data brief, no 126. Hyattsville, MD: National Center for Health Statistics. 2013.
Copyright information
All material appearing in this report is in the public domain and may be reproduced or copied without permission; citation as to source, however, is appreciated.
National Center for Health Statistics
Charles J. Rothwell, M.S., Acting Director
Jennifer H. Madans, Ph.D., Associate Director for Science
Office of Analysis and Epidemiology
Irma E. Arispe, Ph.D., Director