Changes in Cesarean Delivery Rates by Gestational Age: United States, 1996–2011
- Key findings
- The singleton birth cesarean delivery rate increased from 1998 to 2009 but was stable from 2009 to 2011.
- The cesarean delivery rate decreased for births at 38 weeks from 2009 to 2011, but increased for births at 39 weeks.
- Cesarean delivery rates at 38 weeks declined for all maternal age groups, but increased at 39 weeks.
- Cesarean delivery rates at 38 weeks declined for all racial and ethnic groups, but rose at 39 weeks from 2009 to 2011.
- Cesarean delivery rates at 38 weeks declined in more than one-half of all states.
- Summary
- Definitions
- Data source and methods
- About the authors
- References
- Suggested citation
NCHS Data Brief No. 124, June 2013
PDF Version (885 KB)
Michelle J.K. Osterman, M.H.S.; and Joyce A. Martin, M.P.H.
Key findings
Data from the Natality Data File, National Vital Statistics System
- After 12 years of consecutive increases, the preliminary cesarean delivery rate among singleton births was unchanged from 2009 to 2011 (31.3%).
- Cesarean delivery rates decreased more than 5% among births at 38 weeks of gestation, but increased 4% among births at 39 weeks.
- Decreases in cesarean delivery rates for births at 38 weeks occurred for non-Hispanic white, non-Hispanic black, and Hispanic women, as well as for all maternal age groups.
- Increases in cesarean delivery rates for births at 39 weeks occurred among non-Hispanic white, non-Hispanic black, and Hispanic women, as well as for all maternal age groups.
- The cesarean delivery rate at 38 weeks decreased in 30 states; the cesarean delivery rate at 39 weeks increased in 23 states.
The total U.S. cesarean delivery rate reached a high of 32.9% of all births in 2009, rising 60% from the most recent low of 20.7 in 1996 (1). Recently, the American College of Obstetricians and Gynecologists developed clinical guidelines for reducing the occurrence of nonmedically-indicated cesarean delivery and labor induction prior to 39 weeks (2,3). Efforts to reduce such births include initiatives to improve perinatal care quality, changes in hospital policy to disallow elective delivery prior to 39 weeks, and education of the public (4–10). Since 2009, the U.S. cesarean delivery rate has not increased. This report explores cesarean delivery rates by gestational age for 1996–2011, focusing on 2009–2011. Data for 2011 are preliminary; 1996–2010 data are final. Analysis is limited to singleton births; multiple births are nearly 2.5 times more likely to be delivered by cesarean.
Keywords: race and Hispanic origin, National Vital Statistics System
The singleton birth cesarean delivery rate increased from 1998 to 2009 but was stable from 2009 to 2011.
Figure 1. Cesarean delivery, by gestational age: United States, final 1996–2010 and preliminary 2011
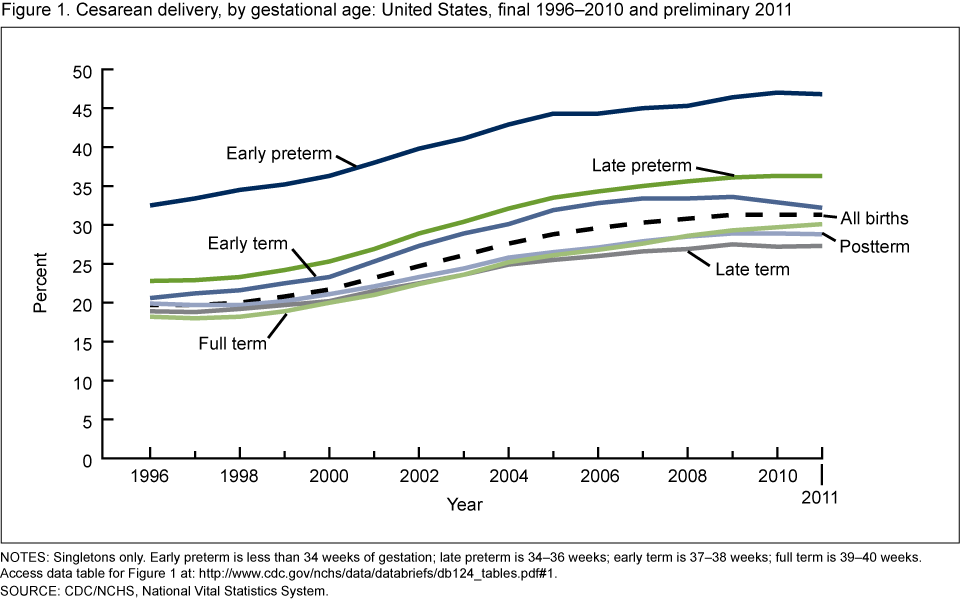
NOTES: Singletons only. Early preterm is less than 34 weeks of gestation; late preterm is 34–36 weeks; early term is 37–38 weeks; full term is 39–40 weeks. Access data table for Figure 1 [PDF – 206 KB].
SOURCE: CDC/NCHS, National Vital Statistics System.
The U.S. cesarean delivery rate for singleton births increased nearly 60% from 1996–1997 to 2009, from 19.7% to 31.3%. For the most recent 3-year period 2009–2011, however, this rate has been stable at 31.3% (Figure 1).
Cesarean delivery rates increased at least 40% for all gestational age groups for 1996–2009. Rates increased more than 60% over this period for births at 37–38 weeks (early term; 20.6% to 33.6%), and at 39–40 weeks (full term; 18.2% to 29.3%).
From 2009 to 2011, the early-term cesarean delivery rate declined 4% to 32.2% in 2011. In contrast, the full-term cesarean delivery rate continued to increase, rising 3% to 30.1%.
Changes from 2009 to 2011 in cesarean delivery rates for other gestational ages, that is, early and late preterm, and late- and postterm births, were not statistically significant.
The cesarean delivery rate decreased for births at 38 weeks from 2009 to 2011, but increased for births at 39 weeks.
When early- and full-term births were examined by individual week for 2009–2011, differing trends among the weeks emerged. Among early-term births at 37 weeks, the cesarean delivery rate decreased less than 1% (from 33.1% to 32.8%), whereas the rate at 38 weeks declined 5% (from 33.8% in 2009 to 32.0% in 2011) (Figure 2).
The cesarean delivery rate for full-term births at 39 weeks rose 4%, from 32.4% in 2009 to 33.7% in 2011, but the rate at 40 weeks remained essentially unchanged during this time.
Figure 2. Cesarean delivery at 37, 38, 39, and 40 weeks of gestation: United States, final 1996–2010 and preliminary 2011
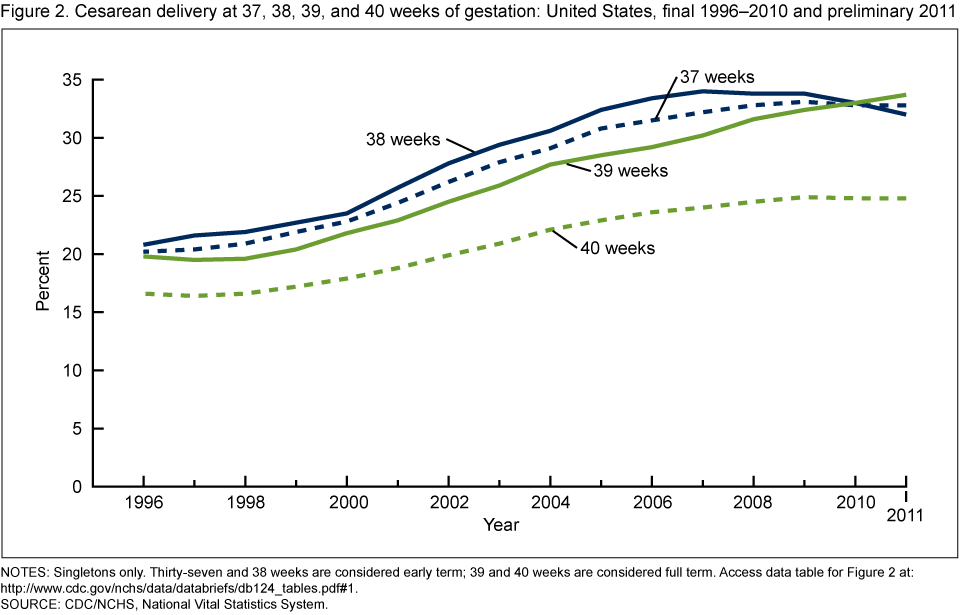
NOTES: Singletons only. Thirty-seven and 38 weeks are considered early term; 39 and 40 weeks are considered full term. Access data table for Figure 2 [PDF 206 KB].
SOURCE: CDC/NCHS, National Vital Statistics System.
Cesarean delivery rates at 38 weeks declined for all maternal age groups, but increased at 39 weeks.
Cesarean rates for births at 38 weeks fell by at least 5% for all maternal age groups from 2009 to 2011 (Figure 3).
The largest decline by maternal age at 38 weeks was among women under 25 years, down nearly 7%, from 26.5% to 24.7%.
In contrast, cesarean delivery rates among births at 39 weeks were at least 1% higher in 2011 than in 2009 for all maternal age groups. Rates increased at least 3% during this time period for all maternal age groups 25 and over.
Figure 3. Cesarean delivery at 38 and 39 weeks of gestation, by age of mother: United States, final 2009 and preliminary 2011
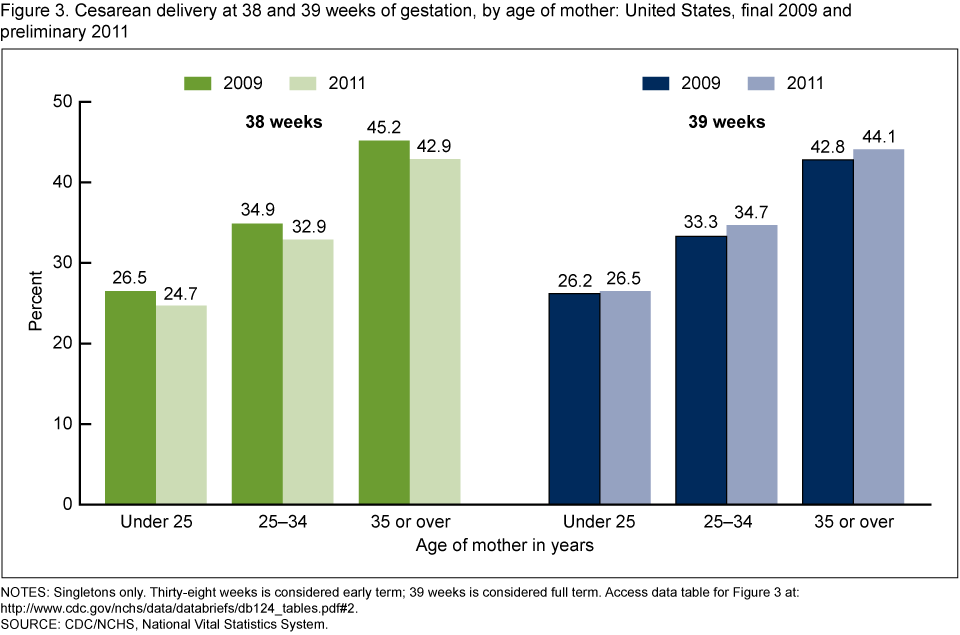
NOTES: Singletons only. Thirty-eight weeks is considered early term; 39 weeks is considered full term. Access data table for Figure 3 [PDF – 206 KB].
SOURCE: CDC/NCHS, National Vital Statistics System.
Cesarean delivery rates at 38 weeks declined for all racial and ethnic groups, but rose at 39 weeks from 2009 to 2011.
Cesarean delivery rates for births at 38 weeks declined for each of the largest racial and ethnic groups (Figure 4). Rates at 38 weeks declined nearly 6% for non-Hispanic white women (34.2% to 32.2%) and at least 4% for non-Hispanic black (33.9% to 32.4%) and Hispanic (33.3% to 31.7%) women.
In contrast, cesarean delivery rates for births at 39 weeks rose for each racial and ethnic group from 2009 to 2011. Hispanic women had the largest increase in cesarean delivery at 39 weeks—6% (31.2% to 33.1%). For non-Hispanic black women, the rate increased nearly 4% (34.0% to 35.3%). The rate for non-Hispanic white women increased nearly 3%, from 32.6% to 33.5%.
Figure 4. Percent change in cesarean delivery rates at 38 and 39 weeks of gestation, by race and Hispanic origin of mother: United States, 2009–2011
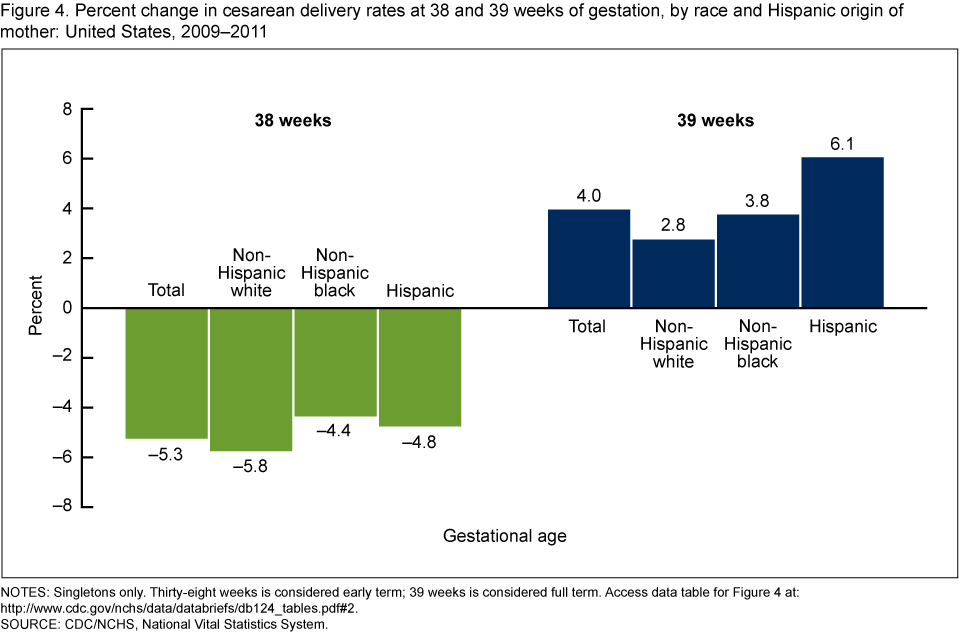
NOTES: Singletons only. Thirty-eight weeks is considered early term; 39 weeks is considered full term. Access data table for Figure 4 [PDF – 206 KB].
SOURCE: CDC/NCHS, National Vital Statistics System.
Cesarean delivery rates at 38 weeks declined in more than one-half of all states.
From 2009 to 2011, the cesarean delivery rate at 38 weeks decreased in 30 states (Figure 5).
Cesarean delivery rates at 38 weeks declined more than 10% for three states: Alaska, Delaware, and Hawaii. Rates for five states declined less than 5%. Most state-specific decreases were between 5% and 10%. Changes in 20 states and the District of Columbia were not statistically significant.
Among births at 39 weeks, cesarean delivery rates rose in 23 states from 2009 to 2011.
In general, increases in the cesarean delivery rate at 39 weeks were of a smaller magnitude than the state-specific decreases at 38 weeks. Rates for 14 states increased less than 5% from 2009 to 2011. Rates for the remaining 9 states increased from 5% to 10%. Changes in 27 states and the District of Columbia were not statistically significant.
Figure 5. Change in cesarean delivery rates at 38 and 39 weeks of gestation, by state, 2009–2011
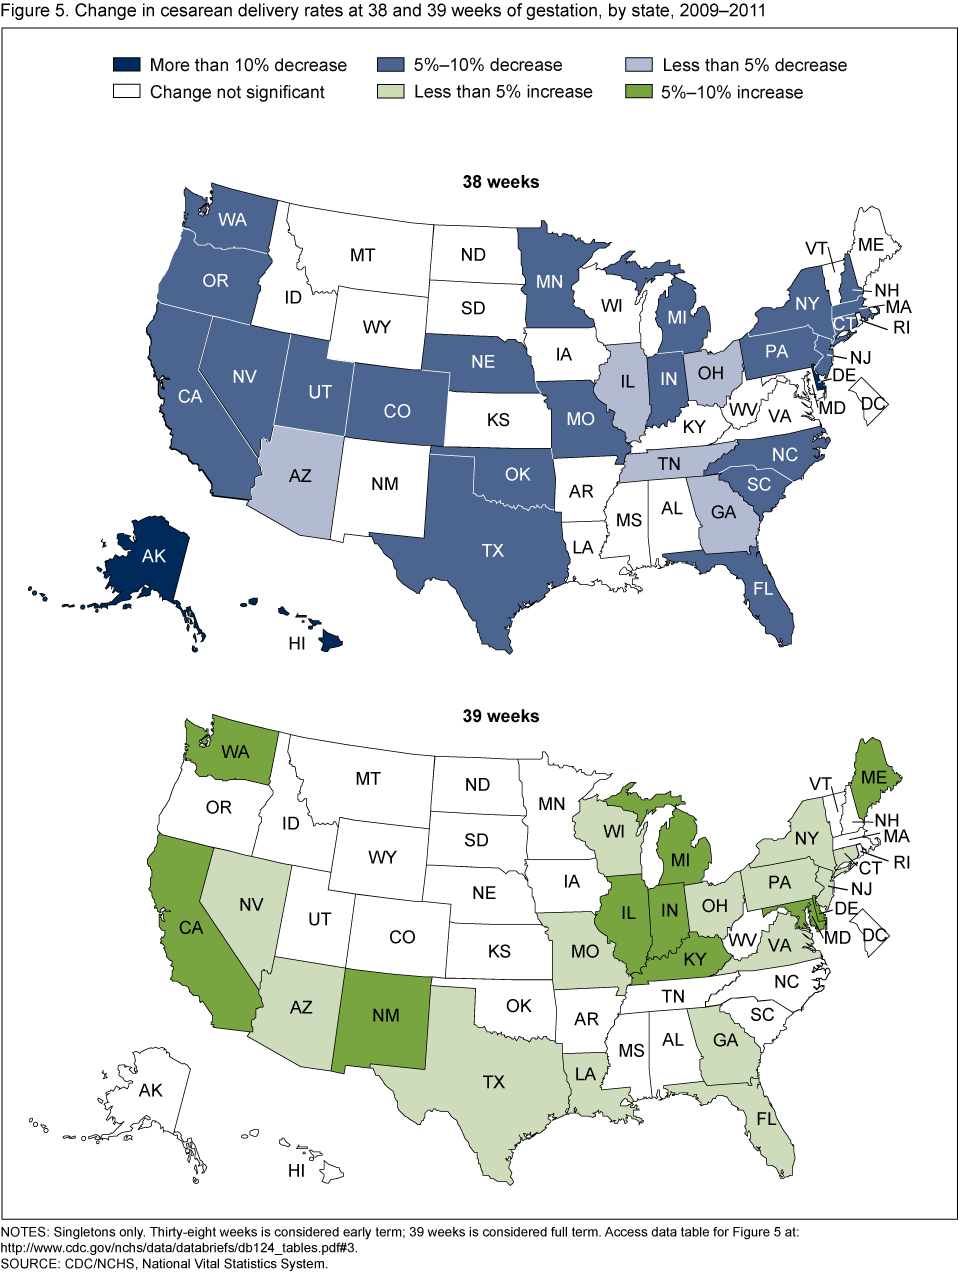
NOTES: Singletons only. Thirty-eight weeks is considered early term; 39 weeks is considered full term. Access data table for Figure 5 [PDF – 206 KB].
SOURCE: CDC/NCHS, National Vital Statistics System.
Summary
After 12 consecutive years of steadily increasing rates, the preliminary singleton cesarean delivery rate was stable for 2009–2011. By gestational age, the largest changes from 2009–2011 occurred among births at 38 and 39 weeks. The rate at 38 weeks fell, while the rate at 39 weeks continued to increase. Declines in cesarean delivery rates at 38 weeks were widespread, occurring among all maternal age groups, all racial and Hispanic origin groups, and more than one-half of all states. In contrast, the cesarean delivery rates for births at 39 weeks rose for all maternal age groups, all racial and Hispanic origin groups, and in nearly one-half of all states.
National vital statistics data show recent changes in the percentage of all singleton births delivered at 38 weeks (17% in 2011, down from 19% in 2009) and at 39 weeks (30% in 2011, up from 28% in 2009) (11,12). This shift toward longer pregnancies is consistent with efforts to reduce nonmedically indicated deliveries for nulliparous, vertex (head first), singleton deliveries before 39 completed weeks of gestation because of the greater risk of poor outcomes for earlier gestations (13). These efforts are mainly focused on induction of labor, but may have a direct effect on cesarean delivery; women who have been induced are nearly twice as likely to be delivered by cesarean as women with noninduced, spontaneous labor (14). Future research will identify the broader impact of this change on maternal and infant health outcomes.
Definitions
Cesarean delivery: Extraction of the infant, placenta, and membranes through an incision in the maternal abdominal and uterine walls.
Cesarean delivery rate: Number of births delivered by cesarean per 100 births.
Singleton birth: Individual live birth in a singleton (one fetus) pregnancy.
Singleton cesarean delivery rate: Number of singleton births delivered by cesarean per 100 singleton births.
Multiple birth: Individual live birth in a multiple (more than one fetus) pregnancy.
Multiple-birth cesarean delivery rate: Number of births in multiple pregnancies delivered by cesarean per 100 multiple births.
Gestational age categories
- Early preterm: Births prior to 34 completed weeks of gestation.
- Late preterm: Births at 34–36 completed weeks of gestation.
- Early term: Births at 37–38 completed weeks of gestation.
- Full term: Births at 39–40 completed weeks of gestation.
- Late term: Births at 41 completed weeks of gestation.
- Postterm: Births at 42 or more completed weeks of gestation.
Data source and methods
This report contains preliminary data from the Natality Data File from the National Vital Statistics System. The vital statistics Natality File includes information on a wide range of maternal and infant demographic and health characteristics for all births occurring in the United States. Final data may also be accessed from the interactive data access tool, VitalStats.
This report focuses on births in singleton deliveries, which make up the bulk of all newborns (96.5% in 2011). Births in multiple deliveries are excluded because of the much higher likelihood of cesarean delivery among multiple births compared with singletons.
The primary measure used to determine gestational age is the interval between the first day of the mother’s last normal menstrual period (LMP) and the date of birth. The clinical or obstetric estimate of gestation is substituted where the LMP is missing or inconsistent with birthweight (1,11).
References to rate increases or decreases indicate statistically significant differences. Computations exclude records with missing data.
About the authors
Michelle J.K. Osterman and Joyce A. Martin are with the Centers for Disease Control and Prevention’s National Center for Health Statistics, Division of Vital Statistics, Reproductive Statistics Branch.
References
- Martin JA, Hamilton BE, Ventura SJ, et al. Births: Final data for 2009. National vital statistics reports; vol 60 no 1. Hyattsville, MD: National Center for Health Statistics. 2011.
- American College of Obstetricians and Gynecologists. ACOG Committee Opinion No. 394: Cesarean delivery on maternal request. Obstet Gynecol 110(6):1501. 2007.
- American College of Obstetricians and Gynecologists. Induction of labor. ACOG Practice Bulletin No. 107. Obstet Gynecol 114(2):386–97. 2009.
- Main E, Oshiro B, Chagolla B, Bingham D, Dang-Kilduff L, Kowalewski L. Elimination of non-medically indicated (elective) deliveries before 39 weeks gestational age. California Maternal Quality Care Collaborative, California Department of Public Health, and March of Dimes. 2010.
- Florida Perinatal Quality Collaborative. Think 39 weeks! Healthy babies are worth the wait. [Accessed 10/23/12].
- Donovan EF, Lannon C, Bailit J, Rose B, Iams JD, Byczkowski T. A statewide initiative to reduce inappropriate scheduled births at 36(0/7)–38(6/7) weeks’ gestation. Am J Obstet Gynecol 202(3):243.e1–8. 2010.
- American College of Obstetricians and Gynecologists. Patient safety checklist no. 5: Scheduling induction of labor. Obstet Gynecol 118(6):1473–4. 2011.
- Clark SL, Frye DR, Meyers JA, Belfort MA, Dildy GA, Kofford S, et al. Reduction in elective delivery <39 weeks of gestation: Comparative effectiveness of 3 approaches to change and the impact on neonatal intensive care admission and stillbirth. Am J Obstet Gynecol 203(5):449.e1–6. 2010.
- Association of Women’s Health, Obstetric and Neonatal Nurses. 40 reasons to go the full 40 [PDF – 395 KB]. [Accessed 10/23/12].
- March of Dimes. Why at least 39 weeks is best for your baby. [Accessed 10/23/12].
- Martin JA, Hamilton BE, Ventura SJ, et al. Births: Final data for 2010. National vital statistics reports; vol 61 no 1. Hyattsville, MD: National Center for Health Statistics. 2012.
- Martin JA, Wilson EC, MacDorman MF, Mathews TJ, Hoyert D. Gestational age in vital statistics: Trends, outcomes and measurement. Rockville, MD: NICHD Definition of Term Workshop. 2012.
- American College of Obstetricians and Gynecologists. ACOG Committee Opinion No. 561: Nonmedically indicated early-term deliveries. Obstet Gynecol 121(4):911–5. 2013.
- Zhang J, Troendle J, Reddy UM, Laughon SK, Branch DW, Burkman R, et al. Contemporary cesarean delivery practice in the United States. Am J Obstet Gynecol 203(4):326.e1–326.e10. 2010.
Suggested citation
Osterman MJK, Martin JA. Changes in cesarean delivery rates by gestational age: United States, 1996–2011. NCHS data brief, no 124. Hyattsville, MD: National Center for Health Statistics. 2013.
Copyright information
All material appearing in this report is in the public domain and may be reproduced or copied without permission; citation as to source, however, is appreciated.
National Center for Health Statistics
Charles J. Rothwell, M.S., Acting Director
Jennifer H. Madans, Ph.D., Associate Director for Science
Division of Vital Statistics
Delton Atkinson, M.P.H., M.P.H., P.M.P., Acting Director