Trends in Intake of Energy and Macronutrients in Children and Adolescents From 1999–2000 Through 2009–2010
- Key findings
- Did the average energy intake for children and adolescents in the United States change over the 12 years studied?
- Were there any changes in macronutrient intakes expressed as a percentage of total daily kilocalorie intake for children and adolescents aged 2–19 over the 12 years studied?
- Were there any changes in the percentage of kilocalories from protein by race and ethnicity for children and adolescents aged 2–19 over the 12 years studied?
- Were there any changes in the percentage of kilocalories from carbohydrate by race and ethnicity for children and adolescents aged 2–19 over the 12 years studied?
- Were there any changes in the percentage of kilocalories from total or saturated fat by race and ethnicity for children and adolescents aged 2–19 over the 12 years studied?
- Summary
- Definitions
- Data source and methods
- About the authors
- References
- Suggested citation
NCHS Data Brief No. 113, February 2013
PDF Version (496 KB)
R. Bethene Ervin, Ph.D., R.D., and Cynthia L. Ogden, Ph.D., M.R.P.
Key findings
Data from the National Health and Nutrition Examination Survey, 1999–2010
- Caloric intakes for most of the age groups decreased between 1999–2000 and 2009–2010.
- The percentage of total kilocalories from protein generally increased for children and adolescents except for non-Hispanic black girls.
- The percentage of total kilocalories from carbohydrate decreased for non-Hispanic white boys and girls and for non-Hispanic black boys.
- The percentage of total kilocalories from total fat or saturated fat for children and adolescents changed very little.
Between 1999–2000 and 2009–2010, the prevalence of obesity increased among boys, but not among girls. There was no change however, in the prevalence of obesity between 2007–2008 and 2009–2010 for either boys or girls (1). It is unclear if the changes in the prevalence of obesity were associated with corresponding changes in energy and macronutrient intakes in children and adolescents during this time frame. An earlier publication reported trends in energy and macronutrient intake in adults between 1999 and 2008 (2). The objective of this report is to present trends in energy and macronutrient intakes among U.S. children and adolescents aged 2–19 years between 1999 and 2010. These results are presented by sex, age group, and race and ethnicity.
Keywords: caloric intake, diet, nutrients, National Health and Nutrition Examination Survey
Did the average energy intake for children and adolescents in the United States change over the 12 years studied?
- Average energy intakes for all boys and all girls aged 2–19 decreased over this 12-year period (Figure 1). The average energy intake for boys decreased from 2,258 kilocalories in 1999–2000 to approximately 2,100 kilocalories in 2009–2010. The average energy intake for girls decreased from 1,831 kilocalories in 1999–2000 to 1,755 kilocalories in 2009–2010.
- Energy intakes decreased over this 12-year period for boys aged 2–5 and 6–11, but there was no linear trend in energy intake for boys aged 12–19. Energy intakes for girls aged 12–19 decreased over this time period. There were no linear trends in energy intakes for girls aged 2–5 or 6–11.
Figure 1. Mean energy intake for children and adolescents aged 2–19 years, by sex and age group, 1999–2010
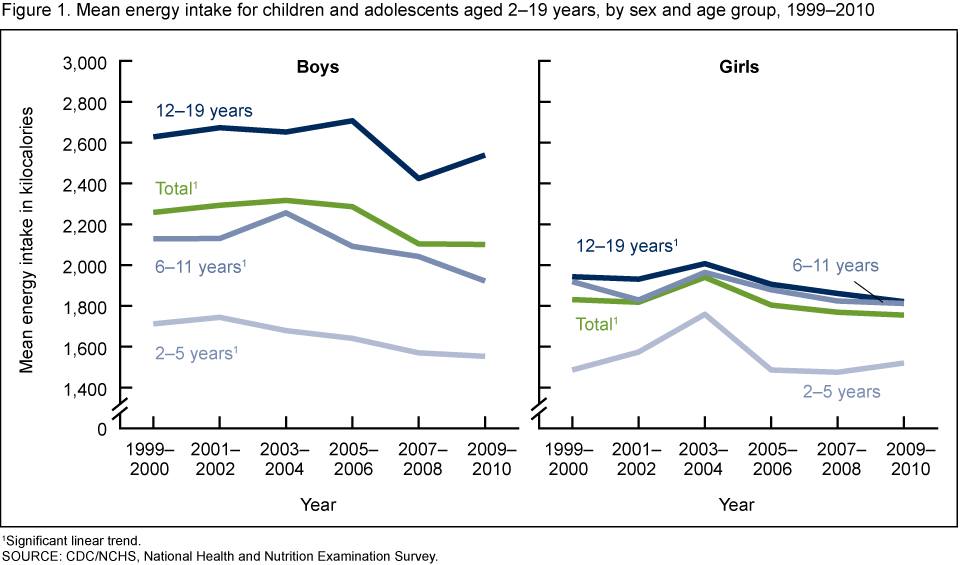
1Significant linear trend.
SOURCE: CDC/NCHS, National Health and Nutrition Examination Survey.
Were there any changes in macronutrient intakes expressed as a percentage of total daily kilocalorie intake for children and adolescents aged 2–19 over the 12 years studied?
- Between 1999–2000 and 2009–2010, the percentage of kilocalories from protein increased from 13.5% to 14.7% for boys and from 13.4% to 14.3% for girls aged 2–19 (Figure 2).
- Among children and adolescents aged 2–19, the percentage of kilocalories from carbohydrate for boys decreased from 55.0% in 1999–2000 to 54.3% in 2009–2010 and for girls from 55.8% in 1999–2000 to 54.5% in 2009–2010.
- There were no trends in the percentage of kilocalories from total fat or saturated fat for boys or for girls aged 2–19.
Figure 2. Mean macronutrient intake for children and adolescents aged 2–19 years, by sex, 1999–2010
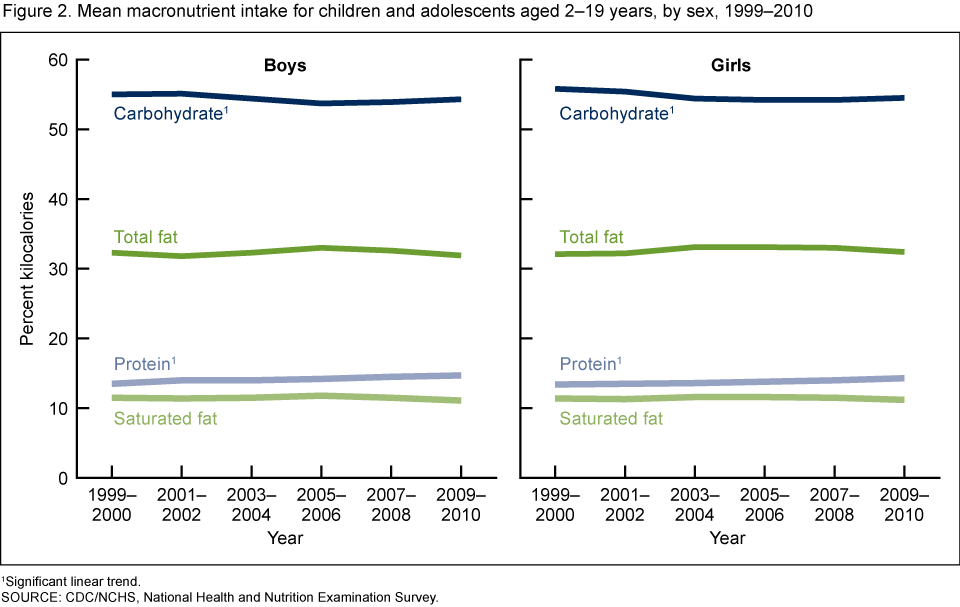
1Significant linear trend.
SOURCE: CDC/NCHS, National Health and Nutrition Examination Survey.
Were there any changes in the percentage of kilocalories from protein by race and ethnicity for children and adolescents aged 2–19 over the 12 years studied?
- The percentage of kilocalories from protein increased among the three racial and ethnic groups for boys aged 2–19. Over the 12 years studied, the percentage of kilocalories from protein increased from 13.1% to 14.6% for non-Hispanic white boys, from 13.6% to 14.5% for non-Hispanic black boys, and from 14.3% to 15.0% for Mexican-American boys (Figure 3).
- The percentage of kilocalories from protein for non-Hispanic white and Mexican-American girls increased, whereas the percentage for non-Hispanic black girls aged 2–19 did not. The percentage of kilocalories from protein increased from 13.2% to 14.2% for non-Hispanic white girls and from 14.5% to 15.3% for Mexican-American girls over this time period. Among non-Hispanic black girls, the prevalence remained at about 13.5%.
Figure 3. Mean protein intake for children and adolescents aged 2–19 years, by sex and race and ethnicity, 1999–2010
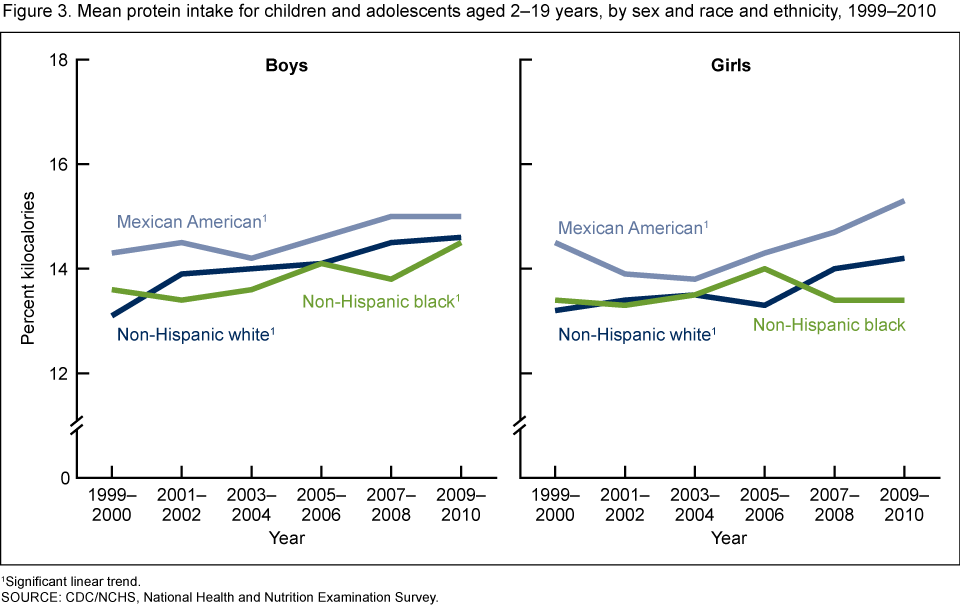
1Significant linear trend.
SOURCE: CDC/NCHS, National Health and Nutrition Examination Survey.
Were there any changes in the percentage of kilocalories from carbohydrate by race and ethnicity for children and adolescents aged 2–19 over the 12 years studied?
- The percentage of kilocalories from carbohydrate for non-Hispanic white and non-Hispanic black boys decreased, but did not decrease among Mexican-American boys. Over the 12 years studied, the percentage of kilocalories from carbohydrate decreased from 55.6% to 54.6% for non-Hispanic white boys and from 54.6% to 53.1% for non-Hispanic black boys (Figure 4).
- The percentage of kilocalories from carbohydrate for non-Hispanic white girls decreased, but did not decrease for non-Hispanic black and Mexican-American girls. The percentage of kilocalories from carbohydrate decreased from 56.3% to 54.3% for non-Hispanic white girls over this time period.
Figure 4. Mean carbohydrate intake for children and adolescents aged 2–19 years, by sex and race and ethnicity, 1999–2010
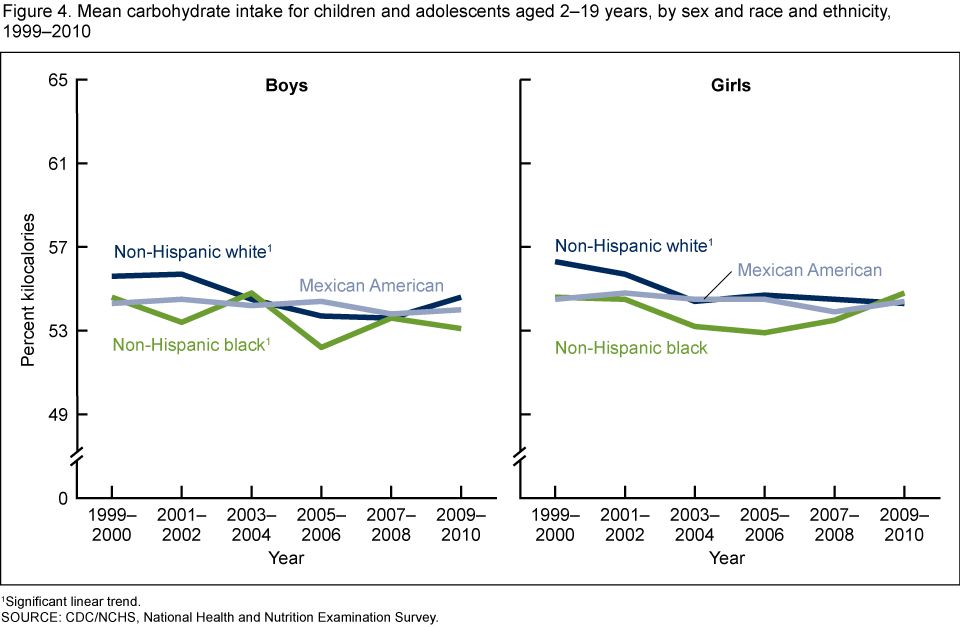
1Significant linear trend.
SOURCE: CDC/NCHS, National Health and Nutrition Examination Survey.
Were there any changes in the percentage of kilocalories from total or saturated fat by race and ethnicity for children and adolescents aged 2–19 over the 12 years studied?
- There were no significant trends in the percentage of kilocalories from total fat for any racial or ethnic group for boys or for girls aged 2–19 (data not shown in a figure). On average, boys and girls in all three racial and ethnic groups consumed about one-third of their kilocalories from total fat.
- The percentage of kilocalories from saturated fat decreased for Mexican-American boys and girls aged 2–19. The percentage of kilcalories from saturated fat decreased from 12.0% to 11.0% for Mexican-American boys and from 11.8% to 10.7% for Mexican-American girls (Figure 5).
Figure 5. Mean saturated fat intake for children and adolescents aged 2–19 years, by sex and race and ethnicity, 1999–2010
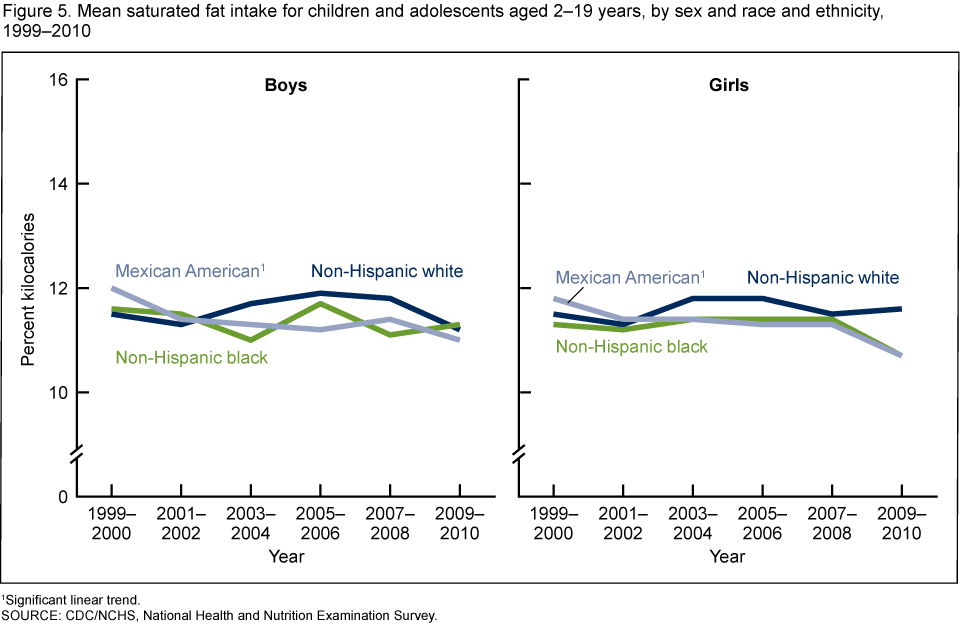
1Significant linear trend.
SOURCE: CDC/NCHS, National Health and Nutrition Examination Survey.
Summary
Among children and adolescents aged 2–19, the caloric intakes decreased for most age groups between 1999–2000 and 2009–2010. Trends in the protein, carbohydrate, and fat intakes were inconsistent. Protein intakes, expressed as a percentage of total kilocalories, increased for all boys and for all girls, and carbohydrate intakes, expressed on the same basis, decreased for all boys and for all girls. However, the observed trends for protein and carbohydrate intakes were not found for all racial and ethnic groups. The percentage of kilocalories from protein increased for all sex and racial and ethnic groups except for non-Hispanic black girls. The percentage of kilocalories from carbohydrate decreased for non-Hispanic white boys and girls and for non-Hispanic black boys, but there was no trend for the other sex and racial and ethnic groups. The only trend in fat intakes was a decrease in saturated fat intakes of Mexican-American boys and girls.
The percentage of calories from protein, carbohydrate, and fat were within the ranges recommended for these macronutrients for this age group (3), but the percentage of calories from saturated fat was above the 10% recommended in the Dietary Guidelines for Americans, 2010 (4). In 2009–2010, on average, U.S. children and adolescents consumed between 11% and 12% of kilocalories from saturated fat.
Definitions
Calories compared with kilocalories: A calorie is a measure of the energy produced as foods or beverages are burned for energy in the body. The term calorie is usually used when discussing energy from food and beverages, but the calorie being referred to here is actually a kilocalorie (kcal) (5). In this report, the term calorie and kilocalorie are used interchangeably, both referring to the same measure of energy.
Energy intakes: Total energy intake is the sum of energy from protein, carbohydrate, total fat, and alcohol. Because children and adolescents consumed less than 1% of their calories from alcohol, it was not included in the calculation of average energy intakes in this report. Average energy intakes presented here are the sum of energy from protein, carbohydrate, and total fat.
Calculation of percentage of kcals from macronutrients: Intakes of macronutrients are expressed as a percentage of total energy intakes. Macronutrient intakes are reported in grams on the data files. The following standard conversion factors were used to convert grams of macronutrients to kcals: 4 kcals/gram for protein and carbohydrate, and 9 kcals/gram for total fat and saturated fat. The percentages of kilocalories from macronutrients were then calculated by dividing the total caloric intake from each of the macronutrients by the total daily caloric intake and multiplying this faction by 100.
Total fat: Includes all forms of fat—saturated, polyunsaturated, and monounsaturated.
Data source and methods
Data from the National Health and Nutrition Examination Survey (NHANES) were used for these analyses. NHANES is a cross-sectional survey designed to monitor the health and nutritional status of the civilian, noninstitutionalized U.S. population (6). The survey consists of interviews conducted in participants’ homes, standardized physical examinations in mobile examination centers (MEC), and laboratory tests utilizing blood and urine specimens provided by participants during the physical examination. Information on nutrient intake was obtained from one 24-hour dietary recall interview administered in-person in the MEC. Dietary recalls cover intake for any given day, specifically the 24-hour period prior to the dietary recall interview (midnight to midnight).
The NHANES sample is selected through a complex, multistage design that includes selection of primary sampling units (counties), household segments within the counties, households within segments and, finally, sample persons from selected households. The sample design includes oversampling to obtain reliable estimates of health and nutritional measures for population subgroups. In 1999, NHANES became a continuous survey, fielded on an ongoing basis. Each year of data collection is based on a representative sample covering all ages of the civilian, noninstitutionalized population. Public-use data files are released in 2-year cycles.
The Day 1 dietary recall sample weights—which account for the differential probabilities of selection, nonresponse, and noncoverage and additionally, day of the week of dietary recall and nonresponse to the dietary interview—were incorporated into the estimation process. Statistical analyses were conducted using the SAS System for Windows (release 9.2; SAS Institute Inc., Cary, N.C.) and SUDAAN (release 10.0; RTI International, Research Triangle Park, N.C.).
Statistical tests for linear trends over the six 2-year NHANES data collection cycles were performed using polynomial orthogonal contrasts in SUDAAN. The significance level was set at p < 0.05. All differences reported are statistically significant unless otherwise indicated.
About the authors
R. Bethene Ervin and Cynthia L. Ogden are with the Centers for Disease Control and Prevention’s National Center for Health Statistics, Division of Health and Nutrition Examination Surveys.
References
- Ogden CL, Carroll MD, Kit BK, Flegal KM. Prevalence of obesity and trends in body mass index among US children and adolescents, 1999–2010. JAMA 307(5):483–90. 2012.
- Wright JD, Wang C-Y. Trends in intake of energy and macronutrients in adults from 1999–2000 through 2007–2008. NCHS data brief, no 49. Hyattsville, MD: National Center for Health Statistics. 2010.
- Institute of Medicine. Dietary Reference Intakes for Energy, Carbohydrate, Fiber, Fat, Fatty Acids, Cholesterol, Protein, and Amino Acids. Washington, DC: The National Academy Press. 2002.
- U.S. Department of Agriculture and U.S. Department of Health and Human Services. Dietary Guidelines for Americans, 2010. 7th Edition. Washington, DC: U.S. Government Printing Office. 2010.
- Krause MV, Mahan LK (editors). Energy. In: Food, Nutrition, & Diet Therapy. 7th ed: 9–23. Philadelphia, PA: WB Saunders Company. 1984.
- National Center for Health Statistics. National Health and Nutrition Examination Survey. Questionnaires, datasets, and related documentation.
Suggested citation
Ervin RB, Ogden CL. Trends in intake of energy and macronutrients in children and adolescents from 1999–2000 through 2009–2010. NCHS data brief, no 113. Hyattsville, MD: National Center for Health Statistics. 2013.
Copyright information
All material appearing in this report is in the public domain and may be reproduced or copied without permission; citation as to source, however, is appreciated.
National Center for Health Statistics
Edward J. Sondik, Ph.D., Director
Jennifer H. Madans, Ph.D., Associate Director for Science
Division of Health and Nutrition Examination Surveys
Rosemarie Hirsch, M.D., Acting Division Director