Healthy People 2010
Progress Review Focus Area 23 – Public Health Infrastructure Presentation
PowerPoint Presentation [PPT – 1 MB]
Slide 1
Focus Area 23:
Public Health Infrastructure
Progress Review
Richard J. Klein
National Center for Health Statistics
April 16, 2008
Slide 2
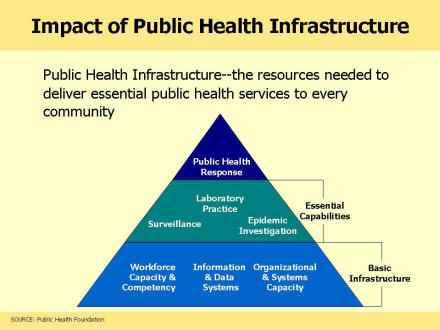
Impact of Public Health Infrastructure
Public Health Infrastructure–the resources needed to deliver essential public health services to every community
Pyramid-shaped graphic with Basic Infrastructure at base (with workforce capacity and competency, information and data systems, and organizational and system capacity) at base. Next level is essential capabilities (with surveillance, laboratory practice, and epidemic investigation) in the middle, and public health response at the peak of the pyramid.
Slide 3
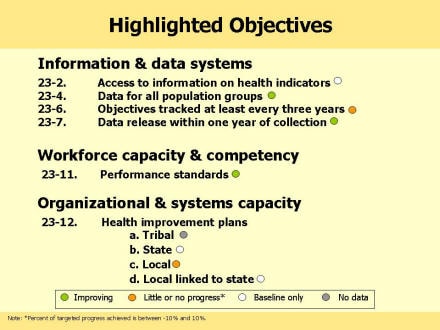
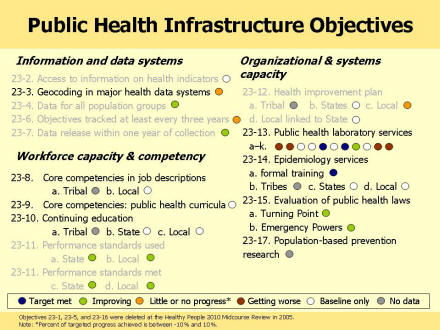
Highlighted objectives with colored dots indicating status.
Information and data systems
23-2 Access to information on health indicators, baseline only
23-4 data for all population groups, improving
23-6 objectives tracked at least every three years, little or no progress
23-7 data release within one year of collection, little or no progress
Workforce capacity & competency
23-11 performance standards, improving
Organizational & systems capacity
23-12 health improvement plans
Tribal, no data
State, baseline only
Local, little or no progress
Local linked to State, baseline only
Slide 4
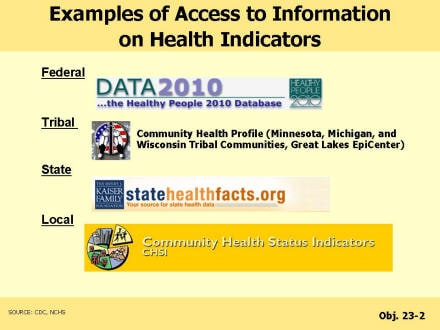
Examples of Access to Information on Health Indicators
Logos associated with web sites for federal, tribal, state, and local health indicator data.
Slide 5
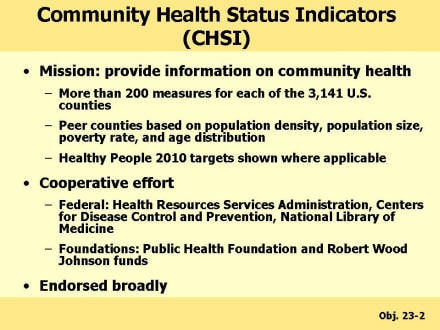
Community Health Status Indicators (CHSI)
- Mission: provide information on community health
- More than 200 measures for each of the 3,141 U.S. counties
- Peer counties based on population density, population size, poverty rate, and age distribution
- Healthy People 2010 targets shown where applicable
- Cooperative effort
- Federal: Health Resources Services Administration, Centers for Disease Control and Prevention, National Library of Medicine
- Foundations: Public Health Foundation and Robert Wood Johnson funds
- Endorsed broadly
Slide 6
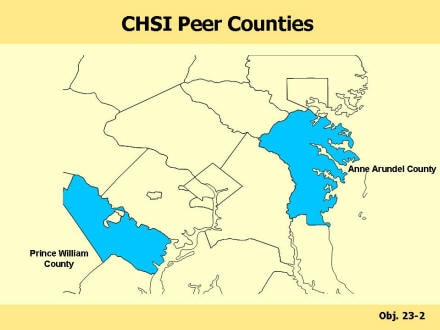
CHSI Peer Counties
Map showing counties in the DC area, with Anne Arundel County, MD and Prince William County, VA, highlighted.
Slide 7
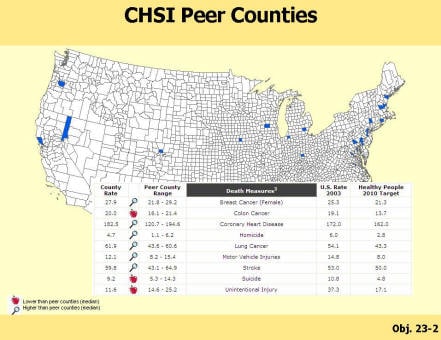
CHSI Peer Counties
U.S. map with peer counties (of Anne Arundel Co, MD) in blue, with graphic showing selected causes of death for Anne Arundel, its peers, the US rate, and the Healthy People target.
Slide 8
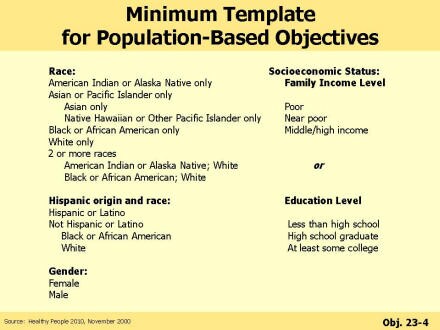
Minimum Template for Population-Based Objectives
Race: American Indian or Alaska Native only
Asian or Pacific Islander only
Asian only
Native Hawaiian or Other Pacific Islander only
Black or African American only
White only
2 or more races
American Indian or Alaska Native; White
Black or African American; White
Hispanic origin and race:
Hispanic or Latino
Not Hispanic or Latino
Black or African American
White
Gender:
Female
Male
Socioeconomic Status:
Family Income Level
Poor
Near poor
Middle/high income
or
Education Level
Less than high school
High school graduate
At least some college
Slide 9
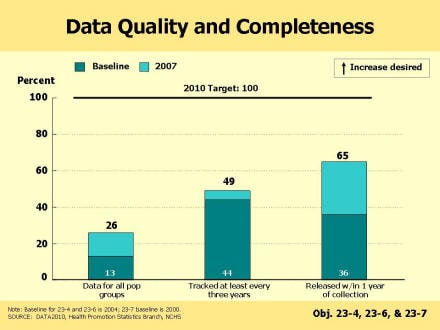
Data Quality and Completeness
Bar graph showing increase for three measures related to data quality and completeness — data for all pop groups, objectives tracked at least every three years, and data released within one year of data collection.
Slide 10
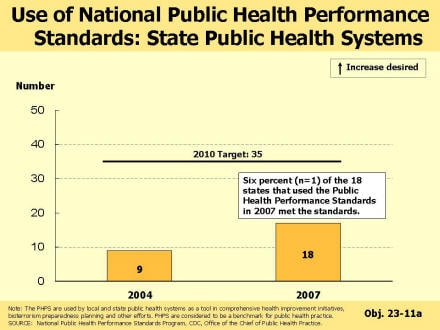
Use of National Public Health Performance Standards: State Public Health Systems
Bar chart showing nine states using National Public Health Performance Standards in 2004 and 18 in 2007.
Slide 11
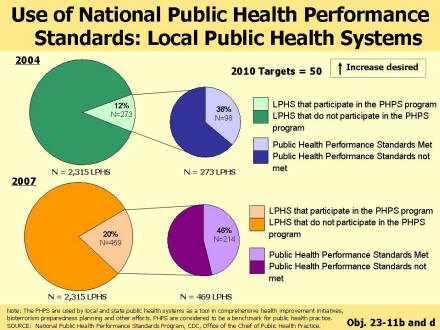
Use of National Public Health Performance Standards: Local Public Health Systems
Pie charts showing 12% of Local Public Health Systems participating in the PHPS program, and 36% of those meeting the PHPS in 2004. For 2007, 20% of LPHS participating, 46% of those meeting.
Slide 12
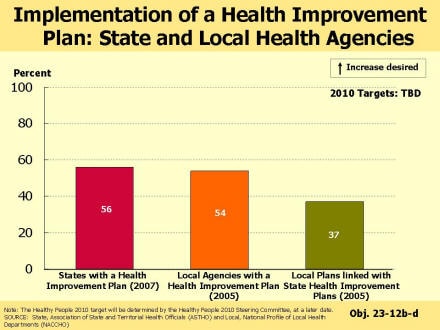
Implementation of a Health Improvement Plan: State and Local Health Agencies
Bar chart showing 56% of States have a Health Improvement in 2007, 54% of Local agencies have a Health Improvement Plan, and 37% have local plans linked with the State Health Improvement plan.
Slide 13
Graphic showing the status of the non-highlighted PHI objectives.
Slide 14
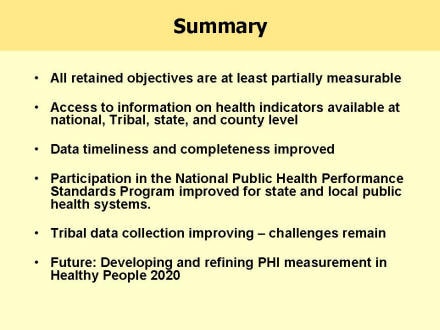
Summary
- All retained objectives are at least partially measurable
- Access to information on health indicators available at national, Tribal, state, and county level
- Data timeliness and completeness improved
- Participation in the National Public Health Performance Standards Program improved for state and local public health systems.
- Tribal data collection improving – challenges remain
- Future: Developing and refining PHI measurement in Healthy People 2020
Slide 15
Acknowledgements
Tamyra Carroll Garcia
Public Health Analyst
CDC/National Center for Health Statistics
tuc6@cdc.gov
Susan Schneider
Public Health Analyst
CDC/National Center for Health Statistics
sah4@cdc.gov
Contributors: Nakki Price, CDC/OCPHP
Beverly Smith, HRSA
Liza Corso, CDC/OCPHP
Christopher Barrett, HHS/ODPHP
Joan Cioffi, CDC/OWCD
Ellis Davis, HHS/ODPHP
Elizabeth Jackson, CDC/NCHS
Jeff Pearcy, CDC/NCHS
Slide 16
Progress review data and slides are available on the web at the Healthy People website.