Healthy People 2010
Progress Review Focus Area 21 – Oral Health Presentation
PowerPoint Presentation [PPT – 1.9 MB]
Slide 1
Welcome to the progress review of focus area 21 Oral Health. Presented by Richard J. Klein of the National Center for Health Statistics on February 7, 2008. The National Institute of Health, Health Resources and Services Administration, Centers for Disease Control and Prevention and Indian Health Service are the four lead agencies for this focus area.
Slide 2
According to the 2000 Surgeon General’s Report on Oral Health, oral health is essential to the general health and well-being of all Americans. Dental caries is the most common chronic disease in children. Despite increases in coverage, nearly 3 times as many children lacked dental insurance compared to those lacking medical insurance in both 1995 and 2003-04. Americans without dental insurance are more likely to have unmet dental needs compared to those with insurance.
Slide 3
Highlighted Objectives
- 21-1a-c Dental Caries Experience
- 21-1a: getting worse
- 21-1b: little or no progress
- 21-1c: little or no progress
- 21-4 Complete Tooth Loss: little or no progress
- 21-5b Destructive Periodontal Disease: improving
- 21-8a Dental Sealants, Children 8 years: little or no progress
- 21-9 Community Water Fluoridation: improving
- 21-10 Annual Dental Visits: little or no progress
- 21-12 Preventive Dental Services Among Low-Income youth: improving
- 21-14 Community Health Centers with Oral Health Service Component: improving
- 21-17a, b Dental Public Health Infrastructure
- 21-17a: target met
- 21-17b: target met
Slide 4
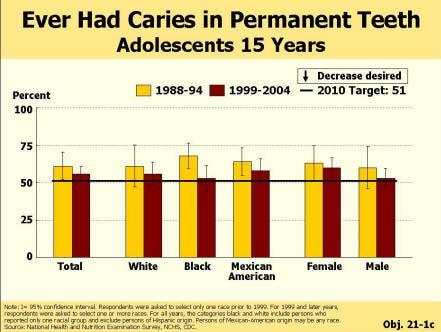
Ever Had Caries in Permanent Teeth:
Adolescents 15 Years of age
Caries in children 15 years of age has declined and moved toward the target.
Slide 5
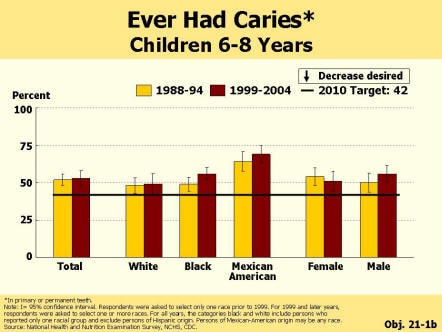
Ever Had Caries in Primary or Permanent Teeth:
Children 6-8 Years of Age
Prevalence of dental caries in 6-8 years hasn’t changed since the baseline.
Slide 6
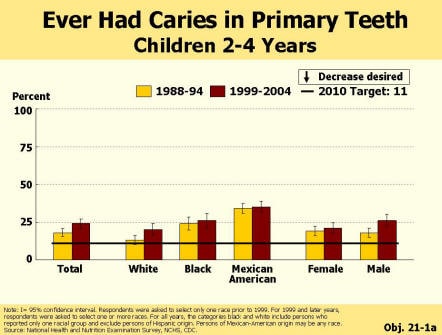
Ever Had Caries in Primary Teeth: Children 2-4 Years of Age
Severe Early Childhood Caries is a serious, destructive presentation of dental decay that often involves multiple teeth, including front teeth. Left untreated, this decay can cause pain and impact a child’s ability to chew and speak properly. Treatment for advance cases involves general anesthesia in the operating room, incurring both risk to patient and high economic cost. Compared to older children, caries in preschool children increased significantly in the past decade. This could be a bellwether for future increase in caries affected by changes in diet or food consumption pattern.
Slide 7
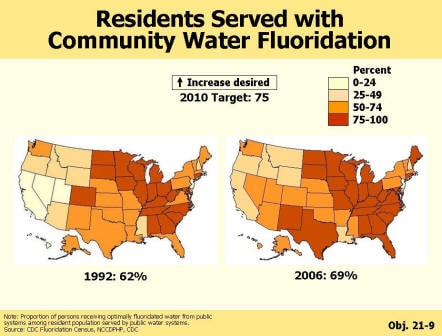
Residents Served with Community Water Fluoridation
Water fluoridation has increased from 62% in 1992 to 69% in 2006, and a greater percentage of Americans are served by fluoridated water systems. Increase in bottled water consumption in recent years, however, may offset potential protection from fluoridated tap water.
Slide 8
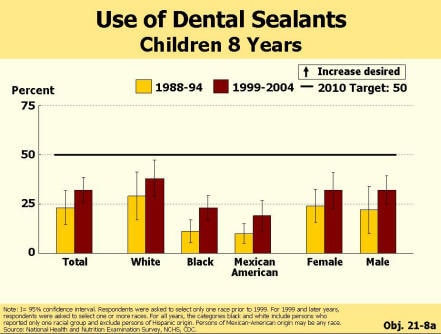
Use of Dental Sealants: Children 8 Years of Age
Dental sealant (also called a pit and fissure sealant) is a professionally-applied plastic-like material that is put on the chewing surfaces of back teeth to prevent cavities. Sealants provide a physical barrier and effectively protect the pits and fissures on the biting surfaces of teeth from dental decay. Although still below the target, there has been an increase in sealants for all race/ethnic groups. Fewer Black and Mexican American children had sealants than white children.
Slide 9
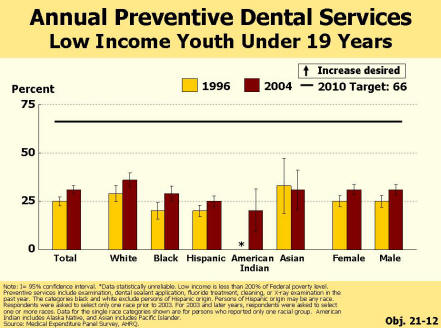
Annual Preventive Dental Services:
Low Income Youth Under 19 Years of Age
Preventive services are defined as a check-up. X-ray, fluoride treatment, cleaning, or sealant application. More low income children are getting preventive dental services. In 1996, 25% of low income children received a preventive dental service. This has increased to 31% in 8 years, making some progress towards the target of 66%. This increase could be attributable to positive changes from 1996 to 2000 in the dental Medicaid program and SCHIP for low-income children.
Slide 10
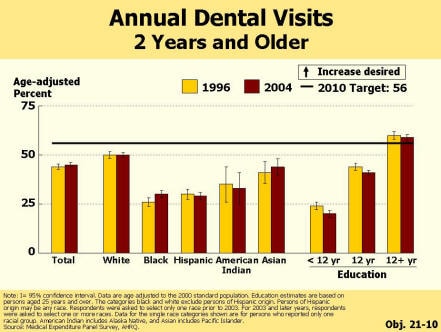
Annual Dental Visits: 2 Years of age and Older
Proportion of persons who visit dentists hasn’t changed much between 1996 and 2004. Minority population subgroups have consistently lower rate of dental visits than White. Compared to less educated adults, significantly higher proportion of adults with some college education or more had annual dental visits, and met the target of 56%.
Slide 11
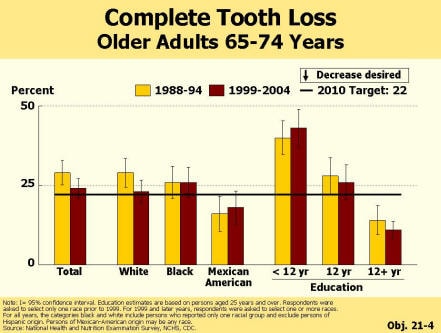
Complete Tooth Loss: Older Adults 65-74 Years of Age
Complete tooth loss is often considered a good indicator of overall health in older adults. Complete tooth loss is also a good indicator of how resources are allocated in dental care. At baseline, about 30% of adults had complete tooth loss. Mexican Americans had the lowest rate of complete tooth loss meeting the target of 22%. This, however, could be explained by limited access to dental care and personal choice to defer treatment needs among Mexican Americans; as well as lower rates of periodontal disease among Mexican Americans compared to other race/ethnic minority groups. This slide shows significant disparity in complete tooth loss by education level. Adults with some college education had the lowest rate and met the target of 22%.
Slide 12
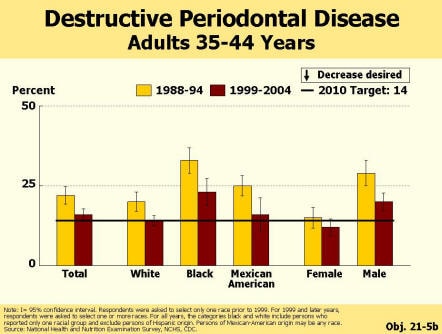
Destructive Periodontal Disease: Adults 35-44 Years of Age
Destructive periodontal disease is defined as the loss of attachment greater than or equal to 4mm in one or more periodontal sites. Significant reductions in periodontal disease are noted for all race and ethnic groups. Please note that Mexican Americans had a lower rate than Black and comparable to White in 1999-2004 which might explain Mexican American’s lower rate of complete tooth loss presented earlier. White and female met the target of 14% in 1999-2004.
Slide 13
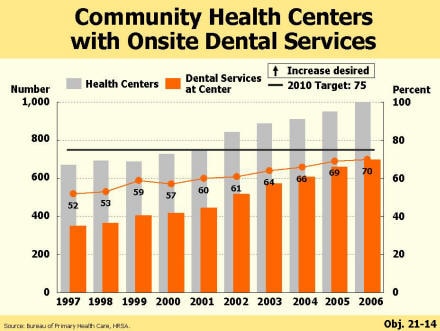
Community Health Centers with Onsite Dental Services
Local health departments and community- based health centers serve groups that traditionally have limited access to dental services; minorities, persons with low income and persons living in rural areas, and the number has steadily increased from 1997 to 2006. The number of such local health department and community based health centers that offer on-site oral health services also grew. The proportion of community health centers with on-site dental program has grown from 52% in 1997 to 70% in 2006.
Slide 14
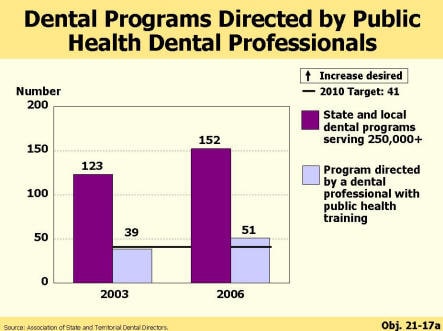
Dental Programs Directed by Public Health Dental Professionals
State and local health agencies that serve 250,000+ and have dental programs also grew from 123 in 2003 to 152 in 2006. The number of dental directors with public health training also grew proportionate to the growth in the dental programs, meeting the target of 41 in 2006.
Slide 15
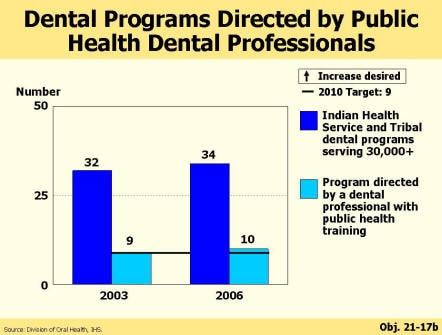
Tribal Dental Programs Directed by Public Health Dental Professionals
The number of dental programs in Indian Health Service and Tribal dental programs serving 30,000+ also grew from 32 in 2003 to 34 in 2006. The number of dental directors with public health training also grew proportionate to the growth in the dental programs from 9 in 2003 to 10 in 2006, and met its target.
Slide 16
Progress Toward 2010 Targets
In addition to the objectives highlighted today, a couple other objectives showed significant progress toward 2010 targets.
Dental caries and untreated dental decay among adolescents 15 years of age and use of dental sealants improved, although the improvements were not statistically significant. Dental caries in preschool children moved away from the 2010 target. Several objectives lacked tracking data and their progress could not be evaluated
Target Met
- Objective 21-17a State and local dental programs
- Objective 21-17b Indian Health Service and Tribal dental programs
Moved Toward Target
- Objective 21-3 No permanent tooth loss, 35-44 years of age
- Objective 21-5b Destructive periodontal disease, 35-44 years of age
- Objective 21-9 Community water fluoridation
- Objective 21-12 Preventive dental services among low-income youth under 19 years of age
- Objective 21-14 Community health centers with oral health service component
- Objective 21-15 Cleft lip or palate referral
Little or No Progress
- Objective 21-1b Dental caries, 6–8 years of age
- Objective 21-1c Dental caries, 15 years of age
- Objective 21-2a-d Untreated dental decay, 2-4, 6-8, 15 and 35-44 years of age
- Objective 21-4 Complete tooth loss, 65-74 years of age
- Objective 21-6 Early detection of oral and pharyngeal cancers
- Objective 21-8a Dental sealants, 8 years of age
- Objective 21-8b Dental sealants, 14 years of age
- Objective 21-10 Dental visits, 2+ years of age
Moved Away from Target
- Objective 21-1a Dental caries, 2-4 years of age
Baseline Only
- Objective 21-5a Gingivitis, 35-44 years of age
- Objective 21-7 Annual exam for oral and pharyngeal cancers, 40+ years of age
- Objective 21-11 Use of oral health care by long-term care residents
- Objective 21-13a,b School-based health centers with oral health component
- Objective 21-16 Oral and craniofacial state-based surveillance
Slide 17
Summary
Most oral health objectives moved toward their 2010 targets, although some of the improvements were not statistically significant. Please note that these improvements would have been statistically significant if the age ranges were wider for these objectives than current. Small sample size rendered otherwise significant improvements statistically unreliable.
Dental caries in preschool children moved away from the 2010 target. Dental caries in preschool children moved away from the 2010 target. This could be an indication of a possible cohort effect reflective of unhealthy eating choices and reduce attention of child caregivers towards good oral hygiene practices including optimal fluoride exposure through toothbrushing and fluoridated water.
Use of dental sealants among children increased (again, although some of the improvements were not statistically significant due to small sample sizes).
Oral health continues to improve in the adult population.
Disparities by race/ethnicity and education persist for many objectives
Slide 18
Acknowledgements
Thanks to:
Jay Anderson, HRSA
Laurie Barker, CDC
Patrick Blahut, IHS
Bruce Dye, CDC
Tim Iafolla, NIDCR
Gina Thornton-Evans, CDC
All a part of the FA21 Interagency Workgroup.
And thanks to Christopher Barrett of the Office of Disease Prevention and Health Promotion
Slide 19
Progress review data and slides can be found on the NCHS website at the Health People website.