Healthy People 2000 Progress Review
Violent and Abusive Behavior
Date: October 6, 1999
Time: 2-4 p.m. EST
This progress review will be broadcast on the Public Health Training Network. Details on how to view the broadcast are provided on CDC’s National Center for Injury Prevention and Control’s home page.
Dr. David Satcher, Assistant Secretary for Health and Surgeon General will be joined by a panel of experts representing the public and private health sectors, as well as representatives of the criminal justice system to discuss the topic of violence and abusive behavior. Dr. Rodney Hammond, Director of the Division of Violence Prevention at the National Center for Injury Prevention and Control and Dr. Edward Sondik, Director of the National Center for Health Statistics will review the progress of the objective in the Violence and Abusive Behavior priority area in Healthy People 2000. The participants will focus on the following topics:
- General Discussion of Violence and Abusive Behavior
- Homicide
- Family and Intimate Partner Violence
- Suicide
- Youth Violence
Data Section
Presentation
Dr. Edward Sondik
Director, National Center for Health Statistics
Thank you, Dr. Satcher. Today we are here to present data on some of the most disturbing of public health issues – behaviors that are violent and abusive. This includes homicide, suicide, assault, rape and child abuse. There is much encouraging news to report, but at the same time much work remains to be accomplished. In this first section, I will highlight overall findings on violence and abusive behaviors, with detailed data on homicide, rape, and partner abuse, and child abuse. Later in the program I will present data on suicide, adolescent and school violence.
Let’s begin by looking at the overall statistics. In 1997, there were almost 20,000 homicides in this country and over 30,000 suicides. That means that in 1997, an average of more than 50 people were killed each day and almost 80 committed suicide. Also in 1997, over 2 million assaults occurred where people were injured. More than 175,000 women were victims of rape or attempted rape.
NCHS’s 1998 preliminary data were released just yesterday. They suggest that the country has met the Healthy People 2000 targets for homicide, suicide, and firearm deaths. Over the decade, the homicide rate has dropped by 30 percent, suicide by 14 percent and the firearm death rate by 25 percent. The declines in homicide and firearm deaths began in 1994 and they continue, while the decline for suicide has been gradual over the entire period.
Looking at trends in homicide – encouraging news. Overall rates have shown a downturn since mid-decade and we have surpassed the year 2000 target. So although homicides dominate the news, we are making progress.
Homicide rates vary greatly by race and ethnicity. Blacks are disproportionately victims of homicide. Their rates are almost 6 times those of whites and Asians and Pacific Islanders.
Homicide is the second leading cause of death among adolescents and young adults 15-34 years. When targets were set for Healthy People 2000 priorities, these three groups – black females, black males, and Hispanic males – were included as special population sub-objectives because they are at higher risk. For all of these groups there has been progress from the peak mid-decade years. The target for black females – the blue line — has been met and the target for Hispanic males – the orange line – has almost been met. The rate for black males has declined sharply since 1993. Unfortunately, the rate for this group is still 10 times the homicide rate for Asian and Pacific Islander males. And, for that matter, the rate is still 30 percent above the target.
I don’t think it would surprise many to know that homicide rates vary widely across the country. Large core metropolitan counties have the highest rate s – 15 per 100,000 in 1995, which was about 2 to 3 times the rates of large suburbs and rural areas. More recent data on homicide rates in cities of 100,000 people or more indicate that some cities had no reported homicides in 1997, while others had rates as high as 60 to 80 per 100,000 population.
Let’s turn next to information on firearm deaths. As with homicide, the firearm death rate has declined since mid-decade and preliminary 1998 data indicate that the year 2000 target has been met. The rate for black persons has also shown a decline. It’s important to note that these data represent all deaths by firearms, including homicides, suicides and unintentional injuries. In 1997, firearms were used in almost 70 percent of homicides and almost 60 percent of suicides. We’re going to talk about suicides later, but, while I’m discussing firearms I should point out that half of all firearm deaths are suicides.
Firearm deaths are not evenly distributed across the country. On this map, the lowest rates are shown in green and are concentrated in New England and the Upper Mid-West. Highest rates – shown in shades of purple, are found in the Mountain States – which are primarily due to the high rates of suicide in that area – and in the South, which has high rates of homicide.
A number of states have enacted laws to require safe firearm storage. Currently 15 states have enacted such laws, however, no additional states have passed laws since mid-decade.
Violence against women is a very serious problem and, unfortunately, may not always be reported by the victim or adequately responded to once reported. Data collected through the Department of Justice National Crime Victimization Survey suggest a decline of 50 percent in rape and attempted rape, and…
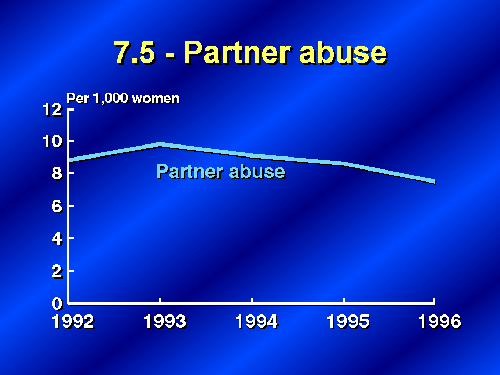
as we can see in this slide, a smaller decline of about 15 percent in partner abuse. In considering this apparent progress, we must realize that collecting these types of data pose a particularly difficult challenge. Surveys are conducted in the household where biases are likely, partially due to the potential threat of further abuse by others in the household. I am very pleased to report, however, that the Department of Justice and the Department of Health and Human Services have formed a long-term, joint effort to improve methods to measure violence against women.
The final area of concentration is child abuse. There were about 40 reports of child abuse and neglect for every 1,000 children and adolescents in 1993. Neglect is the largest component with significant contributions by physical abuse, emotional abuse, and sexual abuse. This is another complex issue to measure, and surveillance in this area is particularly difficult. We have evidence that the number of states with child death review teams is on the rise. As these teams become more successful, we may see increases in reporting due to improved surveillance.
To briefly summarize, of the six objectives discussed in this section, two – homicide and firearm deaths – have met their targets, and three have made progress. One, child abuse, unfortunately is moving away from the target. Many of the other objectives will be highlighted in the next section. Let me now turn the program back to Dr.Satcher.
SATCHER: Thank you, Ed, Dr. Hammond, will you highlight how we are responding to violence against women.
Thank you Dr. Satcher. This second section will focus on suicides, and also on violent and abusive behaviors among children and adolescents. As you’ve heard, suicide prevention is a major focus within the Department of Health and Human Services as witnessed by Dr. Satcher’s just published report ‘The Surgeon General’s Call to Action to Prevent Suicide, 1999.’ In fact, in the United States the rate of suicide is 50 percent higher than the homicide rate. Again, there is encouraging news to report on this objective – overall suicide rates have declined 14 percent during the past decade and, as with homicide, preliminary 1998 data indicate that the year 2000 target has been met.
Like homicide, rates for suicide vary significantly by race, although with a very different pattern. The White and American Indian and Alaskan Native populations have the highest suicide rates – in blue double the rates for the black and Asian and Pacific Islander populations. As I pointed out earlier, homicide rates – the red bars – are significantly higher for black people.
Turning next to suicide rates by age, suicide rates – in red – rise rapidly, first in adolescence and then again for older people. This contrasts with homicide rates which peak in early adulthood and then decline steadily.
The top line on this slide documents these high rates of suicide among older people, in this case , white men ages 65 and older. On the positive side, rates for this group have dropped considerably in the past few years. Trends for the two other targeted groups, adolescents and young men 20-34 years have shown some improvement. I also want to emphasize that firearms were involves with almost 60 percent of these suicides.
Suicide rates are clustered by area of the country. These rates tend to be lowest in New England, the Middle Atlantic and the Upper Mid-West. Rates are highest, in general, in the Mountain States and in the West.
Now, I want to focus on adolescents, including adolescent suicide and other forms of violence. To better understand and prevent adolescent suicide, we have collected and analyzed information on suicide thoughts and suicide attempts. CDC’s Youth Risk Behavior Survey, the YRBS, is a major source of these data. Through YRBS we’ve discovered that one out of 5 students in grades 9 through 12 – that’s one out of 5 – has seriously contemplated suicide in the past year. Almost 8 percent report attempting suicide and about a third of those attempts were serious enough to require medical treatment. Sadly, in 1997 more than 1,000 adolescents aged 14 to 17 years in this country ended their lives by suicide.
We do seem to be making progress in other areas of adolescent violence. Incidents of physical fighting, while not yet at target, are definitely heading in the right direction.
And the data also show that the incidence of weapon carrying in school is way down. Decreases for all adolescents and for Black students, a special sub-objective, have exceeded their targets.
On a closing note, the events that we’re talking about today are by no means rare. There were 30,000 suicides and 20,000 homicides in 1997. That’s 50,000 deaths and one-fifth of them, which is 10,000, occurred to our young people ages 15-34. Focusing on these young people, homicide and suicide represent more deaths than from any natural cause of death. Perhaps more than any other priority area, the issues involved in these deaths cut across so many parts of people’s lives, including health, economic, social, justice, education, and housing.
To summarize – in many areas we have made much progress over the decade. Of the 19 objectives, five have already met their targets – homicide, suicide and firearm deaths, as well as reductions in weapon carrying and the number of states with child death reviews. Five other objectives show progress. Another five, unfortunately, are moving away from the year 2000 targets, including assault injuries. And there are no data to update four objectives. So the challenge for the next decade is very clearly before us. Thank you very much.