Healthy People 2000 Progress Review
Unintentional Injuries
Date: August 5, 1999
Time: 2-4 p.m. EST
This progress review will be broadcast on the Public Health Training Network. Details on how to view the broadcast are provided on CDC’s National Center for Injury Prevention and Control’s home page.
Dr. David Satcher, Assistant Secretary for Health and Surgeon General, will be joined by a panel of experts representing the public and private health sectors. Dr. Mark Rosenberg, Director of the National Center for Injury Prevention and Control and Dr. Edward Sondik, Director of the National Center for Health Statistics will review the progress of the objectives in the Unintentional Injuries priority area of Health People 2000. The participants will engage in a discussion that focuses on:
- An overview of Unintentional Injuries
- Transportation-related injuries
- Home and Leisure injuries
Data Section
Presentation
Dr. Edward J. Sondik
Director, National Center for Health Statistics
Thank you, Dr. Satcher.
I am pleased to report that there is real progress in reducing unintentional injuries. Seven of the 26 separate objectives have met the year 2000 targets and 11 more have made substantial progress. But almost a third of the objectives have shown little or no progress and that means, as Dr. Rosenberg pointed out, we still have our work cut out for us. The magnitude of this problem is startling. Unintentional injuries caused almost 96,000 deaths in the United States in 1997, making injuries the 5th leading cause of death. Measured in years of potential life lost, the toll is almost as great for unintentional injuries as for heart disease–the Nation’s leading cause of death. In fact, because unintentional injuries affect both young and old, they account for 15 percent of all the potential years of life lost–far more than homicide, suicide, and HIV combined–which are among the leading causes of death for younger Americans.
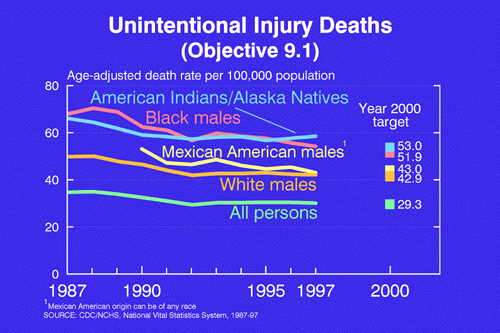
Looking at trends in death rates, there’s progress to report for each group identified at special risk in Healthy People 2000. While considerable disparities remain, each group shows significant progress and several have met or remain only slightly above the target.

While we often think of injuries as the killer of young people–and injuries are the leading cause of death for everyone under age 44–unintentional injury death rates are actually highest for those 65 and over. We’ll talk later about some of the reasons for the high rate among seniors.
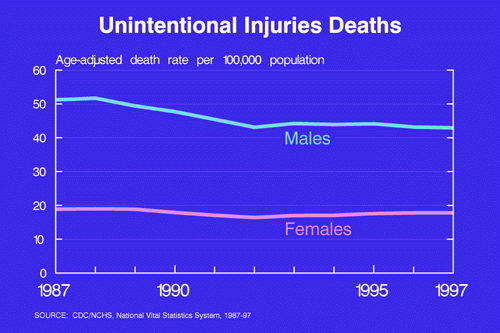
The next slide shows that the largest disparity in unintentional injury death rates is not race or ethnicity, but gender. The death rate for men is more than twice that for women. This difference holds true for injury deaths as a whole as well as for motor vehicle-related injuries, the topic we’ll now address in more detail.
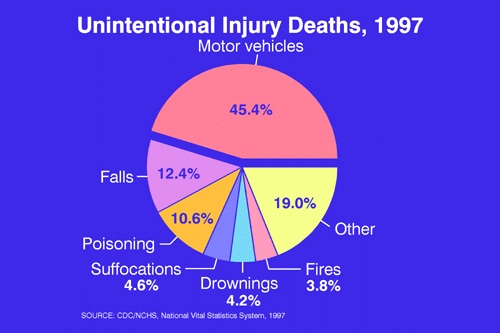
While the slide shows many causes of injury-related deaths, almost half are motor vehicle-related, as you can see in the top slice of this pie chart.
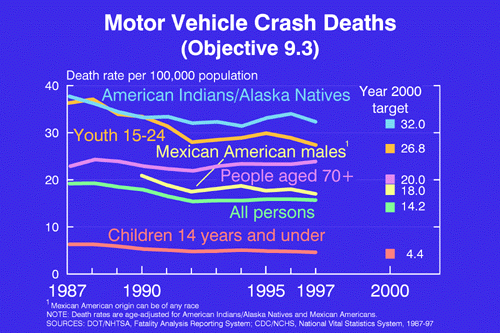
Overall, from 1987 to 1997, we’ve made progress in reducing the motor vehicle-related injury death rates for most of the groups identified early in Healthy People 2000 as being at greatest risk. From American Indian and Alaska Natives, to teens and young adults, to Mexican Americans, and to children–motor vehicle crash death rates are down. Only the rate for those 70 and over increased slightly. However, disparities still remain. Although American Indian and Alaska Natives have come within a fraction of their target, their rate remains highest.

Now let’s look at the impact of seat belts and alcohol on motor vehicle-related injuries. First, almost every state now has a law requiring seat belt use and
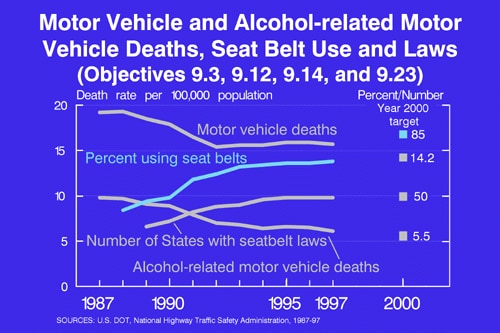
Secondly, with those laws, more of us are buckling up.
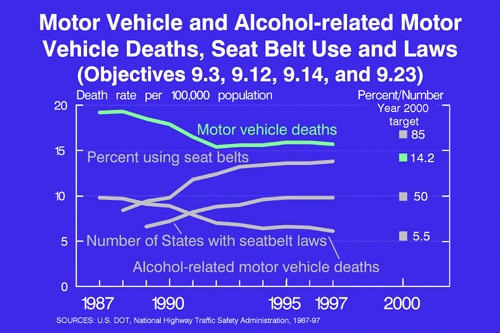
And third, over the past decade, we’ve seen motor vehicle death rates drop substantially–almost 20 percent–due in part to the increased use of seat belts and child restraint seats.

Fourth, the rate of alcohol-related motor vehicle deaths has almost been cut by almost 40 percent.
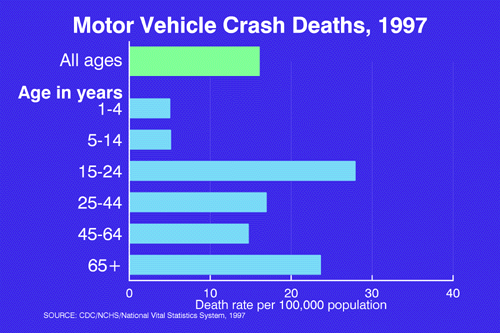
Looking at death rates by age, motor vehicle crash deaths are highest for teenagers and young adults, but rates are also high for those 65 and over and at every age 15 and above. Both drivers and young passengers are at risk, but clearly those first years of driving are uniquely hazardous.
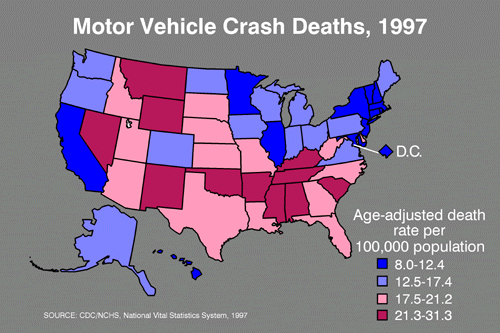
It’s always useful to step back from the national picture and look at the geographic pattern by State. Rates vary tremendously–with the highest rates (in red) almost four times the lowest rate, in blue. If we look at the factors which affect the frequency and severity of motor vehicle crashes, we’d see a wide range among States in road safety, driving distances, seat belt law enforcement and seat belt use, and drinking while driving.
We’ve just covered a great deal of information, but I’m sure that our discussion this afternoon can help us understand better the factors which have contributed to the progress these statistics document and how we can achieve even greater progress. Dr. Satcher.
Dr. Rosenberg speaks/panel discussion.
Dr. Sondik resumes.
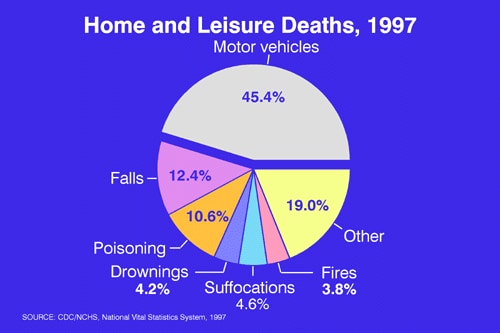
Thank you, Dr. Satcher. In 1997, there were 52,000 unintentional injury deaths that happened in the home or in places for leisure and recreation. Falls, drowning, fires, and poisoning each accounted for a substantial portion.
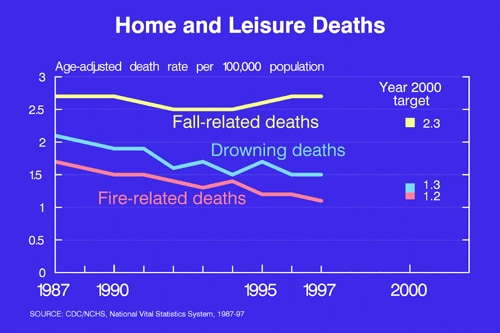
There’s been little change in fall-related deaths–that’s the top line–from 1987 to 1997, primarily because a dip in the rate a few years ago has been offset by rising rates in recent years. On the other hand, the death rate from drowning–the blue line–has declined and the fire-related death rate has met its target.
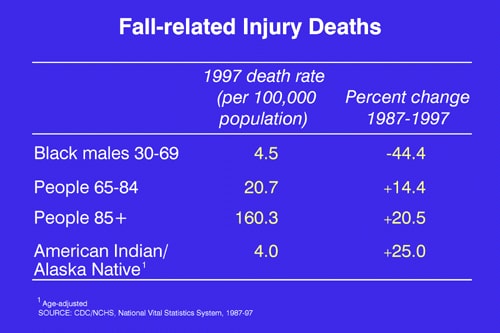
Falls happen most frequently and most seriously among the elderly, especially those 85 and over. The death rate for the oldest old is almost 8 times the rate for those 65 to 84. The rate has increased by almost 21 percent over the past decade for the 85-and-over-group and is up for the next oldest group and for American Indian/Alaska Natives as well. Only for black men, ages 30-69 years, has the rate dropped.
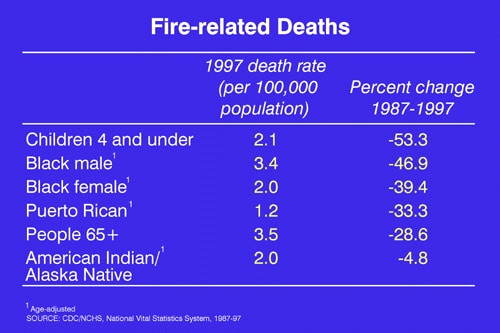
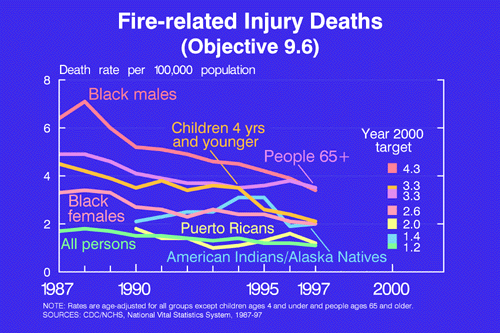
There’s been more success in preventing fire-related deaths. The death rate for young children has been cut in half. And for most almost all of the other groups who were identified in 1990 as being at higher risk, there has also been remarkable success with rates down on
average by about a third.
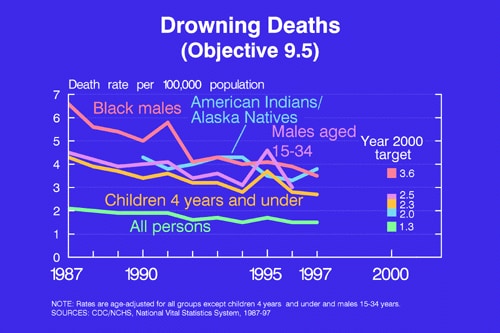
There’s also impressive progress to report in reducing drowning deaths. The overall rate declined by about 30 percent over the past decade. Rates for men have dropped by a third and the rate for black men has reached its target.
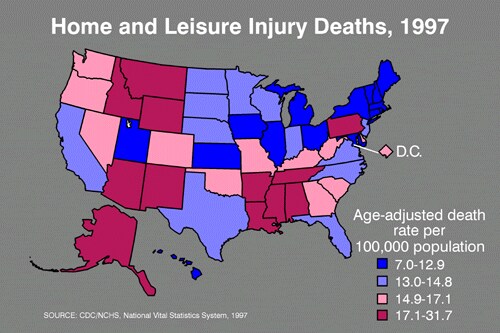
As we’ve seen with motor vehicle-related injury deaths, there are wide differences among States in the death rate from home and leisure injuries. The rate ranges from a low of 12.2 per 100,000 population in Maine to a high of 31.7 in Alaska, which by the way is over Baja California on our map.
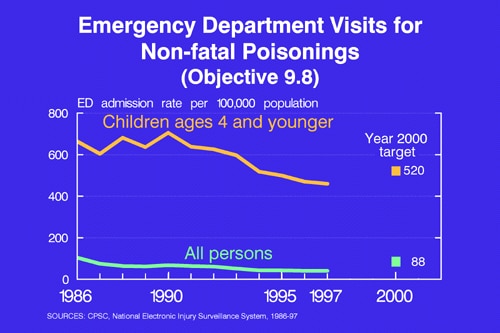
Certainly death rates are not the only measure of a problem or the scope of exposure to dangerous substances or situations. In 1997, just under a half-million children were seen in emergency rooms for non-fatal poisonings, down from a high of almost 700,000 in 1987 and well below the year 2000 target. Along with the decline in motor vehicle deaths for youngsters and the reduced risk to pre-schoolers from drowning and fires, these findings on poisoning mean that American children are growing up in an environment safer than ever before but one which still presents challenges to parents and to all of us in public health.
As in all components of Healthy People, data have played an important role in meeting the challenges in injury prevention and intervention for all ages and for all causes of injury. I believe this brief summary of injury mortality and incidence has pointed to important differences by age, sex, race, ethnicity, and geography. In turn, rather than adding a measure of complexity of the analysis, understanding these differences and patterns can lead both to innovative approaches to prevent injuries and insightful ways to measure our success. Thank you, Dr. Satcher.