Quarterly Estimates of Directly Purchased Private Health Insurance Among Persons Under Age 65: United States, 2011–2013
by Emily P. Zammitti, M.P.H., and Robin A. Cohen, Ph.D., Division of Health Interview Statistics
PDF Version (253 KB)
Previously published data have shown seasonal variation in the percentage of persons under age 65 enrolled in health insurance plans acquired through a health insurance marketplace (1). In 2014 and 2015, there was an increase in the percentage of persons with coverage acquired through the marketplace at the beginning of the calendar year, immediately following the open enrollment period, and there was a decrease in marketplace plans during the last quarter of the year (1). Quarterly effectuated enrollment estimates (percentage of people who have paid their premiums and still have an active policy) for 2015, published by the Centers for Medicare & Medicaid Services, demonstrate a similar trend (2–5). It is unknown whether this seasonal variation is unique to coverage acquired through a marketplace, or whether this seasonality also existed for directly purchased private health insurance prior to the availability of marketplace coverage beginning in 2014.
This report provides quarterly estimates of directly purchased private health insurance by various sociodemographic characteristics, using data from the 2011–2013 National Health Interview Survey (NHIS). Private health insurance that was originally obtained through direct purchase or other means not related to employment was considered directly purchased coverage.
While there were quarterly fluctuations in the percentage of persons with directly purchased coverage between 2011 and 2013, on average, this variation did not occur in a regular or annual pattern (Table and Figure). Overall, the percentage of persons under age 65 with directly purchased coverage decreased from quarter 1 of 2011 (6.5%) through quarter 3 of 2012 (5.3%), after which it remained stable until the end of 2013. However, during this time, there were no significant quarter-to-quarter changes to the overall rate.
Among not-poor persons, there was a significant decrease in the percentage who had directly purchased coverage from quarter 3 (8.0%) to quarter 4 (6.7%) of 2011. However, this did not occur among any other poverty classifications (Figure). There was a significant decrease in the percentage of poor persons with directly purchased coverage from quarter 2 to quarter 3 of 2012, with a subsequent significant increase from quarter 3 to quarter 4. This shift occurred only once, does not fit the pattern in exchange coverage described above, and did not occur for any other poverty classifications. Additionally, none of the poverty groups had a significant change in the percentage with directly purchased coverage between quarter 4 of 2011 and quarter 1 of 2012, nor between quarter 4 of 2012 and quarter 1 of 2013.
NHIS is a multipurpose health survey based on household interviews of a sample of the civilian noninstitutionalized U.S. population. It is conducted continuously throughout the year by the National Center for Health Statistics. Analyses were based on data for 313,598 persons. Estimates were calculated using SUDAAN software (6) to account for the complex sample design. Estimates were compared using two-tailed significance tests at the 0.05 level, with no adjustment for multiple comparisons. Visit the NHIS website for more information.
References
- Cohen RA, Zammitti EP. Tables 1–8. Health insurance coverage: Early release of estimates from the National Health Interview Survey, 2016 [PDF – 407 KB] National Center for Health Statistics. September 2016.
- Centers for Medicare & Medicaid Services. March 31, 2015 effectuated enrollment snapshot. June 2015.
- Centers for Medicare & Medicaid Services. June 30, 2015 effectuated enrollment snapshot. September 2015.
- Centers for Medicare & Medicaid Services. September 30, 2015 effectuated enrollment snapshot. December 2015.
- Centers for Medicare & Medicaid Services. December 31, 2015 effectuated enrollment snapshot. March 2016.
- RTI International. SUDAAN (Release 11.0.1) [computer software]. 2013.
Suggested citation: Zammitti EP, Cohen RA. Quarterly estimates of directly purchased private health insurance among persons under age 65: United States, 2011–2013. NCHS health e-stats. 2016.
Figure. Persons under age 65 who had directly purchased private health insurance, by poverty level, year, and quarter: United States, 2011–2013
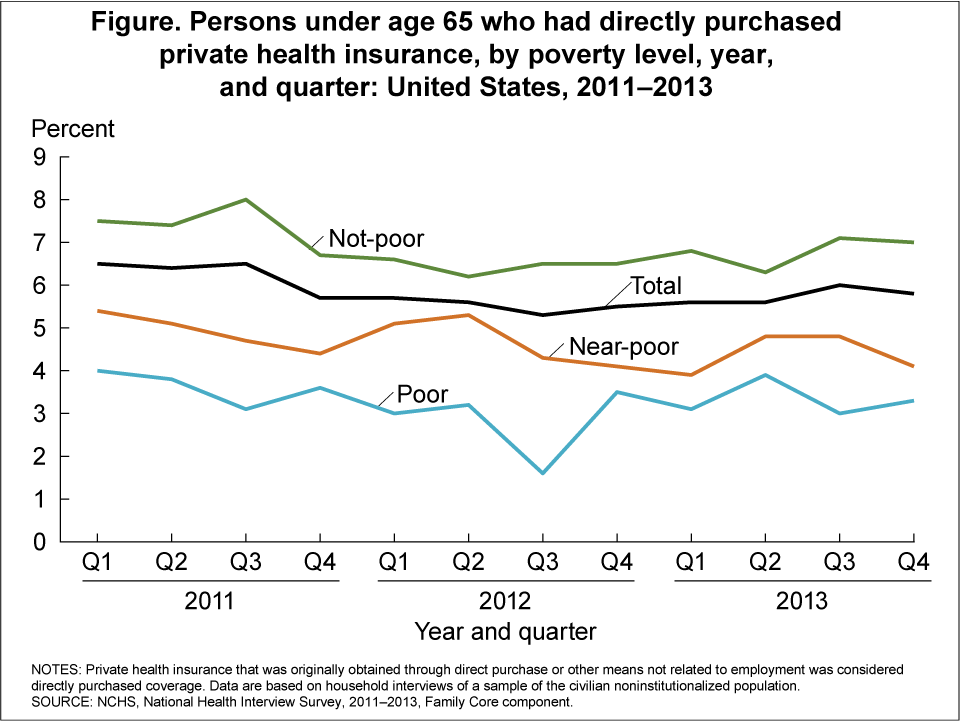
NOTES: Private health insurance that was originally obtained through direct purchase or other means not related to employment was considered directly purchased coverage. Data are based on household interviews of a sample of the civilian noninstitutionalized population.
SOURCE: NCHS, National Health Interview Survey, 2011–2013, Family Core component.
Table
| Characteristic | 2011 | 2012 | 2013 | ||||||||||
|---|---|---|---|---|---|---|---|---|---|---|---|---|---|
| Q1 | Q2 | Q3 | Q4 | Q1 | Q2 | Q3 | Q4 | Q1 | Q2 | Q3 | Q4 | ||
| Total | 6.5 (0.34) | 6.4 (0.32) | 6.5 (0.35) | 5.7 (0.28) | 5.7 (0.30) | 5.6 (0.30) | 5.3 (0.29) | 5.5 (0.29) | 5.6 (0.33) | 5.6 (0.30) | 6.0 (0.39) | 5.8 (0.30) | |
| Age group | 0–17 | 4.8 (0.49) | 4.4 (0.46) | 5.2 (0.55) | 3.3 (0.38) | 3.5 (0.37) | 4.1 (0.41) | 3.9 (0.44) | 3.9 (0.42) | 4.3 (0.46) | 3.7 (0.39) | 4.4 (0.50) | 4.6 (0.51) |
| 18–64 | 7.1 (0.35) | 7.1 (0.33) | 7.0 (0.36) | 6.7 (0.30) | 6.5 (0.33) | 6.1 (0.32) | 5.8 (0.29) | 6.1 (0.30) | 6.1 (0.34) | 6.4 (0.33) | 6.6 (0.41) | 6.3 (0.30) | |
| 0–18 | 4.8 (0.48) | 4.5 (0.44) | 5.3 (0.54) | 3.3 (0.37) | 3.7 (0.37) | 4.2 (0.40) | 4.0 (0.43) | 3.9 (0.40) | 4.3 (0.46) | 4.0 (0.39) | 4.5 (0.51) | 4.7 (0.50) | |
| 19–25 | 7.6 (0.81) | 7.3 (0.80) | 7.9 (0.88) | 6.2 (0.67) | 6.9 (0.80) | 6.3 (0.73) | 5.2 (0.58) | 5.2 (0.61) | 5.9 (0.64) | 6.4 (0.95) | 7.3 (0.82) | 5.9 (0.59) | |
| 26–34 | 7.4 (0.68) | 6.2 (0.57) | 6.4 (0.54) | 6.3 (0.67) | 5.5 (0.55) | 5.7 (0.57) | 5.2 (0.51) | 5.2 (0.55) | 5.3 (0.55) | 5.5 (0.56) | 5.7 (0.78) | 6.4 (0.66) | |
| 35–64 | 7.0 (0.41) | 7.4 (0.38) | 7.0 (0.40) | 7.0 (0.36) | 6.7 (0.39) | 6.2 (0.34) | 6.2 (0.35) | 6.6 (0.39) | 6.4 (0.42) | 6.5 (0.37) | 6.7 (0.42) | 6.3 (0.34) | |
| Poverty level1 | Poor | 4.0 (0.63) | 3.8 (0.53) | 3.1 (0.50) | 3.6 (0.57) | 3.0 (0.45) | 3.2 (0.50) | 1.6 (0.28) | 3.5 (0.49) | 3.1 (0.45) | 3.9 (0.83) | 3.0 (0.63) | 3.3 (0.67) |
| Near-poor | 5.4 (0.74) | 5.1 (0.61) | 4.7 (0.60) | 4.4 (0.63) | 5.1 (0.69) | 5.3 (0.67) | 4.3 (0.53) | 4.1 (0.54) | 3.9 (0.56) | 4.8 (0.64) | 4.8 (0.60) | 4.1 (0.64) | |
| Not-poor | 7.5 (0.45) | 7.4 (0.40) | 8.0 (0.48) | 6.7 (0.35) | 6.6 (0.43) | 6.2 (0.37) | 6.5 (0.42) | 6.5 (0.40) | 6.8 (0.48) | 6.3 (0.39) | 7.1 (0.54) | 7.0 (0.42) | |
| Race and ethnicity | Hispanic or Latino | 2.8 (0.37) | 3.0 (0.37) | 2.8 (0.46) | 1.7 (0.25) | 1.9 (0.27) | 3.4 (0.48) | 2.0 (0.33) | 1.7 (0.30) | 2.3 (0.35) | 2.7 (0.40) | 3.3 (0.59) | 2.0 (0.30) |
| Non-Hispanic white, single race | 8.1 (0.48) | 8.0 (0.45) | 8.0 (0.50) | 7.3 (0.38) | 6.9 (0.44) | 6.6 (0.42) | 6.6 (0.43) | 6.8 (0.41) | 6.9 (0.47) | 6.9 (0.40) | 7.3 (0.57) | 7.3 (0.44) | |
| Non-Hispanic black, single race | 3.5 (0.58) | 3.1 (0.40) | 3.1 (0.45) | 2.8 (0.51) | 3.9 (0.52) | 2.8 (0.43) | 3.2 (0.51) | 3.3 (0.63) | 2.9 (0.48) | 2.8 (0.48) | 2.6 (0.40) | 3.8 (0.74) | |
| Non-Hispanic Asian, single race | 8.9 (1.55) | 7.5 (1.29) | 8.8 (1.25) | 8.8 (1.38) | 10.5 (1.50) | 8.0 (1.42) | 6.1 (1.12) | 9.4 (1.24) | 10.5 (1.87) | 9.2 (1.41) | 8.5 (1.32) | 8.4 (1.21) | |
| Sex | Male | 6.5 (0.40) | 6.2 (0.36) | 6.5 (0.40) | 5.3 (0.31) | 5.5 (0.35) | 5.3 (0.33) | 5.0 (0.33) | 5.1 (0.31) | 5.2 (0.35) | 5.3 (0.32) | 5.7 (0.40) | 5.9 (0.36) |
| Female | 6.4 (0.37) | 6.5 (0.34) | 6.5 (0.37) | 6.1 (0.33) | 5.8 (0.33) | 5.9 (0.34) | 5.5 (0.31) | 5.8 (0.35) | 6.0 (0.38) | 5.9 (0.34) | 6.3 (0.45) | 5.7 (0.33) | |
1Poor persons were defined as those with incomes below the poverty threshold. Near-poor persons had incomes of 100% to less than 200% of the poverty threshold. Not-poor persons had incomes at or above 200% of the poverty threshold.
NOTES: Private health insurance that was originally obtained through direct purchase or other means not related to employment was considered directly purchased coverage. Data are based on household interviews of a sample of the civilian noninstitutionalized population.
SOURCE: NCHS, National Health Interview Survey, 2011–2013, Family Core component.