Health Disparities Among Adults With Hearing Loss: United States, 2000-2006
by Charlotte A. Schoenborn, M.P.H., and Kathleen Heyman, M.S. Division of Health Interview Statistics
PDF Version (241 KB)
Importance
In 2006, 37 million adults in the United States had trouble hearing (ranging from a little trouble to being deaf), representing a substantial increase since 2000 when 31.5 million U.S. adults reported trouble hearing (1,2). Self-reported trouble hearing is a measure of hearing loss that is defined as “the total or partial inability to hear sound in one or both ears” (3). The National Healthy People Objectives for 2010 include goals to reduce prevalence of hearing loss as well as goals to eliminate health disparities among persons with disabilities (4). Accommodations are needed for adults who do not hear well to ensure equal access to health services (5,6). Services mandated by the Americans with Disabilities Act have improved access for this group of Americans, but disparities in access to health care and health information remain (7–9). The goal of this report is to highlight disparities in health status and health risk behaviors of interest to the health community working to meet the needs of adults with hearing loss. Based on a nationally representative sample of U.S. adults, this report describes selected sociodemographic characteristics, health status and conditions, and health risk behavior characteristics of adults who were deaf or had a lot of trouble hearing and adults who had a little trouble hearing compared with adults with good hearing.
Prevalence of trouble hearing
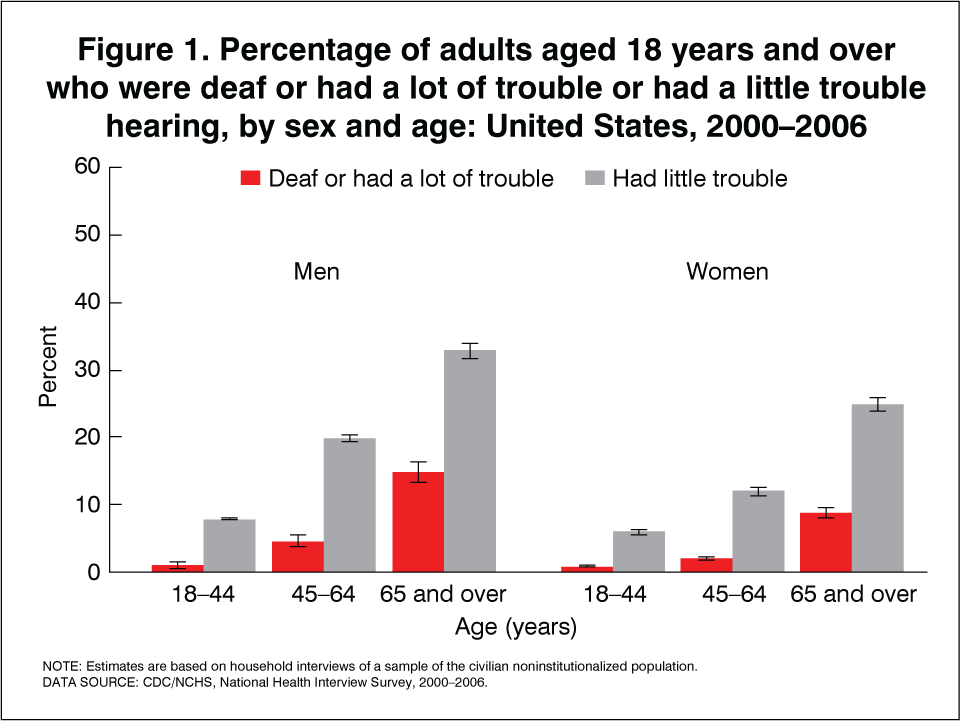
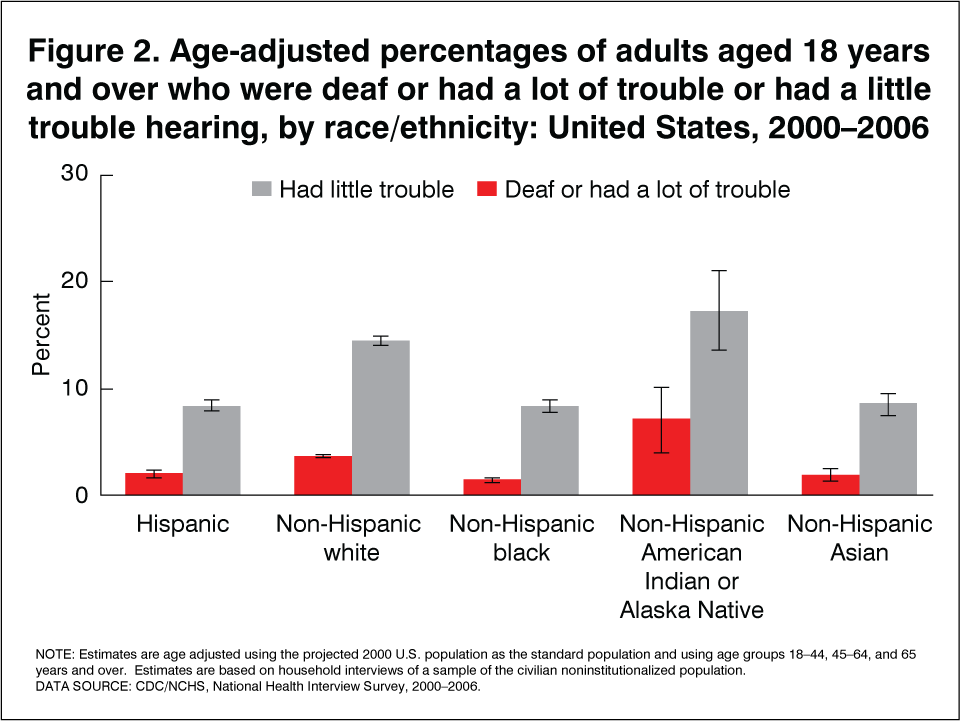
During the period 2000-2006, 3.3% of U.S. adults aged 18 years and over were deaf or had a lot of trouble hearing without the use of a hearing aid (Table 1). Men (4.3%) were more likely than women (2.4%) to be deaf or have a lot of trouble hearing. Deafness or a lot of trouble hearing increased dramatically with age, rising from 0.9% among adults under age 45 to 3.1% among adults aged 45-64 and 11.1% among adults aged 65 and over. These age-related increases in deafness or a lot of trouble hearing were similar for men and women (Figure 1). Rates of a lesser degree of hearing trouble (i.e., “a little trouble”) also rose with age, increasing more than fourfold between ages 18-44 (6.7%) and ages 65 and over (27.8%). Non-Hispanic white adults and non-Hispanic American Indian or Alaska Native (AIAN) adults had the highest rates of any hearing trouble of the race/ethnicity groups studied (Figure 2). Adults with the most education (a bachelor’s degree or higher) and those with the highest incomes were somewhat less likely than other adults to have any trouble hearing, although the differences were not large.
Health status characteristics
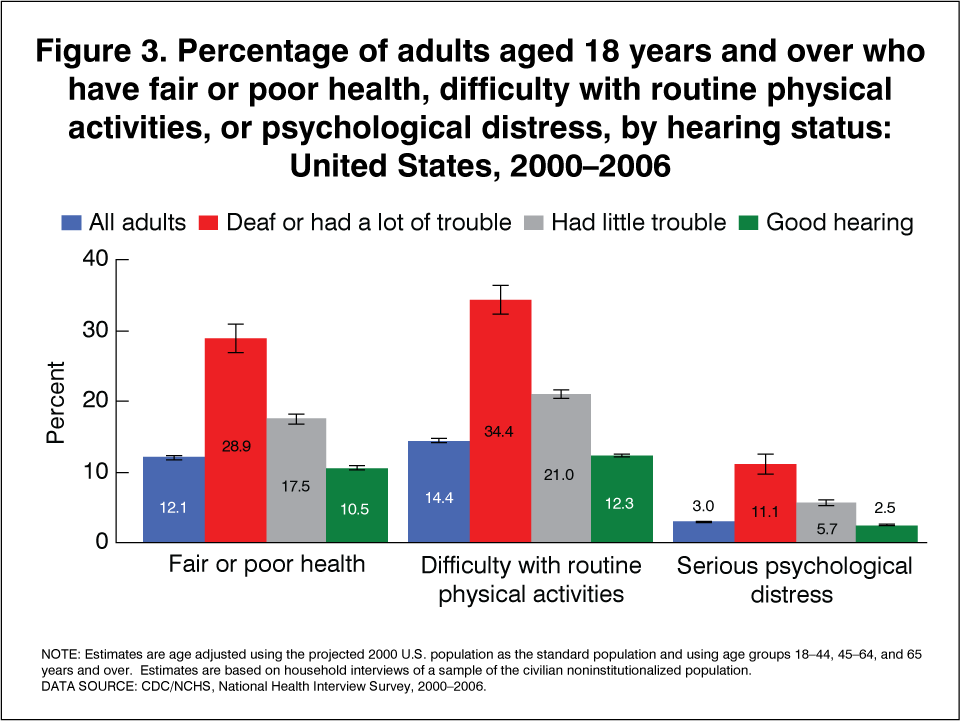
Prevalence of fair or poor health status, difficulties with physical functioning, and serious psychological distress increased with degree of hearing loss (Table 2 and Figure 3). Adults who were deaf or had a lot of trouble hearing were about three times as likely as adults with good hearing to be in fair or poor health and to have difficulty with physical functioning (such as walking, bending, reaching, etc). These adults were more than four times as likely as adults with good hearing to have experienced serious psychological distress. Adults who had a little trouble hearing also had higher rates of these health problems compared with adults who considered their hearing to be good. Diabetes and high blood pressure were more prevalent among adults who were deaf or had a lot of trouble hearing, compared with adults with good hearing. Analysis of differences by age (not shown) indicated that these disparities were greatest among adults under age 65.
Health risk behaviors
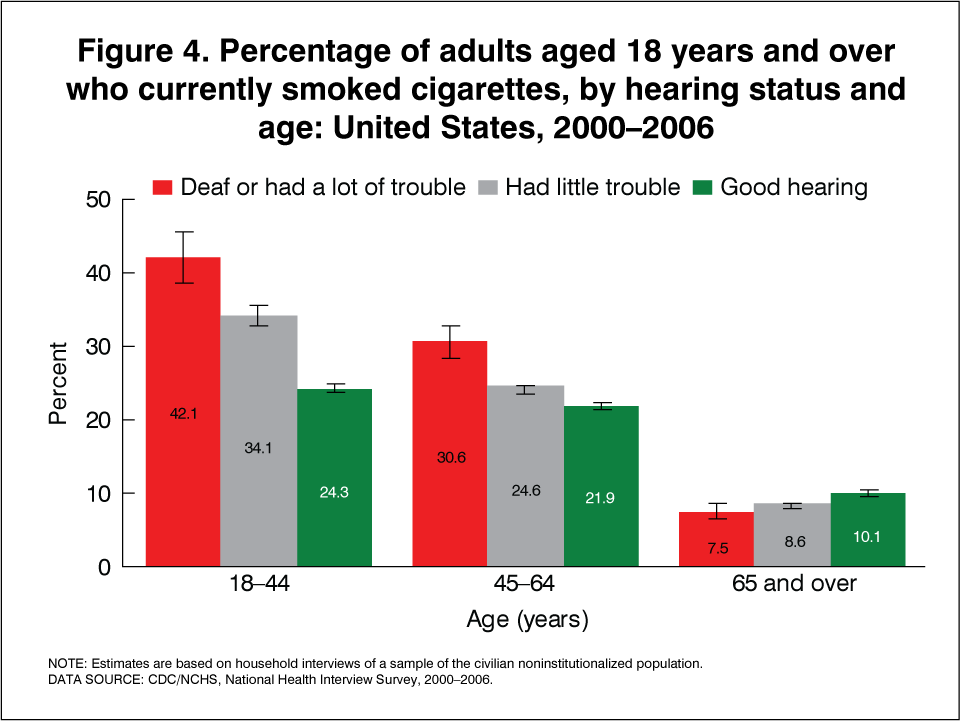
Adults who were deaf or had a lot of trouble hearing and those who had a little trouble hearing were more likely than adults with good hearing to: (a) currently smoke cigarettes; (b) have had five or more drinks in 1 day in the past year (a proxy for at-risk drinking); (c) have engaged in no leisure-time physical activity (a measure of sedentary behavior); (d) be obese; and (e) usually sleep 6 hours or less (Table 3). Analysis of differences by age (not shown) revealed that disparities in health risk behavior prevalence between adults with and without hearing loss are largely concentrated among adults under age 65. Figure 4 illustrates a sharp age difference in the disparities for smoking prevalence. Among adults aged 18-44 years, more than 40% of those who were deaf or had a lot of trouble hearing currently smoked cigarettes compared with 24% of those with good hearing. Disparities in smoking prevalence persisted among middle aged adults but were not found for adults aged 65 years and over, an age group for which hearing loss is more prevalent and smoking rates are generally low. Age-specific estimates for other behaviors are available upon request.
Discussion
In this report, disparities in selected health status characteristics and health risk behaviors were found by hearing status: adults with hearing loss had poorer health and increased risk of engaging in health risk behaviors than adults with good hearing. The reasons for higher rates of smoking, alcohol use, leisure-time physical inactivity, obesity, and inadequate sleep among adults with hearing loss compared with adults with good hearing cannot be determined from this analysis.
Barriers to optimal medical care for adults with hearing loss have been identified by the medical community and specific suggestions for effectively addressing the needs of these patients have been offered (5–8). Increased attention to the unique health care and health information needs of adults with hearing loss may help reduce disparities identified in this report. Media and other public health campaigns that use auditory techniques to promote healthy behaviors among the U.S. adult population may require modifications to more effectively reach adults with hearing loss. Inclusion of communication modalities appropriate for adults with hearing loss may aid in reducing health risk behaviors in this population.
About the data
The National Health Interview Survey (NHIS), a survey of the noninstitutionalized civilian population of the United States, has been an important source of information about health and health care in the United States since it was first conducted in 1957. NHIS is a multistage probability sample survey that is conducted continuously throughout the year by interviewers of the U. S. Census Bureau for the Centers for Disease Control and Prevention’s National Center for Health Statistics. For further information see the NHIS website. Questions about hearing status, developed in collaboration with researchers at Gallaudet University, were first asked in the NHIS in 1962-1963 (10). Subsequently, hearing questions were asked in supplement questionnaires in 1970, 1971, 1977, 1990, and 1991 (11–15). Since 1997, questions about hearing status have been asked annually in the NHIS Sample Adult Core questionnaire. Adults are asked “Which statement best describes your hearing without a hearing aid: good, a little trouble, a lot of trouble, deaf?” Annual estimates of the number and percentage of adults with any trouble hearing are available for major population subgroups (1,2,16–20).
Data collected in the 2000-2006 NHIS core questionnaires were combined to increase the reliability of the estimates. Estimates shown and discussed are annualized estimates, weighted to represent the U.S. adult population aged 18 years and over. All estimates were calculated excluding unknowns (i.e., refused, not ascertained, or don’t know). Item nonresponse for the hearing question was 0.1% and ranged from 0.1% to 4.3% for the sociodemographic, health status and health risk behavior indicators shown in Tables 1–3. Point estimates and estimates of their variances were calculated using the SUDAAN software package (21) to account for the complex sample design of the NHIS. The Taylor series linearization method was chosen for variance estimation. Differences between percentages were evaluated using two-sided significance tests at the 0.05 level. Terms such as “greater than” or “less than” indicate a statistically significant difference. Terms such as “similar” and “no difference” indicate that the estimates being compared were not significantly different. Lack of comments regarding the difference between any two estimates does not necessarily mean that the difference was tested and found to be not significant. All estimates shown meet the NCHS standard of having less than or equal to 30% relative standard error.
References
- Pleis JR, Lethbridge-Cejku M. Summary health statistics for U.S. adults: National Health Interview Survey, 2006. National Center for Health Statistics. Vital Health Stat 10(235). 2007.
- Pleis JR, Benson V, Schiller JS. Summary health statistics for U.S. adults: National Health Interview Survey, 2000. National Center for Health Statistics. Vital Health Stat 10(215). 2003.
- National Library of Medicine. National Institutes of Health. Medline Plus. Medical Encyclopedia. U.S. Department of Health and Human Services. 2008.
- U.S. Department of Health and Human Services. Healthy People 2010. 2nd ed. With Understanding and Improving Health (2 vols). Washington, D.C. U.S. Government Printing Office. November 2000.
- Ebert DA, Heckerling PA. Communication with deaf patients. Knowledge, beliefs, and practices of physicians. JAMA 273(3):227-9. Jan 18, 1995.
- Iezzoni LI, O’Day BL, Killeen M, Harker H. Communicating about health care: observations from persons who are deaf or hard of hearing. Ann Intern Med 140(5):356-62. Mar 2, 2004.
- Barnett S. Clinical and cultural issues in caring for deaf people. Fam Med 31(1):17-22. 1999.
- Barnett S. Communication with deaf and hard of hearing people: a guide for medical education. Acad Med 77(7):694-700. July 2002.
- Tamaskar P, Malia T, Stern C, Gorneflo D, Meador H, Zazove P. Preventive attitudes and beliefs of deaf and hard-of-hearing individuals. Arch Fam Med 9(6): 518-25. June 2000.
- National Center for Health Statistics. Characteristics of persons with impaired hearing, United States, July 1962-June 1963. Vital health Stat 10(35). 1967.
- Schein JD, Gentile A, Haase K. Methodological aspects of a Hearing Ability Interview Survey. National Center for Health Statistics. Vital Health Stat 2(12): 1973.
- National Center for Health Statistics. Current estimates from the Health Interview Survey, United States – 1971. National Center for Health Statistics. Vital Health Stat 10(79). 1973.
- National Center for Health Statistics. Current estimates from the Health Interview Survey: United States – 1977. National Center for Health Statistics. Vital Health Stat 10(126). 1978.
- Adams PF, Benson V. Current estimates from the National Health Interview Survey. National Center for Health Statistics, 1990. Vital Health Stat 10(181). 1991.
- Adams PF, Benson V. Current estimates from the National Health Interview Survey. National Center for Health Statistics, 1991. Vital Health Stat 10(184). 1992.
- Lucas JW, Schiller JS, Benson V. Summary health statistics for U.S. adults: National Health Interview Survey, 2001. National Center for Health Statistics. Vital Health Stat 10(218). 2004.
- Lethbridge-Cejku M, Vickerie J. Summary health statistics for U.S. adults: National Health Interview Survey, 2002. National Center for Health Statistics. Vital Health Stat 10(222). 2005.
- Lethbridge-Cejku M, Vickerie J. Summary health statistics for U.S. adults: National Health Interview Survey, 2003. National Center for Health Statistics. Vital Health Stat 10(225). 2005.
- Lethbridge-Cejku M, Rose D, Vickerie J. Summary health statistics for U.S. adults: National Health Interview Survey, 2004. National Center for Health Statistics. Vital Health Stat 10(228). 2006.
- Pleis JR, Lethbridge-Cejku M. Summary health statistics for U.S. adults: National Health Interview Survey, 2005. National Center for Health Statistics. Vital Health Stat 10(232). 2006.
- Research Triangle Institute. SUDAAN (Release 9.0.1). [Computer Software]. Research Triangle Park, NC: Research Triangle Institute. 2005.
- Kessler RC, Barker PR, Colpe LJ, Epstein JF, Gfroerer JC, Hiripi E, et al. Screening for serious mental illness in the general population. Arch Gen Psychiatry 60:184-189. 2003.
Figures
Tables
Table 1
Table 1a. Age-adjusted percent distributions (with standard errors) of hearing status1 among all adults: United States, average annual, 2000-2006
| Total2 | Good hearing | A little trouble hearing | Deaf or a lot of trouble hearing | |
|---|---|---|---|---|
| All adults | 100.0 | 83.7 (0.19) | 12.9 (0.16) | 3.3 (0.06) |
See footnotes at end of Table 1h.
Table 1b. Age-adjusted percent distributions (with standard errors) of hearing status1 by sex: United States, average annual, 2000-2006
| Sex | Total2 | Good hearing | A little trouble hearing | Deaf or a lot of trouble hearing |
|---|---|---|---|---|
| Male | 100.0 | 80.0 (0.25) | 15.6 (0.21) | 4.3 (0.09) |
| Female | 100.0 | 86.9 (0.17) | 10.6 (0.15) | 2.4 (0.05) |
See footnotes at end of Table 1h.
Table 1c. Percent distributions (with standard errors) of hearing status1 by age: United States, average annual, 2000-2006
| Age | Total2 | Good hearing | A little trouble hearing | Deaf or a lot of trouble hearing |
|---|---|---|---|---|
| 18-44 years | 100.0 | 92.4 (0.15) | 6.7 (0.14) | 0.9 (0.04) |
| 45-64 years | 100.0 | 81.3 (0.29) | 15.6 (0.25) | 3.1 (0.09) |
| 65 years and over | 100.0 | 60.8 (0.39) | 27.8 (0.32) | 11.1 (0.21) |
See footnotes at end of Table 1h.
Table 1d. Age-adjusted percent distributions (with standard errors) of hearing status1 by race and ethnicity: United States, average annual, 2000-2006
| Race and ethnicity3 | Total2 | Good hearing | A little trouble hearing | Deaf or a lot of trouble hearing |
|---|---|---|---|---|
| Hispanic | 100.0 | 89.6 (0.33) | 8.4 (0.29) | 2.0 (0.17) |
| Not Hispanic | ||||
| White | 100.0 | 81.7 (0.23) | 14.5 (0.20) | 3.7 (0.08) |
| Black | 100.0 | 90.1 (0.35) | 8.4 (0.31) | 1.4 (0.11) |
| American Indian or Alaska Native | 100.0 | 75.5 (2.43) | 17.4 (1.89) | 7.1 (1.57) |
| Asian | 100.0 | 89.5 (0.57) | 8.6 (0.52) | 1.9 (0.27) |
| Native Hawaiian or Other Pacific Islander | 100.0 | 80.3 (2.87) | 17.4 (3.27) | † – – – |
See footnotes at end of Table 1h.
Table 1e. Age-adjusted percent distributions (with standard errors) of hearing status1 by education: United States, average annual, 2000-2006
| Education4 | Total2 | Good hearing | A little trouble hearing | Deaf or a lot of trouble hearing |
|---|---|---|---|---|
| Less than high school graduate | 100.0 | 81.8 (0.22) | 14.2 (0.19) | 4.0 (0.08) |
| GED5 | 100.0 | 76.0 (0.91) | 18.2 (0.83) | 5.9 (0.54) |
| High school graduate | 100.0 | 81.8 (0.33) | 14.4 (0.29) | 3.7 (0.14) |
| Some college or Associate of Arts degree | 100.0 | 81.6 (0.34) | 15.2 (0.31) | 3.2 (0.12) |
| Bachelor degree or higher | 100.0 | 84.5 (0.30) | 12.7 (0.27) | 2.7 (0.13) |
See footnotes at end of Table 1h.
Table 1f. Age-adjusted percent distributions (with standard errors) of hearing status1 by poverty status: United States, average annual, 2000-2006
| Poverty status6 | Total2 | Good hearing | A little trouble hearing | Deaf or a lot of trouble hearing |
|---|---|---|---|---|
| Below poverty level | 100.0 | 82.8 (0.34) | 12.9 (0.28) | 4.1 (0.15) |
| >1 and <2 times poverty level | 100.0 | 82.8 (0.30) | 13.1 (0.26) | 4.0 (0.12) |
| >2 and <4 times poverty level | 100.0 | 83.2 (0.24) | 13.4 (0.21) | 3.3 (0.09) |
| 4 times poverty level or more | 100.0 | 84.7 (0.22) | 12.6 (0.20) | 2.6 (0.08) |
See footnotes at end of Table 1h.
Table 1g. Age-adjusted percent distributions (with standard errors) of hearing status1 by marital status: United States, average annual, 2000-2006
| Marital status | Total2 | Good hearing | A little trouble hearing | Deaf or a lot of trouble hearing |
|---|---|---|---|---|
| Never married | 100.0 | 86.5 (0.30) | 10.7 (0.27) | 2.7 (0.16) |
| Married | 100.0 | 83.5 (0.21) | 13.2 (0.18) | 3.3 (0.07) |
| Living with partner | 100.0 | 83.2 (0.63) | 12.9 (0.57) | 3.7 (0.35) |
| Divorced or separated | 100.0 | 83.3 (0.31) | 13.6 (0.29) | 3.0 (0.12) |
| Widowed | 100.0 | 82.1 (0.86) | 14.2 (0.80) | 3.6 (0.27) |
See footnotes at end of Table 1h.
Table 1h. Age-adjusted percent distributions (with standard errors) of hearing status1 by region of residence: United States, average annual, 2000-2006
| Region of residence | Total2 | Good hearing | A little trouble hearing | Deaf or a lot of trouble hearing |
|---|---|---|---|---|
| Northeast | 100.0 | 86.6 (0.33) | 10.6 (0.28) | 2.8 (0.11) |
| Midwest | 100.0 | 80.9 (0.34) | 15.5 (0.29) | 3.5 (0.11) |
| South | 100.0 | 84.5 (0.31) | 12.1 (0.26) | 3.3 (0.10) |
| West | 100.0 | 82.7 (0.39) | 13.7 (0.34) | 3.5 (0.13) |
† Estimates with a relative standard error greater than 50% are indicated with a dagger, but are not shown.
– – – Data not available.
1 Hearing status is based on the question, “Which statement best describes your hearing without a hearing aid: Good, a little trouble, a lot of trouble, deaf?
2 Unknowns were excluded from the denominators when calculating percent distributions.
3 Races refer to single race only. Other races and multiple races not shown due to unreliability associated with small sample sizes for this analysis. Persons of Hispanic or Latino origin may be of any race or combination of races.
4 Education is shown only for persons aged 25 years and over. Estimates are age adjusted to the projected 2000 U.S. population as the standard population using three age groups: 25-44, 45-64 years, and 65 years and over.
5 GED is General Educational Development high school equivalency diploma.
6 Poverty status is based on family income and family size using the U.S. Census Bureau poverty thresholds for 1999-2005. Computed using the imputed income files released by the National Center for Health Statistics.
NOTES: Unless otherwise specified, estimates are age adjusted to the 2000 projected U.S. population as the standard population using three age groups: 18-44 years, 45-64 years, and 65 years and over. Estimates are based on household interviews of a sample of the civilian noninstitutionalized population.
DATA SOURCE: National Health Interview Surveys, 2000-2006.
Table 2
Table 2a. Age-adjusted percent distributions (with standard errors) of reported health status among adults aged 18 years and over, by hearing status1: United States, average annual, 2000-2006
| Reported health status2 | All Adults | Good hearing | A little trouble hearing | Deaf or a lot of trouble hearing |
|---|---|---|---|---|
| Excellent or very good | 62.3 (0.27) | 64.3 (0.28) | 52.8 (0.50) | 40.0 (1.15) |
| Good | 25.5 (0.17) | 25.1 (0.18) | 29.6 (0.39) | 30.9 (1.03) |
| Fair/poor | 12.1 (0.16) | 10.5 (0.15) | 17.5 (0.35) | 28.9 (1.01) |
See footnotes at end of Table 2e.
Table 2b. Age-adjusted percent distributions (with standard errors) of difficulty with physical functioning among adults aged 18 years and over, by hearing status1: United States, average annual, 2000-2006
| Difficulty with physical functioning3 | All Adults | Good hearing | A little trouble hearing | Deaf or a lot of trouble hearing |
|---|---|---|---|---|
| Yes | 14.4 (0.15) | 12.3 (0.14) | 21.0 (0.34) | 34.4 (1.03) |
| No | 85.3 (0.15) | 87.4 (0.14) | 78.8 (0.34) | 65.2 (1.04) |
See footnotes at end of Table 2e.
Table 2c Age-adjusted percent distributions (with standard errors) of diabetes among adults aged 18 years and over, by hearing status1: United States, average annual, 2000-2006
| Diabetes4 | All Adults | Good hearing | A little trouble hearing | Deaf or a lot of trouble hearing |
|---|---|---|---|---|
| Yes | 6.8 (0.08) | 6.3 (0.08) | 8.6 (0.22) | 11.3 (0.58) |
| No | 92.2 (0.09) | 92.8 (0.09) | 89.9 (0.24) | 87.0 (0.62) |
See footnotes at end of Table 2e.
Table 2d. Age-adjusted percent distributions (with standard errors) of high blood pressure among adults aged 18 years and over, by hearing status1: United States, average annual, 2000-2006
| High blood pressure5 | All Adults | Good hearing | A little trouble hearing | Deaf or a lot of trouble hearing |
|---|---|---|---|---|
| Yes | 21.5 (0.14) | 20.5 (0.14) | 26.3 (0.35) | 30.8 (0.82) |
| No | 78.3 (0.14) | 79.3 (0.14) | 73.4 (0.35) | 69.1 (0.83) |
See footnotes at end of Table 2e.
Table 2e. Age-adjusted percent distributions (with standard errors) of serious psychological distress among adults aged 18 years and over, by hearing status1: United States, average annual, 2000-2006
| Serious psychological distress6 | All Adults | Good hearing | A little trouble hearing | Deaf or a lot of trouble hearing |
|---|---|---|---|---|
| Yes | 3.0 (0.06) | 2.5 (0.05) | 5.7 (0.22) | 11.1 (0.75) |
| No | 97.0 (0.06) | 97.5 (0.05) | 94.3 (0.22) | 88.9 (0.75) |
1 Hearing status is based on the question, “Which statement best describes your hearing without a hearing aid: Good, a little trouble, a lot of trouble, deaf?”
2 Respondent-assessed health status was based on the question: “Would you say {person}’s health is excellent, very good, good, fair, or poor?” This question is asked in the family questionnaire and may be proxy reported.
3 In a series of separate questions, respondents were asked the degree of difficulty they experienced performing nine physical activities by themselves, and without using any special equipment. The activities included walking a quarter of a mile (or three city blocks); standing for 2 hours; stooping/bending/kneeling; climbing 10 steps without resting; sitting for 2 hours; reaching over one’s head; using one’s fingers to grasp or handle small objects; lifting or carrying a 10-pound object (such as a full bag of groceries); and pushing or pulling a large object (such as a living room chair). The response categories consisted of “not at all difficult,” “only a little difficult,” “somewhat difficult,” “very difficult,” “can’t do at all,” or “do not do this activity.” For this table, adults who responded “very difficult” or “can’t do at all” to any of these activities are classified as having difficulty.
4 Diabetes was determined from the question: “Have you ever been told by a doctor or other health professional that you had diabetes or sugar diabetes?” Females were instructed to exclude pregnancy-related diabetes. Borderline diabetes was excluded when calculating percentages.
5 High blood pressure was determined from the question: “Have you ever been told by a doctor or other health professional that you had hypertension (or high blood pressure)?”
6 Serious psychological distress was based on a composite of the responses to a series of questions asking “How often in the past 30 days did you feel: so sad that nothing could cheer you up; hopeless; worthless; that everything was an effort; nervous; or restless: all of the time, most of the time, some of the time, a little of the time, or none of the time?” A summary score for these six items was calculated and a total score of 13 or higher was classified as “serious psychological distress,” consistent with a scoring algorithm developed by Kessler et al., 2003 (22)
NOTES: Estimates are age adjusted to the projected 2000 U.S. population as the standard population using three age groups: 18-44 years, 45-64 years, and 65 years and over. Estimates are based on household interviews of a sample of the civilian noninstitutionalized population. Denominator for each percent distribution excludes persons with unknown selected health characteristic. Percent distributions for “All adults” include adults with unknown hearing status.
DATA SOURCE: CDC/NCHS National Health Interview Survey, 2000-2006.
Table 3
Table 3a. Age-adjusted percent distributions (with standard errors) of smoking status among adults aged 18 years and over by hearing status1: United States, average annual, 2000-2006
| Smoking status2 | All Adults | Good hearing | A little trouble hearing | Deaf or a lot of trouble hearing |
|---|---|---|---|---|
| Current smoker | 21.7 (0.20) | 21.2 (0.20) | 26.9 (0.44) | 32.8 (1.02) |
| Former smoker | 21.7 (0.15) | 20.5 (0.16) | 26.6 (0.36) | 25.7 (0.77) |
| Never smoked | 56.6 (0.25) | 58.3 (0.25) | 46.4 (0.46) | 41.5 (1.05) |
See footnotes at end of Table 3e.
Table 3b. Age-adjusted percent distributions (with standard errors) of alcohol use status among adults aged 18 years and over by hearing status1: United States, average annual, 2000-2006
| Alcohol use3 | All Adults | Good hearing | A little trouble hearing | Deaf or a lot of trouble hearing |
|---|---|---|---|---|
| 5 or more drinks in one day | 19.9 (0.24) | 19.2 (0.24) | 26.7 (0.52) | 23.1 (1.12) |
| Less than 5 drinks (including none) | 80.1 (0.24) | 80.8 (0.24) | 73.3 (0.52) | 76.9 (1.12) |
See footnotes at end of Table 3e.
Table 3c. Age-adjusted percent distributions (with standard errors) of leisure-time physical activity among adults aged 18 years and over by hearing status1: United States, average annual, 2000-2006
| Leisure-time physical activity4 | All Adults | Good hearing | A little trouble hearing | Deaf or a lot of trouble hearing |
|---|---|---|---|---|
| No activity | 38.9 (0.45) | 39.0 (0.46) | 35.2 (0.60) | 46.7 (1.20) |
| Some activity | 29.7 (0.25) | 29.3 (0.25) | 33.5 (0.47) | 27.6 (1.03) |
| Regularly active | 31.4 (0.29) | 31.7 (0.30) | 31.3 (0.51) | 25.7 (1.05) |
See footnotes at end of Table 3e.
Table 3d. Age-adjusted percent distributions (with standard errors) of body weight status among adults aged 18 years and over by hearing status1: United States, average annual, 2000-2006
| All Adults | Good hearing | A little trouble hearing | Deaf or a lot of trouble hearing | |
|---|---|---|---|---|
| Underweight | 2.0 (0.04) | 2.0 (0.05) | 1.6 (0.11) | 2.5 (0.39) |
| Healthy weight | 39.2 (0.20) | 40.1 (0.21) | 32.7 (0.42) | 31.2 (1.07) |
| Overweight | 35.2 (0.13) | 35.1 (0.15) | 36.7 (0.42) | 34.6 (1.06) |
| Obese | 23.5 (0.18) | 22.8 (0.18) | 29.0 (0.42) | 31.7 (1.05) |
See footnotes at end of Table 3e.
Table 3e. Age-adjusted percent distributions (with standard errors) of hours of sleep among adults aged 18 years and over by hearing status1: United States, average annual, 2000-2006
| Hours of sleep6 | All Adults | Good hearing | A little trouble hearing | Deaf or a lot of trouble hearing |
|---|---|---|---|---|
| 6 hours or less | 28.5 (0.22) | 27.7 (0.23) | 34.0 (0.65) | 38.9 (1.77) |
| 7-8 hours | 62.8 (0.24) | 64.2 (0.25) | 55.9 (0.68) | 46.3 (1.73) |
| 9 hours or more | 8.7 (0.13) | 8.1 (0.14) | 10.1 (0.40) | 14.8 (1.22) |
1 Hearing status is based on the question, “Which statement best describes your hearing without a hearing aid: Good, a little trouble, a lot of trouble, or deaf?”
2 Smoking status was based on responses to two questions: “Have you smoked at least 100 cigarettes in your entire life?” and, if yes, “Do you now smoke every day, some days, or not at all?” Never smoked –never smoked cigarettes or smoked less than 100 cigarettes in lifetime; Former smoker–smoked at least 100 cigarettes in lifetime, but does not currently smoke; current smoker–smoked at least 100 cigarettes in lifetime and currently smoked.
3 Alcohol use is based on the question, “In the past year, on how many DAYS did you have 5 or more drinks of any alcoholic beverage?” The question was asked only of current drinkers but nondrinkers are included in this table and classified as “Less than 5 drinks, including none.”
4 Leisure time physical activity is based on four questions: “How often do you usually engage in vigorous leisure-time physical activities for AT LEAST 10 MINUTES that cause HEAVY sweating or LARGE increases in breathing or heart rate?” and “How long do you do these vigorous activities each time?” “How often do you usually engage in LIGHT-MODERATE leisure-time physical activities for AT LEAST 10 MINUTES that cause ONLY LIGHT sweating or SLIGHT to MODERATE increases in breathing or heart rate?” and “How long do you do these light or moderate activities each time?” Adults who do vigorous activity at least 3 times a week for at least 20 minutes OR light-moderate activity 5 times a week for at least 30 minutes, or both were classified as engaging in “Regular activity.” Adults who did some activity but less than regular were classified as “some activity.” Adults who said they never did either type of activity or were unable to engage in these activities were classified as engaging in “No activity.”
5 Body weight status was based on body mass index (BMI) calculated using respondent reported height and weight: Underweight is BMI less than 18.5; healthy weight is BMI greater than or equal to 18.5 and less than 25.0; overweight is BMI greater than or equal to 25.0 and less than 30.0; obese is BMI greater than or equal to 30.0.
6 Sleep was based on the question “How many hours of sleep do you usually get in a 24-hour period?” Responses were in whole numbers and could range from 1-24. The sleep question was first introduced into the Sample Adult core in 2004. Estimates shown are an annual average for 2004-2006.
NOTES: Estimates are age adjusted to the projected 2000 U.S. population as the standard population using three age groups: 18-44 years, 45-64 years, and 65 years and over. Estimates are based on household interviews of a sample of the civilian noninstitutionalized population. Denominator for each percent distribution excludes persons with unknown selected health behavior characteristic. Percent distributions for “All adults” include adults with unknown hearing status.
DATA SOURCE: CDC/NCHS National Health Interview Survey, 2000-2006.