Estimates of Emergency Department Capacity: United States, 2007
by Linda F. McCaig, M.P.H., Jianmin Xu, M.S., and Richard W. Niska, M.D., M.P.H., F.A.C.E.P., Division of Health Care Statistics
PDF Version (103 KB)
In 2006, the Institute of Medicine (IOM) released a report titled “Hospital-Based Emergency Care: At the Breaking Point,” which identified weaknesses in the nation’s ability to respond to large-scale emergency situations, whether disease outbreaks such as pandemic influenza, naturally occurring disasters, or acts of terrorism (1). Over the last several decades, the role of emergency departments (EDs) has expanded from treating seriously ill and injured patients to providing urgent unscheduled care to patients unable to gain access to their providers in a timely fashion and to providing primary care to Medicaid beneficiaries and persons without insurance. EDs are now frequently overloaded. One of the most common factors related to ED crowding is the inability to transfer ED patients to an inpatient bed once a decision has been made to admit them (2). As the ED begins to “board” patients, the space, the staff, and the resources available to treat new patients are further reduced. A consequence of overcrowded EDs is ambulance diversion, in which EDs close their doors to incoming ambulances. The resulting treatment delay can be catastrophic for the patient. Approximately 500,000 ambulances are diverted annually in the United States (i.e., one ambulance diversion per minute) (3).
The National Hospital Ambulatory Medical Care Survey (NHAMCS), inaugurated in 1992, is the longest continuously running nationally representative survey of hospital ED utilization. The NHAMCS is conducted by the Centers for Disease Control and Prevention’s National Center for Health Statistics (NCHS). This Health E-stat provides ED level estimates for items that were added to the 2007 NHAMCS hospital induction interview in response to the IOM report (1).
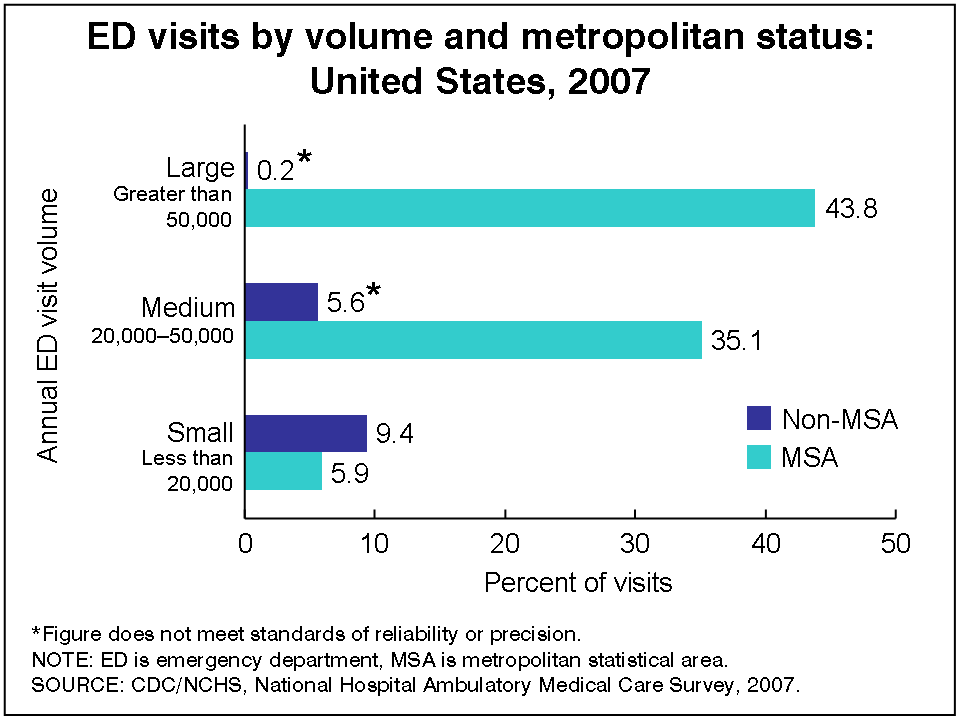
Although large EDs (annual visit volume greater than 50,000) in metropolitan statistical areas (MSAs) comprised 17.7 percent of EDs (data not shown), they accounted for 43.8 percent of all ED visits (Figure). The implication is that small EDs (annual visit volume less than 20,000) may not experience crowding and, therefore, have little need for some of the techniques suggested in the IOM report. The IOM recommendations are particularly important for large, urban EDs, which experience higher visit volumes.
About one-half of all hospitals with EDs had a bed coordinator or bed czar, 58.2 percent had elective surgeries scheduled 5 days a week, and 66.1 percent had bed census data available instantaneously (Table). Electronic medical records (EMRs), either all electronic or part paper and part electronic, were used in 61.6 percent of EDs. EMR systems have also been defined as basic (patient demographics, problem lists, clinical notes, orders for prescription, and viewing laboratory and imaging results) or fully functional (prescription orders sent electronically, warnings of drug interactions or contraindications, orders for tests, out-of-range test levels highlighted, medical history and followup, and reminders for guideline-based interventions in addition to the basic elements) (4). Basic EMR systems were reported by 14.9% of EDs (data not shown); however, the estimate for fully functional EMR systems was unreliable.
More than one-third of EDs had an observation or clinical decision unit. Admitted ED patients were “boarded” for more than 2 hours in the ED while waiting for an inpatient bed in 62.5 percent of EDs. Among EDs that “boarded” patients, 14.8 percent used inpatient hallways or another space outside the ED when it was critically overloaded. In the previous 2 years, 24.3 percent of EDs increased the number of standard treatment spaces. Although 19.5 percent of EDs expanded their physical space in the last 2 years, 31.5 percent of those that did not expand their physical space plan to do so within the next 2 years. The frequency of use of ED patient care techniques was as follows: bedside registration (66.1%), computer-assisted triage (40.0%), zone nursing (35.3%), electronic dashboard (35.2%), separate fast track unit for nonurgent care (33.8%), “pool” nurses (33.2%), full capacity protocol (21.1%), and radio frequency identification tracking (9.8%).
The table presents estimates of ED characteristics by ED visit volume and MSA status. When compared with small EDs, large EDs were more likely to have a bed coordinator in their hospitals (71.2% compared with 33.8%); have an observation or clinical decision unit (53.5% compared with 32.5%); “board” patients for more than 2 hours in the ED while waiting for an inpatient bed (86.5% compared with 39.0%); and use bedside registration (89.0% compared with 54.2%), computer-assisted triage (62.2% compared with 24.3%), and zone nursing (61.9% compared with 19.0%).
EDs with over 20,000 annual visits comprised 70.5 percent of EDs in MSAs. When compared to EDs in non-MSAs, EDs in MSAs were more likely to have a bed coordinator or bed czar in their hospital (60.7% compared with 30.0%) and “board” patients for more than 2 hours in the ED while waiting for an inpatient bed (77.4% compared with 32.8%).
Additional information about ED utilization is available from the NCHS Ambulatory Health Care website.
References
- Institute of Medicine. Hospital-Based Emergency Care: At the Breaking Point. Washington, DC: National Academy Press. 2006.
- General Accounting Office. Hospital Emergency Departments: Crowded Conditions Vary Among Hospitals and Communities. Washington, DC: General Accounting Office. 2003.
- Burt CW, McCaig LF, Valverde RH. Analysis of ambulance transports and diversions among U.S. emergency departments. Ann Emerg Med 47(4):317-326. 2006.
- DesRoches CM, Campbell EG, Rao SR, Donelan K, Ferris TG, Jha A, et al. Electronic health records in ambulatory care — a national survey of physicians. N Engl J Med 359:50-60. 2008.
Figure
Tables
Tables – Estimates of Emergency Department Capacity: United States, 2007