Trends in Circumcision for Male Newborns in U.S. Hospitals: 1979–2010
by Maria Owings, Ph.D.; Sayeedha Uddin, M.D., M.P.H.; and Sonja Williams, M.P.H., Division of Health Care Statistics
This report provides estimates of male newborn circumcisions performed during the birth hospitalization. Using data from the National Hospital Discharge Survey (NHDS), annual rates of newborn circumcision are presented for 1979–2010. National and regional rates are shown in both tabular and graphical form, and trends across the 32-year period are discussed. Note that these estimates do not include circumcisions performed outside the hospital setting (e.g., ritual circumcisions) or those performed at any age following discharge from the birth hospitalization. Thus, these rates cannot be used as prevalence estimates for all male circumcisions in the United States.
National trends
Across the 32-year period from 1979 through 2010, the national rate of newborn circumcision declined 10% overall, from 64.5% to 58.3% (Table and Figure 1). During this time, the overall percentage of newborns circumcised during their birth hospitalization was highest in 1981 at 64.9%, and lowest in 2007 at 55.4%.
However, rates fluctuated during this period, generally declining during the 1980s, rising in the 1990s, and declining again in the early years of the 21st century. These changes occurred during a period of changing guidance on routine newborn circumcision. For example, American Academy of Pediatrics’ (AAP) task force reports during the 1970s (1,2) stated there was no medical indication for routine circumcision of the newborn; AAP revised its position in 1989 (3), stating there were potential medical benefits to newborn circumcision; and then in 1999 (4), an AAP policy statement said that, despite potential medical benefits of newborn male circumcision, there was insufficient evidence to recommend routine circumcision of newborns.
Regional trends
Newborn circumcision rates for the four U.S. census regions showed distinctly different patterns (Table and Figure 2). For newborns in the Northeast, the overall trend was flat across the 32 years, and no discernible patterns were evident, although annual rates varied between 60.7% (in 2007) and 69.6% (in 1994). In the Midwest, fluctuations in newborn circumcision rates generally mirrored trends in the national rate: declining until the mid-1980s, increasing until 1998, and then declining again through 2010. Rates ranged between 82.9% in 1998 and 68.8% in 2009. In the South, rates of newborn circumcision generally increased from 1979 until 1998, after which they declined. These rates ranged between 53.8% (in 1988) and 66.1% (in 1995). In marked contrast was the trend for the West. Over the 32-year period, the percentage of newborns receiving circumcision at birth decreased 37%, from 63.9% in 1979 to 40.2% in 2010. Most of this decrease occurred in the 1980s, with the rate dropping to 41.0% in 1989. Rates continued to decrease through 2010, with a low of 31.4% in 2003.
Data sources and methods
This report is based on data from NHDS, conducted by the Centers for Disease Control and Prevention’s National Center for Health Statistics (NCHS) from 1965 through 2010. Data on newborn circumcision performed during the birth hospitalization have been collected in NHDS since 1979, when the International Classification of Diseases, Ninth Revision, Clinical Modification (ICD–9–CM) (5) was instituted. NHDS is the only source of reliable, national, historical data on male newborn circumcision performed during the birth hospitalization.
Circumcision rates for male neonates, based on NHDS data for 1999–2008, were reported and compared with those based on other data sources (i.e., the Nationwide Inpatient Sample from the Agency for Healthcare Research and Quality, and the Charge Data Master from SDI Health, Plymouth Meeting, PA) (6). Observed decreases in the incidence of the procedure differed among the data sources, but the maximum absolute difference for any given year was less than 6%.
NHDS employed a stratified, clustered, multistage sampling design that produces unbiased national and regional estimates of hospital utilization in the United States. Data were collected from a sample of discharges selected from a national probability sample of nonfederal, short-stay hospitals. This analysis focused only on male newborn infants born during the sampled hospitalization. Circumcision was identified by the presence of ICD–9–CM procedure code 64.0 on the discharge record.
Newborn circumcision rates over the 1979–2010 period were analyzed using JoinPoint (7), a statistical software program that detects discontinuities in trend lines and tests whether apparent changes in the slope of the trend line are statistically significant. Separate joinpoint models were fitted for the national newborn circumcision rate, as well as for each of the four census regions (Northeast, Midwest, South, and West). The best fit was determined by a series of permutation tests that attempt to fit the data to the smallest number of joinpoints. Statements made about differences, including those referring to increasing or decreasing trends, have been tested and found to be statistically significant. Statistical significance was determined based on an alpha level of 0.05.
Additional NHDS publications on a range of topics are available from the NCHS website. Public-use electronic data sets are downloadable from the Web, and restricted-format data files are accessible only through the NCHS Research Data Center to authorized users.
References
- American Academy of Pediatrics, Committee on Fetus and Newborn. Standards and recommendations for hospital care of newborn infants. 5th ed. Evanston, IL: American Academy of Pediatrics. 1971.
- American Academy of Pediatrics, Committee on Fetus and Newborn. Report of the Ad Hoc Task Force on Circumcision. Pediatrics 56(4):610–1. 1975.
- American Academy of Pediatrics, Task Force on Circumcision. Report of the Task Force on Circumcision. Pediatrics 84(2):388–91. 1989.
- American Academy of Pediatrics, Task Force on Circumcision. Circumcision policy statement. Pediatrics 103(3):686–93. 1999.
- National Center for Health Statistics and Centers for Medicare & Medicaid Services. International classification of diseases, ninth revision, clinical modification. 6th ed. DHHS Pub No. (PHS) 06–1260. 2006.
- Centers for Disease Control and Prevention. Trends in in-hospital newborn male circumcision—United States, 1999–2010. MMWR 60(34):1167–8. 2011.
- Joinpoint Regression Program, version 4.0 [computer software]. Bethesda, MD: National Institutes of Health, National Cancer Institute. 2012.
Table
Figures
Figure 1. Rates of circumcision performed on male newborn infants discharged from short-stay hospitals: United States, 1979–2010
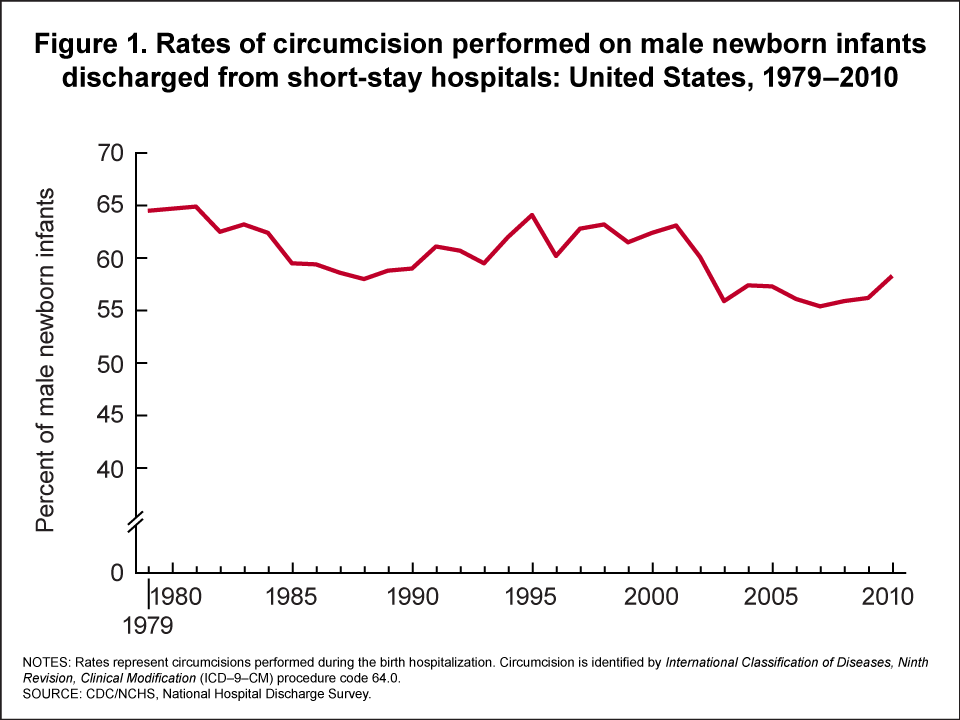
NOTES: Rates represent circumcisions performed during birth hospitalization. Circumcision is
identified by International Classification of Diseases, Ninth Revision, Clinical Modification
(ICD-9-CM) Procedure Code 64.0.
SOURCE: CDC/NCHS, National Hospital Discharge Survey.
Figure 2. Rates of circumcision performed on male newborn infants discharged from short-stay hospitals, by region: United States, 1979–2010
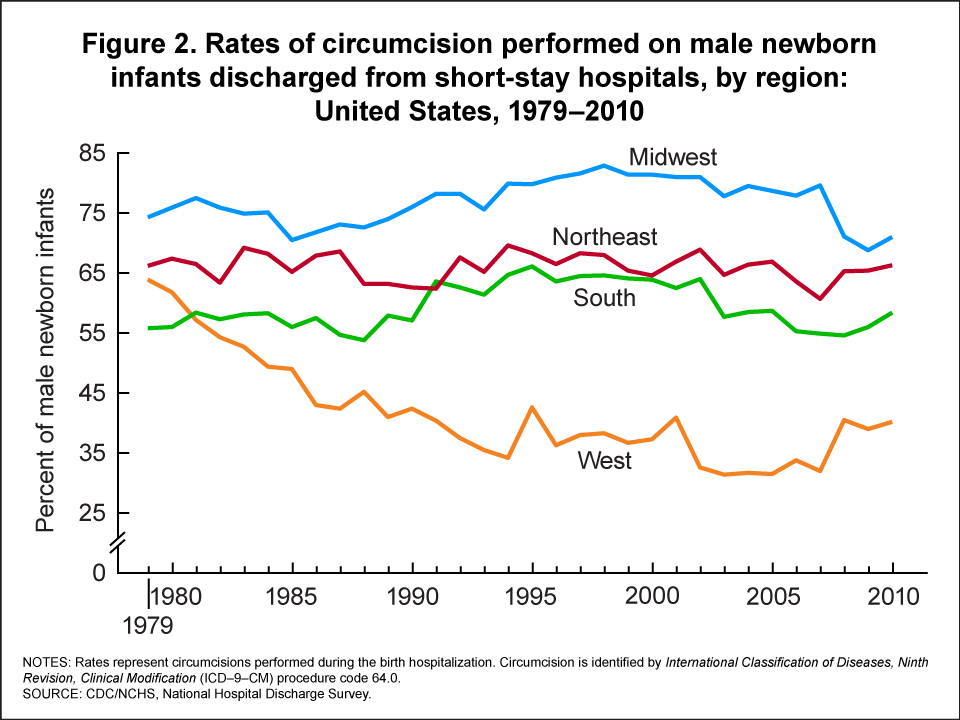
NOTES: Rates represent circumcisions performed during birth hospitalization. Circumcision is
identified by International Classification of Diseases, Ninth Revision, Clinical Modification
(ICD-9-CM) Procedure Code 64.0.
SOURCE: CDC/NCHS, National Hospital Discharge Survey.