Recent Trends in Births and Fertility Rates Through 2010
by Paul D. Sutton, Ph.D., and Brady E. Hamilton, Ph.D., Division of Vital Statistics
PDF Version (68 KB)
The broad-based decline in births and fertility rates from 2007 through 2009 is now well-documented (1–3). An earlier NCHS Health E-Stat showed the overall birth count and fertility rate continuing to decline through the first 6 months of 2010 (4). This report updates and extends the trend through December 2010 (5).
The provisional count of births in the United States for 2010 (12-month period ending December 2010) was 4,007,000 (5). This count was 3 percent less than the number of births in 2009 (4,131,019) and 7 percent less than the all-time high of 4,316,233 births in 2007 (3,6).
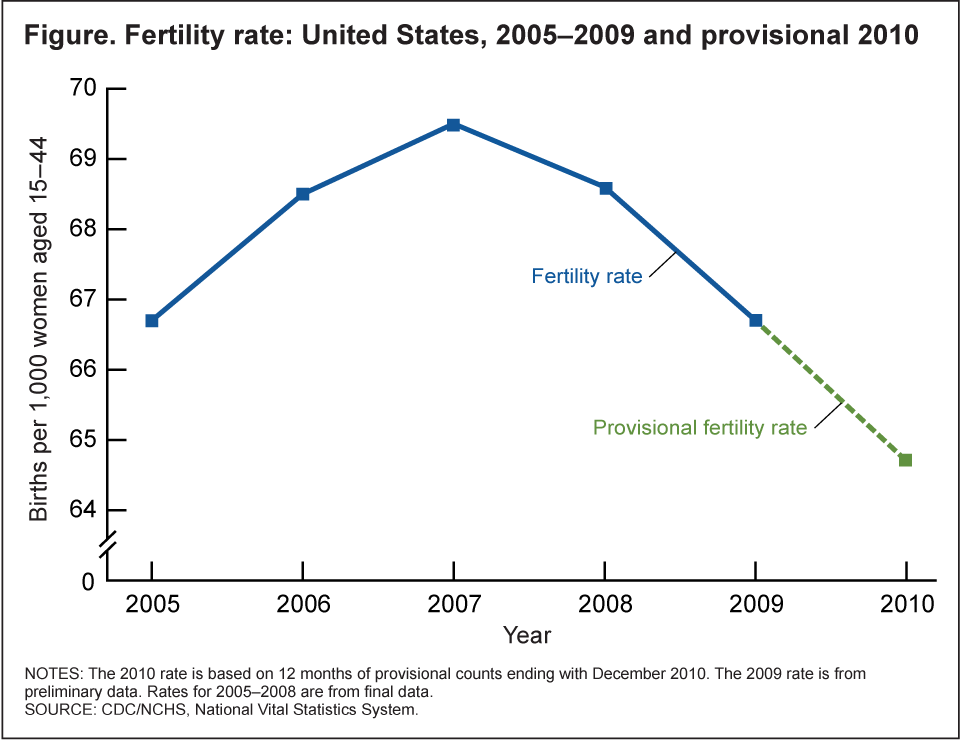
The provisional fertility rate for 2010 was 64.7 births per 1,000 women aged 15–44 (5). This was 3 percent less than the 2009 preliminary rate of 66.7 and 7 percent less than the 17-year high of 69.5 in 2007 (see Figure ) (3,6).
Data sources and methods
Provisional counts and rates are based on 12 months of provisional data ending with the specified month. Provisional counts are rounded to the nearest thousand. For further information about provisional data see Births, Marriages, Divorces, and Deaths: Provisional Data for 2009 (7). Data for 2009 are preliminary. For more information about preliminary birth data see Births: Preliminary Data for 2009 [PDF – 307 KB] (3). Data for years prior to 2009 are final. For more information about final birth data see Births: Final Data for 2008 [PDF – 1.6 MB] (8).
References
- Sutton PD, Hamilton BE, Mathews TJ. Recent decline in births in the United States, 2007–2009. NCHS data brief, no 60. Hyattsville, MD: National Center for Health Statistics. 2011.
- Ventura SJ, Hamilton BE. U.S. teenage birth rate resumes decline. NCHS data brief, no 58. Hyattsville, MD: National Center for Health Statistics. 2011.
- Hamilton BE, Martin JA, Ventura SJ. Births: Preliminary Data for 2009 [PDF – 307 KB] . National vital statistics reports; vol 59 no 3. Hyattsville, MD: National Center for Health Statistics. 2010.
- Sutton PD. Recent trends in births and fertility rates through June 2010. National Center for Health Statistics Health E-Stat. 2010.
- National Center for Health Statistics. Provisional monthly and 12-month ending number of live births, deaths, and infant deaths and rates: United States, January 2009–December 2010. Internet table.
- Martin JA, Hamilton BE, Sutton PD, et al. Births: Final data for 2007 [PDF – 1.8 MB]. National vital statistics reports; vol 58 no 24. Hyattsville, MD: National Center for Health Statistics. 2010.
- Tejada-Vera B, Sutton PD. Births, Marriages, Divorces, and Deaths: Provisional Data for 2009 . National vital statistics reports; vol 58 no 25. Hyattsville, MD: National Center for Health Statistics. 2010.
- Martin JA, Hamilton BE, Sutton PD, et al. Births: Final Data for 2008 [PDF – 1.6 MB] . National vital statistics reports; vol 59 no 1. Hyattsville, MD: National Center for Health Statistics. 2010.
Figure