Infographics
Infographics
Use the code provided in the following links to embed infographics in social networking sites, websites, and blogs. Visit CDC Social Media Tools, Guidelines & Best Practices for more information about how to use social media tools.

Did you know that in 1960 26% of the money spent on food in the United States was on food eaten away from home, and by 2011 that number had jumped to nearly half? Americans now buy and consume food away from home an average of four times a week which can mean an extra eight pounds a year. View this infographic for data on food eaten away from home and tips for eating out or on-the-go.

Servings everywhere have grown, along with our waistlines. This infographic has data on the increase in the average restaurant meal and tips for eating out.
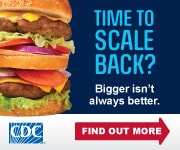
Portion sizes have steadily increased over the past few decades. This infographic has data on the increase in hamburger portion size and the average weight of men along with tips for eating out.

Do you know how much time kids ages 8-18 spend on average in front of a screen for entertainment each day? View this infographic that has screen time data for kids and offers physical activity ideas and tips for parents on limiting entertainment screen time.