Data, Statistics, and Reporting

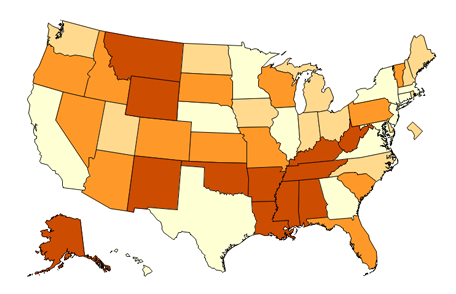
CDC’s WISQARS™ is an interactive, online database that provides fatal and nonfatal injury, violent death, and cost of injury data. Researchers, the media, public health professionals, and the public can use WISQARS™ data to learn more about the public health and economic burden associated with unintentional and violence-related injury in the United States.
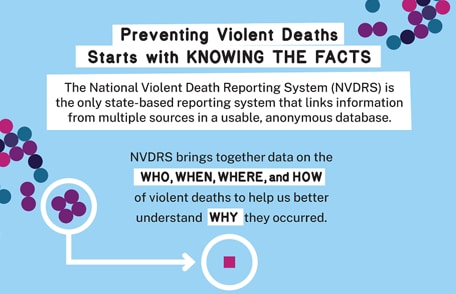
NVDRS is a state-based surveillance system that pools more than 600 unique data elements from multiple sources into a usable, anonymous database. NVDRS covers all types of violent deaths – including homicides and suicides – in all settings for all age groups.
Explore state profiles, data and publications, and other NVDRS resources.
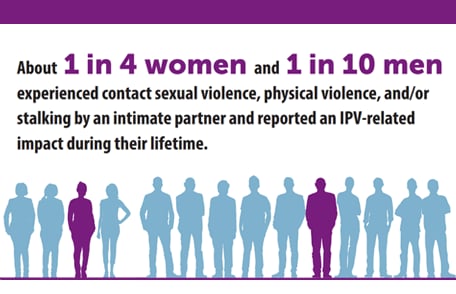
NISVS collects comprehensive national- and state-level data on intimate partner violence, sexual violence and stalking victimization in the United States.
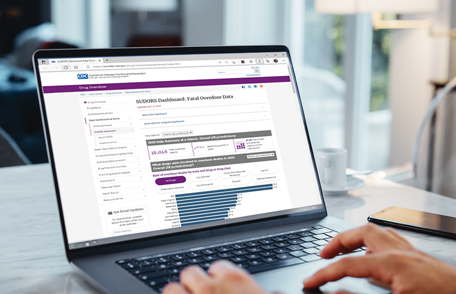
CDC’s SUDORS Dashboard is an interactive data visualization tool that displays comprehensive data on unintentional and undetermined intent drug overdose deaths that occurred in 2020, 2021, and 2022. Participating jurisdictions provided data from death certificates, coroner/medical examiner reports (including scene evidence, witness reports, and autopsy reports), and postmortem toxicology reports. Combined, these sources offer valuable data about drugs involved in overdose deaths, demographic characteristics, circumstances surrounding overdose deaths, and potential opportunities for intervention.
CDC’s DOSE Dashboard is an interactive data visualization tool that displays current nonfatal drug overdose-related emergency department (ED) data from syndromic surveillance systems. DOSE data can be used to compare monthly and annual trends in nonfatal drug overdose-related ED visits by drug types (i.e., all drugs, all opioids, heroin, and all stimulants), state, and sex and age group.
