FoodNet Fast: Pathogen Surveillance Tool FAQ
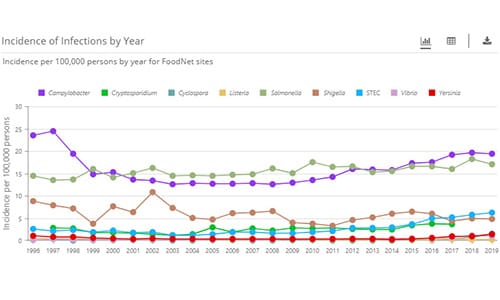
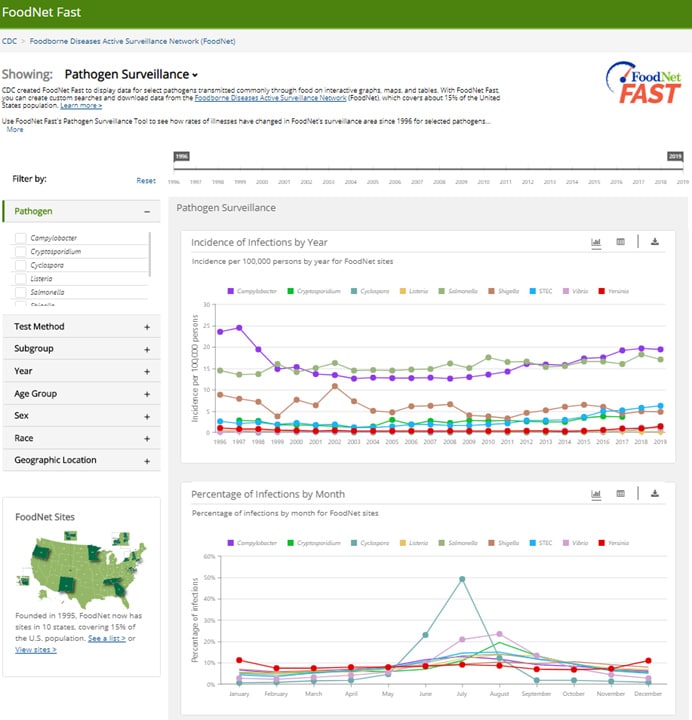
FoodNet Fast’s Pathogen Surveillance Tool lets you to see how rates of illness have changed since 1996 for nine pathogens transmitted commonly through food: Campylobacter, Cryptosporidium*, Cyclospora, Listeria, Salmonella, Shiga toxin-producing E. coli (STEC), Shigella, Vibrio, and Yersinia.
* Data available through 2017.
Information About Data
FoodNet Fast has information on laboratory-diagnosed bacterial and parasitic infections reported to FoodNet since 1996. Data for the most recent year may be preliminary.
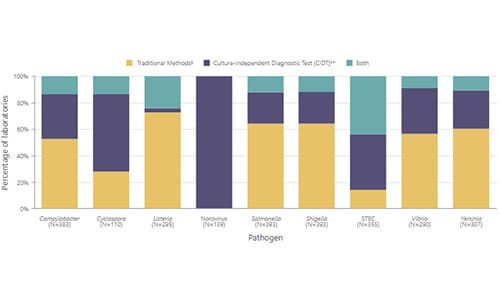
It includes information on bacterial infections diagnosed by culture and on those diagnosed by culture-independent diagnostic test (CIDT) since 2012.
You can search by pathogen, year, age group, sex, race, and FoodNet site. The tool also provides information on ethnicity, seasonality, hospitalizations, deaths, travel-associated cases, and outbreak-associated cases.
When viewing a single pathogen, you can filter by test method and subgroup (i.e., species, serogroup, serotype). Subgroup information is not available for the parasitic infections Cryptosporidium and Cyclospora. Campylobacter species information is only available since 2010.
Get tips and tricks for making the most out of your search.
Infections caused by bacteria (Campylobacter, Listeria, Salmonella, Shigella, STEC, Vibrio, and Yersinia) were detected either by testing a patient’s specimen using a culture-independent diagnostic test (CIDT) or performing a culture and isolating bacteria from the specimen, or both. CIDTs detect specific antigens or nucleic acid sequences, or, for STEC, Shiga toxin or Shiga toxin genes.
Infections caused by parasites (Cryptosporidium and Cyclospora) were identified through microscopy techniques or by detecting specific antigens or nucleic acid sequences.
The laboratory can use either or both of the following testing methods to detect bacterial pathogens:
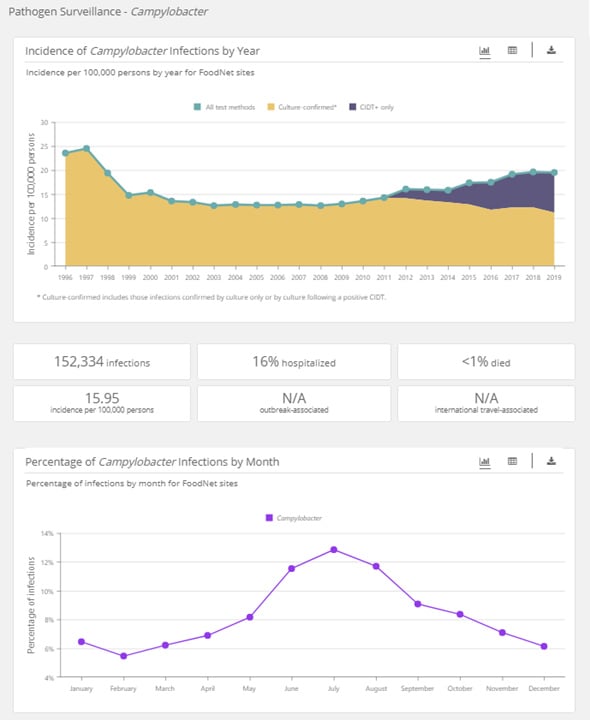
- “CIDT+ only” (CIDT-positive only) means the infections were detected only by CIDT; the specimens were either not tested by culture or were culture-negative.
- “Culture-confirmed” means the infection was confirmed by culture; the culture might have been the only test, or it might have been done after a positive CIDT.
These terms do not apply to parasitic infections.
No. FoodNet Fast does not give a complete picture for the following reasons:
- The tool includes infections only among people who reside in FoodNet’s surveillance area, which covers about 16% of the U.S. population. Despite not being representative of the entire U.S. population, FoodNet data are used to estimate U.S. foodborne illness incidence and trends.
- The tool includes only laboratory-confirmed infections reported to CDC. Many ill people do not seek medical care, and specimens (a sample from a patient, such as stool or blood) might not be collected or tested for the pathogen that caused the illness.
- Not all infections caused by these pathogens are transmitted by food. Some are transmitted by water, other people, or animals or their environments. For most illnesses, the transmission route is not determined.
Preliminary data from the previous year are published in the Morbidity and Mortality Weekly Report (MMWR) each spring. Final data are summarized in the FoodNet Annual Report, which is released later, after updated census information becomes available. Read the reports with preliminary and final data from FoodNet.
It takes time for public health authorities to complete their case investigations and then to report the results to CDC. CDC reviews the reports for missing information in key data fields and works with state and local health departments to correct errors. CDC updates FoodNet Fast after finalizing the reported information.
Using the Pathogen Surveillance Tool
Incidence refers to the occurrence of new infections reported in a population during a specified period.
FoodNet calculates incidence by dividing the number of cases (newly diagnosed infections) by the number of people in the population under surveillance and multiplying by 100,000. This calculation allows for direct comparisons with incidences of other illnesses. For example, an incidence of 16 cases per 100,000 people per year means there were 16 cases of that infection for every 100,000 people in the population under surveillance in that year.
FoodNet Fast provides incidence by year, pathogen, and geographic area.
Yes. FoodNet’s surveillance area includes the states of Colorado, Connecticut, Georgia, Maryland, Minnesota, New Mexico, Oregon, Tennessee, and selected counties in California and New York.
You can specify one of these geographic areas in your search. Keep in mind that information may not be available for some areas prior to 2004. Learn more about FoodNet’s surveillance area.
“Travel-associated infections” are infections detected in people who traveled outside of the United States during a specific number of days before illness began, suggesting the infection was acquired abroad. The time frames are:
- 30 days for Listeria, Salmonella Typhi, and Salmonella Paratyphi
- 15 days for Cryptosporidium and Cyclospora
- 7 days for all other pathogens
FoodNet has been collecting this information since 2004. FoodNet Fast displays “N/A” if the search request includes earlier years.
“Outbreak-associated infections” are infections linked to an outbreak. CDC defines an outbreak as the occurrence of two or more people with a similar illness resulting from a common exposure. FoodNet has been collecting this information since 2004. FoodNet Fast displays “N/A” if the search request includes earlier years.
FoodNet Fast contains data on infections caused by more than 200 Salmonella serotypes. The top 100 serotypes reported since 1996 are displayed by name.
Top 100 serotypes
- To display information for one or more of the top 100 serotypes, click on the box next to the serotype’s name in the filter. This feature can be used to compare serotypes.
- To display information for the top 10 serotypes since 1996, click on the “Top 10” filter.
Other serotypes
- Serotypes not in the top 100 are combined into the “Other serotype” category.
- Information for individual serotypes in this category cannot be displayed, does not appear in the filter, and is not available using the search function.
Serotype unknown
FoodNet Fast also includes information on Salmonella infections for which the serotype is unknown. These fall into two categories:
- CIDT+ (not serotyped): This category includes information on infections diagnosed by CIDT and reported without serotype information because culture was not performed, or culture was performed but Salmonella could not be isolated.
- Not serotyped: This category includes information on culture-confirmed Salmonella infections in which no attempt was made to determine the serotype, or the serotype could not be determined.
These categories do not appear in the filter or search box.
FoodNet Fast contains data on STEC serogroup O157 and more than 100 non-O157 STEC serogroups reported to FoodNet since 1996.
O157 serogroup
- To display information for O157, click on the box next to its name in the filter.
Non-O157 serogroups
Top 25 non-O157 STEC serogroups
- To display information for one or more of the top 25 non-O157 STEC serogroups, click on the box next to each serogroup name in the filter. This feature can be used to compare serogroups.
Other non-O157 serogroups
- Serogroups not in the top 25 are combined into the “Other non-O157” category.
- Information for individual serogroups in this category cannot be displayed, does not appear in the filter, and is not available using the search function.
Serogroup unknown
FoodNet Fast also includes information on STEC for which the serogroup is unknown. These fall into three categories:
- CIDT+ (not serogrouped): This category includes information on infections diagnosed by CIDT and reported without serotype information because culture was not performed, or culture was performed but STEC could not be isolated.
- Not serogrouped: This category includes information on culture-confirmed STEC infections in which no attempt was made to determine the serogroup, or the serogroup could not be determined.
- Non-O157, not serogrouped: This category includes information on culture-confirmed STEC infections for which serogroup O157 was ruled out, but the non-O157 serogroup was not reported.
These categories do not appear in the filter or search box.
Tips and Tricks
The default view includes data for all pathogens since 1996. You can customize your search using the following filters:
- Pathogen: Select one or more pathogens.
- Test method: For bacterial infections, select either “All test methods” or “Culture-confirmed.”
- Subgroups: Select one or more subgroups (species, serogroup, or serotype). Because CIDTs do not provide subgroup information, this filter is available only for culture-confirmed bacterial pathogens.
- Year: Select one or more years using the filter or slider at the top of the screen.
- Age group: Specify one or more age groups.
- Sex: Select male, female, or both.
- Race: Specify one or more races.
- Geographic location: Specify one or more FoodNet sites.
When you select a single pathogen, you will see graphs showing data on infections:
- Incidence by year and by test method
- Percentage by month
- Percentage by subgroup (species, serogroup, or serotype)
- Incidence by age group, sex, race, and ethnicity (demographics)
- Use the dropdown menu at the top of the graph to display data on infections (the default setting), hospitalizations, deaths, outbreak-associated infections, and travel-associated infections
- Incidence by geographic area
A section under the “Incidence of Infections by Year” graph summarizes infections for each search. It includes number; incidence; and percentages hospitalized, died, outbreak-associated, and travel-associated.
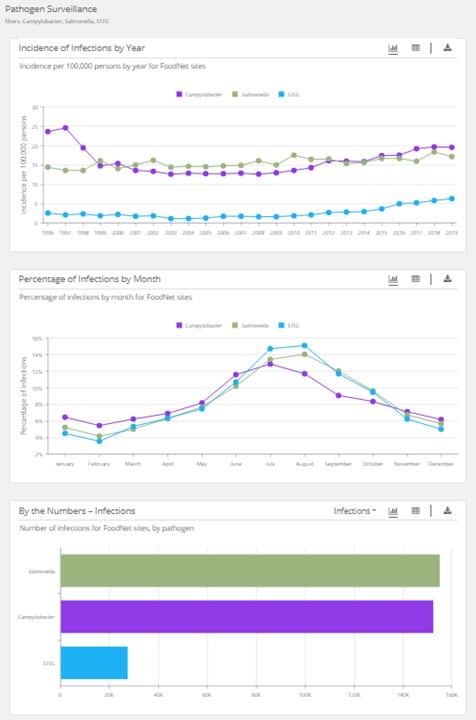
When you select more than one pathogen, you will see graphs showing data on infections:
- Incidence by year
- Percentage by month
- Number by pathogen
- Use the dropdown menu at the top of the graph to display data on infections (the default setting), hospitalizations, and deaths
The filter for “Test Method” is not available when selecting multiple pathogens.
The default view includes data for all pathogens. You can remove a pathogen from all graphs and charts by unselecting it in the filters. You can add a pathogen to all graphs and charts by selecting it in the filters.
You can remove a pathogen from a single graph or chart by clicking on its name in the legend. The pathogen’s name will fade—click on it again to add it back.
When a single bacterial pathogen is selected, the default view for the “Incidence by year” chart displays test methods. Click on the test method to remove it or add it back to the chart.
