At a glance
- Infections reported to FoodNet increased or were similar to the number of infections reported for 2016–2018.
- Use of culture-independent diagnostic tests (CIDT) continues to increase compared with 2016–2018.
- More work is needed to reduce the burden of enteric disease.

Overview
Background
Documenting the major sources of and trends in foodborne illness provides important information needed to determine whether prevention measures are working.
FoodNet reports on the number of infections in its surveillance area from pathogens transmitted commonly through food: Campylobacter, Cyclospora, Listeria, Salmonella, Shiga toxin-producing E. coli (STEC), Shigella, Vibrio, and Yersinia.
Laboratory tests, including cultures and culture-independent diagnostic tests (CIDTs), detected these pathogens.
The latest data
This page summarizes FoodNet's 2024 preliminary surveillance data. It describes incidence of enteric (intestinal) infection for pathogens in 2024 compared with the average incidence for 2016–2018, the reference period used to monitor progress toward food safety goals. This page also summarizes pediatric cases of hemolytic uremic syndrome (HUS) for 2023.
To calculate incidence, FoodNet tracks the number of reported infections per 100,000 people per year.
Key findings
Reported infections
Among the infections, 20,693 (84%) were acquired domestically and accounted for 6,201 hospitalizations (92%) and 164 deaths (92%). The rest were linked to international travel.
General trends
Infections reported to FoodNet in 2024 either increased or were similar to the number of infections reported for 2016–2018.
All infections
Compared with 2016–2018, in 2024
Cyclospora, Shigella, STEC, Vibrio, and Yersinia
Listeria and Salmonella
Domestically acquired infections only
Compared with 2016–2018, in 2024
Incidence increased for
Shigella, STEC, Vibrio, and Yersinia
Incidence was similar for
Cyclospora, Listeria, and Salmonella
Campylobacter infections
Campylobacter has historically been the leading cause of infections monitored by FoodNet. However, a change in reporting requirements for the pathogen reduced reports.
11,926 Campylobacter infections, 2,482 hospitalizations, and 49 deaths reported to FoodNet
4,312 Campylobacter infections, 929 hospitalizations, and 27 deaths reported to FoodNet
Because of the reporting changes, we cannot compare 2024 Campylobacter data to the 2016–2018 reference period or calculate the incidence of infections.
Salmonella infections
Among 9,219 Salmonella infections reported, 7,314 (79%) infections had positive culture results.
Among the positive culture results, laboratories fully serotyped 6,066 (83%) isolates. The most common serotypes detected were
- Enteritidis (1,535 infections, 21% of infections with positive culture results)
- Newport (582, 8%)
- Typhimurium (515, 7%)
- Javiana (433, 6%)
- I 4,[5],12:i:- (270, 4%)
These serotypes have remained the most common since 2010.
STEC infections
Among 3,635 STEC infections reported, 1,373 (38%) infections had positive culture results. The O antigen was determined for 1,084 (79%) isolates.
The most common serogroups were
- O157 (316 infections, 23% of the cultured isolates)
- O103 (210, 15%)
- O26 (148, 11%)
- O111 (124, 9%)
- O121 (44, 3%)
CIDT-diagnosed bacterial infections*
- 78% of bacterial infections were diagnosed by CIDT in 2024, compared with 47% in 2016–2018.
- Among the patient samples that were cultured after a positive CIDT result, 59% were positive in 2024, compared with 71% in 2016–2018.
- Among bacterial infections diagnosed by only one method,
- 41% were diagnosed by CIDT only in 2024, compared with 21% in 2016–2018, and
- 22% were diagnosed by culture only, compared with 53% in 2016–2018.
More information on CIDTs is available in table 2.
*These data exclude Campylobacter because of a change in reporting.
Hemolytic uremic syndrome
During 2023, FoodNet sites reported 46 cases of postdiarrheal hemolytic uremic syndrome (HUS) in people younger than 18 years, including 24 among children younger than 5 years.
Looking ahead
More work is needed to reduce the burden of enteric disease. Achieving that goal will require continued surveillance, improved prevention strategies, and strong local, state, federal, and nongovernmental partnerships.
What can be done
- Continuing surveillanceContinued surveillance can help us better understand how laboratory testing practices are affecting the number of reported infections.
- Culturing samplesLaboratories can provide information key to guiding public health decisions by culturing patient samples after receiving a positive CIDT result.
- Improving CIDTsCIDT developers can help by ensuring new CIDTs are compatible with culture-based methods, so culture can be attempted following a positive CIDT result.
What's being done
Since 1996, FoodNet has been counting cases and tracking trends for infections transmitted commonly through food.
Information gathered on which illnesses are decreasing, and which are increasing, provides a foundation for food safety policy and prevention efforts.
FoodNet's surveillance data show where efforts are needed to reduce foodborne illnesses.
CDC uses the best scientific methods and information available to monitor, investigate, control, and prevent foodborne illness. Using epidemiology and laboratory science, CDC assesses public health threats. CDC works closely with state health departments to monitor the frequency of specific diseases and to conduct national surveillance for diseases it monitors.
CDC collaborates with public health partners, including state health departments, FDA, and USDA, to conduct epidemiologic and laboratory investigations to determine the causes of food safety threats and ways to control them.
CDC works with regulatory agencies to help develop robust food safety policies and assess effectiveness of current prevention efforts. CDC provides independent scientific assessment of threats, control measures, and knowledge gaps.
Government regulation related to food safety is the responsibility of FDA, USDA's Food Safety and Inspection Service (USDA-FSIS), the National Marine Fisheries Service (NOAA Fisheries), and other regulatory agencies. Visit the websites below to learn about each agency's actions and activities to improve food safety.
CDC works closely with regulatory agencies as they, along with industry, develop and implement measures to make our food safer.
Follow the four steps to food safety — clean, separate, cook, and chill — to help protect yourself and your loved ones when preparing food at home.
Know which foods are more likely to make you sick, especially if you are at higher risk for severe foodborne illness. Higher risk groups include children younger than 5, pregnant women, adults over 65, and people with weakened immune systems.
Watch for food recalls and foodborne outbreak notices and throw away recalled foods.
The data: Table 1
| Pathogen | Infections, 2024, No.§ | No. (%) | Crude average incidence,§§ 2016–2018 | Estimated Incidence, 2024 | IRR (95% CrI)*** | |||
|---|---|---|---|---|---|---|---|---|
| Hospitalizations, 2024¶ | Deaths, 2024** | Outbreak-associated infections, 2024†† | Crude¶¶ | Estimated (95% CrI)*** | ||||
| All cases (including international travel-associated)††† | ||||||||
| Campylobacter§§§ | 4,312 | 929 (21.5) | 27 (0.6) | 29 (0.7) | 18.2 | — **** | — **** | — **** |
| Salmonella¶¶¶ | 9,219 | 2,769 (30.0) | 63 (0.7) | 489 (5.3) | 16.9 | 18.0 | 16.79 (15.85, 17.86) |
1.03 (0.99, 1.10) |
| S. Enteritidis | 1,535 | 422 (27.5) | 11 (0.7) | 114 (7.4) | 2.6 | 3.0 | 2.95 (2.66, 3.26) |
1.13 (1.00, 1.26) |
| S. Newport | 582 | 173 (29.7) | 2 (0.3) | 15 (2.6) | 1.6 | 1.14 | 1.22 (0.95, 1.58) |
0.78 (0.57, 1.04) |
| S. Typhimurium | 515 | 160 (31.1) | 4 (0.8) | 45 (8.7) | 1.4 | 1.01 | 1.03 (0.93, 1.14) |
0.72 (0.64, 0.80) |
| S. Javiana | 433 | 142 (32.8) | 1 (0.2) | 5 (1.2) | 1.2 | 0.85 | 0.78 (0.59, 1.03) |
0.64 (0.45, 0.86) |
| S. I 4,[5],12:i:- | 270 | 73 (27.0) | 3 (1.1) | 17 (6.3) | 0.9 | — **** | — **** | — **** |
| Other Salmonella serotypes | 2,731 | 915 (33.5) | 17 (0.6) | 251 (9.2) | 5.9 | — **** | — **** | — **** |
| Salmonella, not serotyped | 3,153 | 884 (28.0) | 25 (0.8) | 42 (1.3) | 2.6 | 6.22 | 5.67 (4.93, 6.52) |
2.15 (1.79, 2.56) |
| STEC | 3,635 | 809 (22.3) | 21 (0.6) | 157 (4.3) | 4.7 | 7.1 | 7.02 (6.28, 7.88) |
1.30 (1.13, 1.47) |
| STEC O157†††† | 316 | 125 (39.6) | 2 (0.6) | 113 (35.8) | 0.8 | 0.62 | 0.59 (0.52, 0.67) |
0.70 (0.60, 0.80) |
| STEC non-O157†††† | 1,026 | 182 (17.7) | 6 (0.6) | 28 (2.7) | 2.1 | 2.00 | 2.12 (1.85, 2.43) |
1.03 (0.87, 1.20) |
| STEC, not serogrouped§§§§ | 2,293 | 502 (21.9) | 13 (0.6) | 16 (0.7) | 2.1 | — **** | — **** | — **** |
| Shigella | 4,057 | 1,380 (34.0) | 15 (0.4) | 307 (7.6) | 4.8 | 7.9 | 6.77 (5.62, 8.31) |
1.35 (1.11, 1.65) |
| Yersinia | 1,782 | 443 (24.9) | 16 (0.9) | 0 (0.0) | 0.8 | 3.5 | 3.48 (3.06, 3.99) |
2.62 (2.23, 3.07) |
| Vibrio | 720 | 179 (24.9) | 6 (0.8) | 6 (0.8) | 0.7 | 1.4 | 1.34 (1.18, 1.53) |
1.48 (1.31, 1.67) |
| Listeria | 182 | 175 (96.2) | 27 (14.8) | 26 (14.3) | 0.3 | 0.4 | 0.33 (0.29, 0.38) |
1.17 (1.00, 1.34) |
| Cyclospora | 717 | 62 (8.6) | 3 (0.4) | 26 (3.6) | 0.3 | 1.4 | 1.75 (1.18, 1.83) |
2.06 (1.18, 3.29) |
| Total | 24,624 | 6,746 (27.4) | 178 (0.7) | 1,040 (4.2) | — **** | — **** | — **** | — **** |
| Domestically acquired cases only¶¶¶¶ | ||||||||
| Campylobacter§§§ | 3,837 | 897 (23.4) | 27 (0.7) | 29 (0.8) | 15.8 | — **** | — **** | — **** |
| Salmonella¶¶¶ | 7,811 | 2,483 (31.8) | 59 (0.8) | 473 (6.1) | 14.8 | 15.3 | 14.48 (13.65, 15.43) |
1.00 (0.94, 1.05) |
| S. Enteritidis | 1,149 | 362 (31.5) | 10 (0.9) | 107 (9.3) | 2.1 | — **** | — **** | — **** |
| S. Newport | 533 | 163 (30.6) | 2 (0.4) | 15 (2.8) | 1.5 | — **** | — **** | — **** |
| S. Typhimurium | 466 | 151 (32.4) | 3 (0.6) | 43 (9.2) | 1.4 | — **** | — **** | — **** |
| S. Javiana | 413 | 138 (33.4) | 1 (0.2) | 5 (1.2) | 1.2 | — **** | — **** | — **** |
| S. I 4,[5],12:i:- | 229 | 65 (28.4) | 3 (1.3) | 17 (7.4) | 0.8 | — **** | — **** | — **** |
| Other Salmonella serotypes | 2,289 | 787 (34.4) | 16 (0.7) | 244 (10.7) | 4.8 | — **** | — **** | — **** |
| Salmonella, not serotyped | 2,732 | 817 (29.9) | 24 (0.9) | 42 (1.5) | 2.4 | — **** | — **** | — **** |
| STEC | 2,955 | 727 (24.6) | 18 (0.6) | 149 (5.0) | 4.1 | 5.28 | 5.23 (4.86, 5.67) |
1.15 (1.06, 1.24) |
| STEC O157 | 297 | 118 (39.7) | 2 (0.7) | 111 (37.4) | 0.8 | — **** | — **** | — **** |
| STEC non-O157 | 822 | 163 (19.8) | 5 (0.6) | 25 (3.0) | 1.7 | — **** | — **** | — **** |
| STEC, not serogrouped | 1,836 | 446 (24.3) | 11 (0.6) | 13 (0.7) | 1.8 | — **** | — **** | — **** |
| Shigella | 3,203 | 1,269 (39.6) | 11 (0.3) | 305 (9.5) | 4.1 | 6.26 | 5.24 (4.29, 6.57) |
1.26 (1.03, 1.54) |
| Yersinia | 1,680 | 437 (26.0) | 16 (1.0) | 0 (0.0) | 0.7 | 3.28 | 3.30 (2.90, 3.77) |
2.60 (2.22, 3.03) |
| Vibrio | 629 | 161 (25.6) | 5 (0.8) | 6 (1.0) | 0.6 | 1.23 | 1.17 (1.04, 1.34) |
1.44 (1.27, 1.63) |
| Listeria | 178 | 171 (96.1) | 26 (14.6) | 26 (14.6) | 0.26 | 0.35 | 0.32 (0.28, 0.37) |
1.11 (1.00, 1.22) |
| Cyclospora | 400 | 56 (14.0) | 2 (0.5) | 25 (6.3) | 0.3 | 0.78 | 1.21 (0.75, 2.38) |
1.75 (1.00, 3.08) |
| Total | 20,693 | 6,201 (30.0) | 164 (0.8) | 1,013 (4.9) | — **** | — **** | — **** | — **** |
Abbreviations: CIDT = culture-independent diagnostic test; CrI = credible interval; IRR = incidence rate ratio; NA = not applicable; STEC = Shiga toxin-producing Escherichia coli.
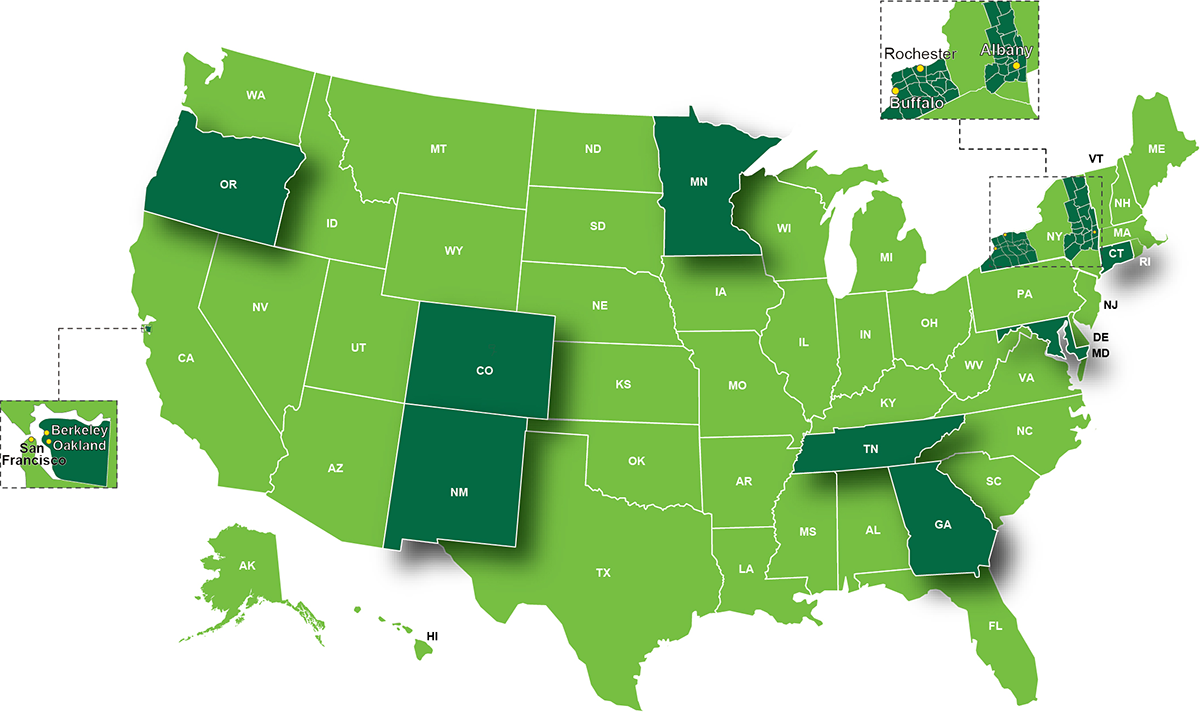
*When FoodNet was founded in 1995, the catchment included Minnesota and Oregon and counties in California (two), Connecticut (two), and Georgia (eight). The catchment expanded consistently during 1996–2004; it remained stable during 2004–2022. The historic catchment includes sites under surveillance since 2004, including Connecticut, Georgia, Maryland, Minnesota, New Mexico, Oregon, and Tennessee, and counties in California (three), Colorado (seven), and New York (34). To facilitate comparability with past FoodNet reports, data for the historic catchment are presented in-text.
† Case data for 2024 are preliminary.
§ Bacterial infections were diagnosed using culture or culture-independent diagnostic tests. Cyclospora infections were diagnosed using microscopy or polymerase chain reaction.
¶ Admission to an inpatient unit or an observation stay of >24 hours ≤7 days before or after specimen collection or determined to be related to the infection if beyond this time frame. The average percentage of infections resulting in hospitalizations during 2016–2018, by pathogen, were Campylobacter (20%), Salmonella (27%), STEC (22%), Shigella (24%), Yersinia (26%), Vibrio (30%), Listeria (96%), Cyclospora (6%), and overall (24%). Infections with unknown hospitalization status (9% of infections during 2024 and 4% during 2016–2018) were included in the denominator only.
** Attributed to infection when death occurred during hospitalization or ≤7 days after specimen collection from nonhospitalized patients. The average percentage of infections resulting in death during 2016–2018 were, by pathogen, Campylobacter (0.4%), Salmonella (0.4%), STEC (0.4%), Shigella (0.1%), Yersinia (1.2%), Vibrio (2.1%), Listeria (18.6%), Cyclospora (0.2%), and overall (0.5%). Infections with unknown death status (2% of infections during 2024 and 3% during 2016–2018) were included in the denominator only.
††Generally defined as two or more cases of similar illness associated with a common exposure; some sites also stipulate illnesses be from one or more households. The average percentage of outbreak-associated infections during 2016–2018 were, by pathogen, Campylobacter (<1%), Salmonella (7%), STEC (4%), Shigella (5%), Yersinia (<1%), Vibrio (4%), Listeria (5%), Cyclospora (24%), and overall (4%).
§§Cases per 100,000 persons.
¶¶Crude incidence is unadjusted and is calculated as cases of infection per 100,000 persons.
*** A Bayesian, negative binomial model with penalized thin plate splines adjusting for state-specific trends was used to quantify adjusted incidence in 2024 and the IRR in 2024 compared with average incidence during 2016–2018. Incidence during 2024 was described as increased or decreased compared with 2016–2018 if the 95% CrI for the IRR did not include 1. A 95% CrI is analogous to a 95% Confidence Interval (CI) in frequentist statistics and can be interpreted similarly, meaning a 95% probability of the true IRR for incidence in 2024 compared with average annual incidence during 2016–2018 is within the 95% CrI.
††† Includes both international travel–associated infections and domestically acquired infections.
§§§ Starting in 2024, only Campylobacter infections diagnosed by culture were collected by FoodNet. This is a change to previous years in which infections diagnosed by culture or CIDT test results were collected. Due to this change, the number of Campylobacter infections during 2024 are not comparable to previous years and could not be included in trend modeling to calculate incidence rates for 2024.
¶¶¶Salmonella infections that were not serotyped include all cases that were diagnosed by CIDT only, CIDT-diagnosed cases that failed to yield an isolate during culture, and cases that yielded an isolate (both culture and CIDT-diagnosed) where the isolate was partially serotyped or not serotyped. IRRs were not calculated for Salmonella serotypes.
**** Dashes indicate that the given data point was unknown, not reported, otherwise missing from the FoodNet data, or was not quantified.
†††† Incidences for STEC O157 and overall STEC non-O157 represent only a proportion of the total STEC incidence because 1,373 (38%) infections yielded an isolate, and only 1,342 (37%) were fully serogrouped and classified as STEC O157 or STEC non-O157 during 2024. IRRs were not calculated for STEC serogroups.
§§§§ The most frequently detected non-O157 serogroups were O103 (210) and O26 (148).
¶¶¶¶ Includes only domestically acquired infections (those for which the patient had no history of international travel or unknown travel history).
The data: Table 2
| Pathogen | Total infections, No. | Diagnosis method | ||||||||
|---|---|---|---|---|---|---|---|---|---|---|
| CIDT | Infections diagnosed by Culture only, No. (%)** | |||||||||
| All infections diagnosed by CIDT,¶ No. (%)** | Infections diagnosed by CIDT with positive culture, No. (%)†† | Infections diagnosed by CIDT only, No. (%)** | ||||||||
| 2024 | Average 2016–2018 | 2024 | Average 2016–2018 | 2024 | Average 2016–2018 | 2024 | Average 2016–2018 | 2024 | Average 2016–2018 | |
| Campylobacter§§ | 4,312 | 9,326 | 2,795 (64.8) |
4,956 (53.1) |
2,795 (100.0) |
1,637 (55.4) |
0 (0.0) |
3,318 (35.6) |
1,517 (35.2) |
4,370 (46.9) |
| Salmonella | 9,219 | 8,430 | 5,885 (63.8) |
2,505 (29.7) |
3,980 (79.9) |
1,726 (87.6) |
1,905 (20.7) |
780 (9.2) |
3,334 (36.2) |
5,925 (70.3) |
| STEC | 3,635 | 2,650 | 3,635 (100.0) |
2,639 (99.6) |
1,373 (48.7) |
1,498 (64.8) |
2,262 (62.2) |
1,141 (43.1) |
0 (0.0) |
11 (0.4) |
| Shigella | 4,057 | 2,511 | 3,399 (83.8) |
1,232 (49.1) |
1,300 (46.2) |
497 (58.1) |
2,099 (51.7) |
736 (29.3) |
658 (16.2) |
1,279 (50.9) |
| Yersinia | 1,782 | 431 | 1,650 (92.6) |
299 (69.5) |
269 (31.8) |
99 (48.0) |
1,381 (77.5) |
200 (46.5) |
132 (7.4) |
132 (30.5) |
| Vibrio | 720 | 391 | 587 (81.5) |
175 (44.6) |
100 (25.3) |
55 (37.6) |
487 (67.6) |
120 (30.7) |
133 (18.5) |
217 (55.4) |
| Listeria | 182 | 140 | 45 (24.7) |
6 (4.0) |
38 (95.0) |
5 (88.2) |
7 (3.8) |
1 (0.5) |
137 (75.3) |
134 (96.0) |
| Overall (excluding Campylobacter) | 19,595 | 14,554 | 15,201 (77.6) |
6,856 (47.1) |
7,060 (59.3) |
3,879 (70.6) |
8,141 (41.5) |
2,978 (20.5) |
4,394 (22.4) |
7,698 (52.9) |
Abbreviations: CIDT = culture-independent diagnostic test; STEC = Shiga toxin-producing Escherichia coli.
*Bacterial infections could be diagnosed by culture-based methods only, by CIDTs only, or by CIDTs with culture. When diagnosed by CIDTs with culture, the culture could either yield an isolate or fail to yield an isolate. Because speciation and subtyping are only possible when an isolate is available, species and subtype data are only reported in the table for infections diagnosed by culture and by CIDTs with culture that yielded an isolate.
† The historic catchment area includes those sites under surveillance since 2004, including Connecticut, Georgia, Maryland, Minnesota, New Mexico, Oregon, Tennessee, and selected counties in California (three), Colorado (seven), and New York (34).
§2024 data are preliminary.
¶ Includes cases diagnosed by CIDTs only or by CIDTs with either a positive or negative culture.
** Denominator is total number of infections for the corresponding pathogen and time-period in the table's second column (Total infections, No.).
†† Denominator is number of infections with culture performed following a positive CIDT, not shown in table.
– 2024: Campylobacter – 2,795, Salmonella –4,983, STEC – 2,818, Shigella – 2,813, Yersinia – 847, Vibrio – 395, Listeria – 40, Overall excluding Campylobacter – 11,896
– 2016–2018: Campylobacter – 2,953, Salmonella – 1,969, STEC – 2,311, Shigella – 854, Yersinia – 206, Vibrio – 145, Listeria – 6, Overall excluding Campylobacter – 5,492
§§Starting in 2024, only Campylobacter infections diagnosed by culture were collected by FoodNet. This is a change to previous years in which infections diagnosed by culture or CIDT test results were collected. Because of this change, we cannot compare the number of Campylobacter infections reported to FoodNet during 2024 with previous years, did not calculate incidence, and did not perform trend analyses. We also excluded Campylobacter from the overall calculations in the bottom row of the table.
About the data
In the past, FoodNet collected data on Campylobacter infections diagnosed by
- Culture only
- CIDT and confirmed by culture
- CIDT only
As of 2024, FoodNet no longer collects data on Campylobacter infections diagnosed by CIDT only.
Because of this change, we cannot compare the number of Campylobacter infections reported to FoodNet during 2024 with previous years, did not calculate incidence, and did not perform trend analyses.
FoodNet's surveillance area expanded during 2023 to include all of Colorado.
The expansion increased representation for specific populations, including
- People identifying as Hispanic, American Indian/Alaska Native, Native Hawaiian/Pacific Islander, or as more than 1 race or ethnicity, and
- People living in rural counties.
Increased representation improves FoodNet's ability to monitor disease trends and makes FoodNet data more applicable to a larger population.
Compared with 2016–2018, incidence of infection increased for some pathogens in 2024 and remained stable for others.
Although assessing various factors that affect incidence can be complicated, several factors are likely responsible for the changes, including
- More sick people might have been tested because CIDTs are fast and easy to use.
- Increased use of CIDTs might have allowed laboratories to detect infections that would have previously been missed.
- People might have had more exposure to some pathogens.
How CIDT use affected incidence of infections in 2024
Use of CIDTs continues to increase, leading to increased detection of infections.
Most of these are true infections that, without use of CIDTs, would have been missed. Some infections, including those caused by STEC, Vibrio, and Yersinia, are harder to detect by traditional methods (e.g., culture).
Before widespread use of CIDTs, many patient samples were not tested for these infections and, when they were tested, false negative results were frequent.
CIDTs are likely not the only factor that affected the number of reported infections in 2024. For infections caused by some pathogens, increases in incidence appear to outpace increased CIDT usage.
Why 2016–2018 is the reference period
FoodNet sets a reference period that can be used for many years to monitor progress toward food safety goals. FoodNet used 1996–1998 and 2006–2008 as reference periods in earlier reports. These specific reference periods were chosen to align with the HHS Healthy People initiative.
Data source
FoodNet conducts active, population-based surveillance for laboratory-diagnosed Campylobacter, Cyclospora, Listeria, Salmonella, Shigella, STEC, Vibrio, and Yersinia infections and pediatric HUS at 10 U.S. sites.
Laboratory testing and data collection
Bacterial infections were diagnosed by CIDT or culture. Cyclosporiasis was diagnosed by polymerase chain reaction or microscopy.
If the ill person did not report international travel or had an unknown travel history, the illness was considered to have been domestically acquired. A history of international travel was defined as travel ≤30 days before onset of listeriosis, typhoid fever, or paratyphoid fever; ≤14 days before onset of cyclosporiasis; and ≤7 days before onset of other illnesses.
Estimating changes in the incidence of infections
Incidence (cases per 100,000 persons) was calculated by dividing number of infections during 2024 by 2023 U.S. Census Bureau population estimates.
FoodNet uses a Bayesian model to estimate changes in the incidence of infections. The model uses the average annual incidence for 2016–2018 for comparisons. This model adjusts for site-specific trends, reduces sensitivity to single-year events (e.g., outbreaks), and reduces biases towards more populous sites.
Incidence in 2024 was considered substantially different from 2016–2018 incidence if the 95% credible interval (CrI) for the incidence rate ratio (IRR) did not include 1.0. In contrast to frequentist statistics, which use significance testing, in a Bayesian model, true significance testing is not done, and differences are described as substantial.
Explore more
- 2023 preliminary FoodNet data: See last year's report
- FoodNet Fast: Access data reported to FoodNet since 1996
- Syndromic gastrointestinal panel diagnostic tests have changed our understanding of the epidemiology of Yersinia enterocolitica—FoodNet, 2010–2021. Ray LC, Payne DC, Rounds J, et al. Open Forum Infect Dis. 2024; 11(6): ofae199.
- Effect of culture-independent diagnostic tests on future Emerging Infections Program surveillance. Langley G, Besser J, Iwamoto M, et al. Emerg Infect Dis. 2015; 21(9): 1582–8.
- Evidence of false positivity for Vibrio species tested by gastrointestinal multiplex PCR panels, Minnesota, 2016–2018. Decuir M, Fowler RC, Cebelinski E, et al. Open Forum Infect Dis. 2021; 8(6): ofab247.