Purpose
This page outlines the history of FoodNet, including the expansion of the surveillance area, some of the important studies and surveys conducted, and the data tools created.
The history of FoodNet
1995
- With support from USDA's Food Safety and Inspection Service (FSIS), CDC establishes the Foodborne Diseases Active Surveillance Network (FoodNet), an active, population-based sentinel surveillance system to track trends for infections transmitted commonly through food.
- FoodNet conducts an initial survey of clinical laboratory practices, providing a foundation for monitoring changes in laboratory practices over time.
1996
- FoodNet becomes a collaboration among CDC, FSIS, the Food and Drug Administration (FDA), and several state and local health departments.
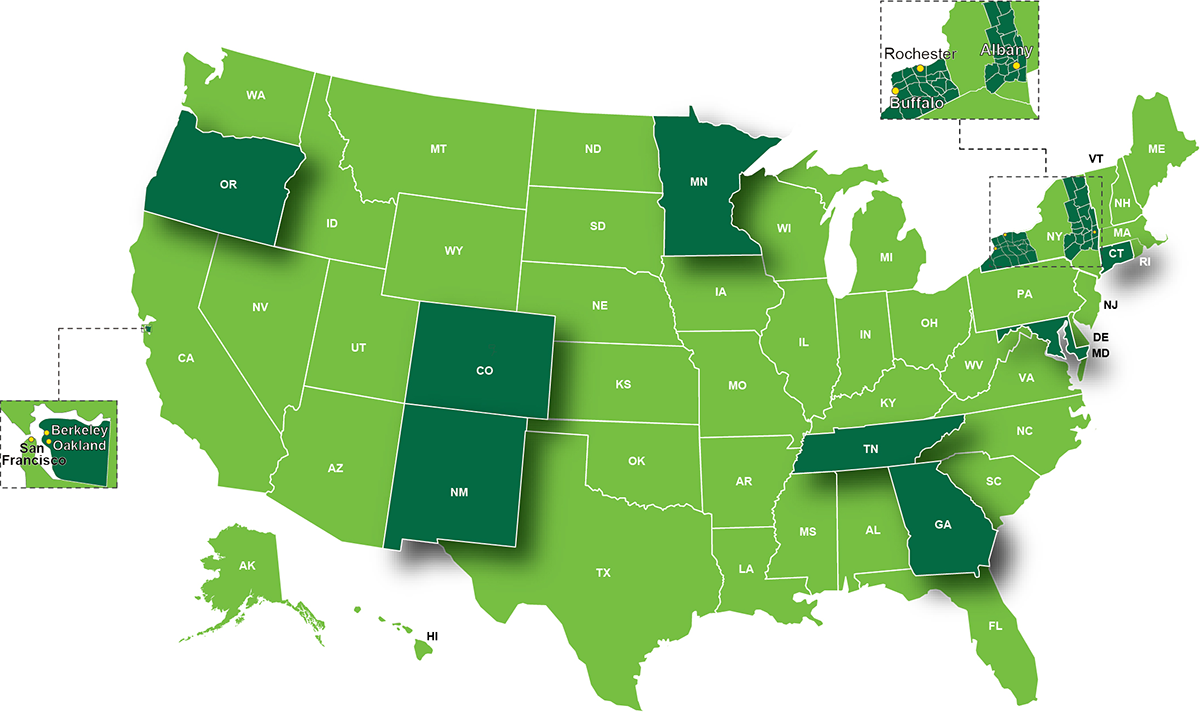
- FoodNet begins conducting surveillance for infections caused by Campylobacter, Listeria, Salmonella, Shiga toxin-producing E. coli (STEC) O157, Shigella, Vibrio, and Yersinia bacteria in five surveillance sites:
- Minnesota, Oregon, and selected counties in California (Alameda, San Francisco), Connecticut (Hartford, New Haven), and Georgia (Clayton, Cobb, Dekalb, Douglas, Fulton, Gwinnett, Newton, and Rockdale).
- The five sites cover 14.3 million people representing 5% of the U.S. population.
- FoodNet launches its first population survey to collect information on how often people are exposed to sources of diarrheal illness, how often people get these illnesses, and how often they seek medical care for them.
- FoodNet conducts its first physician survey to understand practices regarding the diagnosis of acute diarrheal diseases.
- FoodNet conducts a case-control study to identify risk factors for non-typhoidal Salmonella serogroup B or D infection.
1997
- FoodNet adds 12 counties in Georgia to its surveillance area. FoodNet's five sites now cover a combined population of 16.1 million people representing 6% of the U.S. population.
- A second clinical laboratory practices survey is conducted.
- FoodNet conducts a case-control study to identify risk factors for STEC O157:H7 infection.
- FoodNet begins conducting surveillance for infections caused by the parasites Cyclospora and Cryptosporidium.
- Surveillance also begins for cases of pediatric hemolytic uremic syndrome (HUS), a life-threatening complication of STEC infection.
1998
- FoodNet expands its surveillance area to include seven counties in New York and six in Maryland. It also adds six more counties in Connecticut. The seven sites cover a combined population of 20.7 million people representing 8% of the U.S. population.
- A second population survey is launched.
- FoodNet conducts a case-control study to identify risk factors for Campylobacter infection.
1999
- FoodNet adds eight counties in New York and the remaining 139 counties in Georgia. The seven sites cover a combined population of 25.9 million people, representing 9% of the U.S. population.
- FoodNet conducts a case-control study to identify sources and risk factors for Cryptosporidium infection.
2000
- FoodNet begins conducting surveillance for STEC non-O157.
- FoodNet expands its surveillance area to include 11 counties in Tennessee. It also adds one more county in California. The eight sites cover a combined population of 30.6 million people, representing 11% of the U.S. population.
- FoodNet launches its third population survey and conducts its third clinical laboratory practices survey.
- FoodNet conducts a second STEC O157 case-control study to identify risk factors for STEC O157:H7 infection.
- FoodNet conducts a case-control study to identify risk factors for sporadic (non-outbreak-related) Listeria infections.
- FoodNet conducts a survey to learn about the knowledge, attitudes, and practices of physicians as food safety educators.
2001
FoodNet expands its surveillance area to include five counties in Colorado.
The nine sites cover a combined population of 34.8 million people, representing 12% of the U.S. population.
2002
- FoodNet adds two more counties in Colorado, 15 in Maryland, and three in New York. The nine sites cover a combined population of 37.9 million people, representing 13% of the U.S. population.
- FoodNet launches its fourth population survey. This survey is the first conducted in both English and Spanish.
- FoodNet conducts a retrospective cohort study to examine the reduced susceptibility of Salmonella Typhi infections to fluoroquinolones.
- FoodNet conducts a case-control study to identify risk factors for Salmonella infection in infants younger than 2 months.
- FoodNet conducts a case-control study to identify behavioral, dietary, and medical risk factors for Campylobacter infection in infants.
- FoodNet conducts a case-control study to determine sources and risk factors for Salmonella Enteritidis and Salmonella Newport infections.
- Two FoodNet sites – Minnesota and Oregon – conduct a population-based study on reactive arthritis linked to Campylobacter, Salmonella, Shigella, Yersinia, and STEC infections. This study is the first in the United States to examine links between reactive arthritis and bacterial enteric infections.
2003
FoodNet adds nine more counties in New York and the remaining 11 counties in Tennessee.
The nine sites cover a combined population of 41.8 million people, representing 14% of the U.S. population.
2004
FoodNet expands its surveillance area to New Mexico. It also adds seven more counties in New York.
2005
- FoodNet conducts a survey to learn about clinical laboratory practices specific to Campylobacter.
- FoodNet conducts a survey to assess food preparation practices of long-term care facilities.
2006
- The 10 sites cover a combined population of 45.3 million people, representing 15% of the U.S. population.
- FoodNet launches its fifth population survey.
- FoodNet conducts a cohort study to evaluate patient outcomes from antibiotic-resistant Salmonella infections.
- FoodNet begins a four-year cohort study of people diagnosed with STEC O157 infection to describe exposures to antibiotics and the risk of developing HUS.
2007
FoodNet conducts a survey to learn about clinical laboratory practices to describe culture-based and culture-independent testing practices for STEC identification.
2009

- FoodNet begins collecting data on STEC and Campylobacter infections detected by culture-independent diagnostic tests (CIDTs).
- FoodNet conducts a pilot surveillance program for community-acquired Clostridioides difficile infections (formerly known as Clostridium difficile) in Connecticut and New York.
- FoodNet conducts a survey to understand physician knowledge of testing and treatment practices for STEC infections and knowledge of STEC-related HUS.
2010
FoodNet conducts a retrospective study for laboratory-confirmed Cronobacter sakazakii infections reported from 2003 through 2009.
2011
FoodNet begins collecting data on Listeria, Salmonella, Shigella, Yersinia, and Vibrio infections detected by CIDTs.
2012
FoodNet begins conducting annual surveys of clinical laboratory practices for 10 pathogens – the nine FoodNet already reports on plus norovirus.
2015
FoodNet publishes its first report on CIDTs, describing the increasing use of the tests to detect bacterial enteric infections.
2016
- FoodNet launches FoodNet Fast, an online toolbox for accessing information reported to FoodNet.
- FoodNet publishes its second report on CIDTs, describing the effects of increasing use of CIDTs on surveillance of enteric illnesses.
2018
- FoodNet ends surveillance for Cryptosporidium. Surveillance for the parasite continues through other CDC systems.
- FoodNet's surveillance area covers 50 million people, representing 15% of the U.S. population.
- FoodNet launches its sixth population survey.
2019
FoodNet expands and improves the data visualizations available on FoodNet Fast in three new modules.
- Pathogen Surveillance Tool: This dynamic visualization tool lets users see how rates of illness have changed in FoodNet's surveillance area since 1996 for nine pathogens transmitted commonly through food.
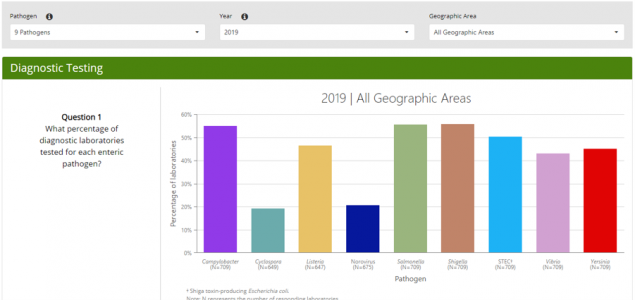
- Diagnostic Laboratory Practices Tool: Users can see how diagnostic testing practices in FoodNet's surveillance area have changed over time for 10 pathogens.
- Hemolytic Uremic Syndrome Surveillance Tool: Users can see how rates of pediatric HUS and STEC infection have changed in FoodNet's surveillance area since 1997.
2021
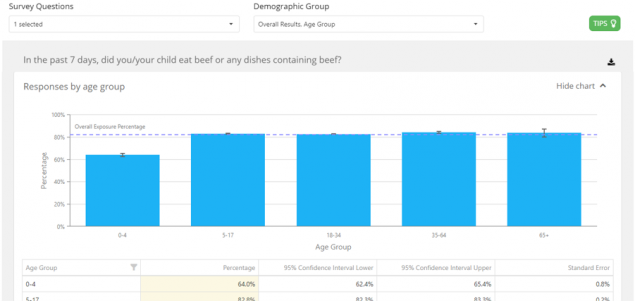
- FoodNet adds the Population Survey Tool to FoodNet Fast. Users can examine how often people in FoodNet's surveillance area eat certain foods and have other exposures linked to diarrheal illness. Users can also compare exposures for different groups of people.
- FoodNet publishes a report describing marked declines during the COVID-19 pandemic in reported infections from pathogens transmitted commonly through food.
- FoodNet adds more data to the FoodNet Fast Population Survey Tool. Users can delve into information about people's drinking water consumption, recreational water contact, and recent travel history.
2022
- FoodNet updates the Population Survey Tool, adding information about food handling practices, food safety behaviors, health-seeking behaviors, and more.
- FoodNet's surveillance area covers 51 million people, representing 15% of the U.S. population.
2023
FoodNet expands its surveillance area to include all of Colorado.
2024
- FoodNet's surveillance area covers approximately 16% of the U.S. population, which is about 54 million people.
- FoodNet starts collecting data only on culture-confirmed Campylobacter infections.
2025
Reporting for data collected on or after July 1, 2025, becomes optional for all pathogens except Salmonella and STEC. Reporting for pediatric HUS data also becomes optional.
Other CDC systems continue surveillance for the pathogens and condition.
NNDSS
CryptoNet, NNDSS
Listeria Initiative, NNDSS
LEDS, NNDSS
LEDS, NNDSS
LEDS (differentiates between O157 and non-O157), NNDSS (does not differentiate)
LEDS (differentiates between O157 and non-O157), NNDSS (does not differentiate)
NNDSS
Pediatric HUS
NNDSS (does not collect etiology information)
*Laboratory-based Enteric Disease Surveillance. LEDS collects reports of infections confirmed by state and regional public health laboratories; at this time, it does not collect data directly from FoodNet sites.
†National Notifiable Diseases Surveillance System
‡ Shiga toxin-producing Escherichia coli
§Cholera and Other Vibrio Illness Surveillance