At a glance
Overview
FoodNet determines the incidence of laboratory-confirmed infections for bacterial pathogens transmitted commonly through food. However, these reports represent only a subset of the true number of cases of diarrheal illness that occur in the community. Most diarrheal illnesses are undiagnosed and, therefore, not reported.
The FoodNet Population Survey is a periodic survey of randomly selected residents in the FoodNet surveillance area. FoodNet conducts this survey to collect information that can be used to estimate how often people in the surveillance area get acute diarrheal illness, how often they seek care for these illnesses, and how often they're exposed to things linked to diarrheal illness.
Methods
The most recent FoodNet Population Survey was conducted during 2018–2019. This survey used modernized and expanded methods, including multiple modes of administration and multiple sampling frames. It asked participants questions about basic demographics, episodes of diarrhea or vomiting, and various exposures associated with diarrheal illness in the following categories: food consumption, drinking water consumption, raw milk consumption, dietary practices, food handling practices, food safety behaviors, contact with animals, contact with recreational water, recent travel history, and health-seeking behavior.
FoodNet used two probability sampling approaches for the 2018–2019 FoodNet Population Survey:
- The first approach used random digit dialing to conduct computer-assisted telephone interviews through landline phones and cell phones.
- The second approach used address-based sampling to administer surveys online. This involved sampling from residential addresses that are listed in U.S. Postal Service delivery files.
- FoodNet allocated 30% of the surveys to the random digit dialing and 70% to address-based sampling.
FoodNet interviewed 38,743 adults and children. FoodNet attempted to recruit a child from 80% of selected households and an adult from 20% of selected households. FoodNet chose the child or adult with the next birthday to interview. If a child aged 12 years or younger was selected, a parent or guardian provided information about the child. FoodNet used weights to adjust for disproportionate sampling probabilities and the multi-mode survey design, and to better represent demographic characteristics in the surveillance area.
FoodNet conducted the first five population surveys in 12-month cycles in 1996–1997, 1998–1999, 2000–2001, 2002–2003, and 2006–2007. FoodNet conducted all interviews via landline phones, using sample designs and protocols similar to those used for CDC's nationwide Behavioral Risk Factor Surveillance Surveys (BRFSS).
FoodNet used random digit dialing and a disproportionate stratified sample method. FoodNet used post-stratification weights to adjust the distribution of the sample by age and sex to match the U.S. Census population.
Resources
This survey was conducted in English and Spanish in 10 FoodNet sites from the last days of December 2017 through July 2019. This survey was the first to use two probability sampling approaches and obtained interviews from nearly 40,000 people. In 2018, the population residing in the FoodNet surveillance area was 50 million people, representing 15% of the U.S. population.
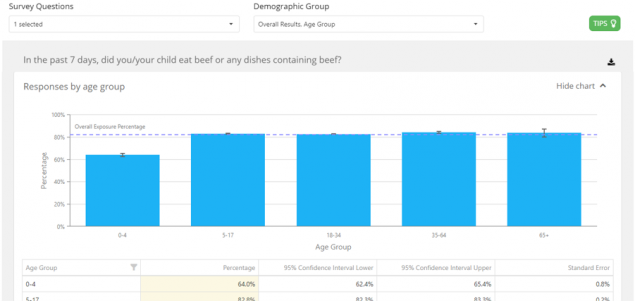
Information from the survey is available in FoodNet Fast's Population Survey Tool.
This survey was conducted in English and Spanish, in 10 FoodNet sites for 12 consecutive months, from May 2006 through April 2007. For the first time, FoodNet sent a notification letter ahead of time to inform the household about the purpose of the survey. In 2007, the population residing in the FoodNet surveillance area was 46 million people, representing 15% of the U.S. population.
Information from the survey was published in the 2006–2007 Atlas of Exposures.
This survey was conducted in English and Spanish, in 10 FoodNet sites for 12 consecutive months, from March 2002 through February 2003. In 2002, the population in the FoodNet surveillance area was 42 million people, representing 14% of the U.S. population.
Information from the survey was published in the 2002–2003 Atlas of Exposures.
This survey was conducted in English in eight FoodNet sites (California, Connecticut, Georgia, Maryland, Minnesota, New York, Oregon, and Tennessee) for 12 consecutive months, from February 2000 through January 2001. In 2000, the population of these sites was 33 million people, representing 12% of the U.S. population.
Information from the survey was published in the 2000–2001 Atlas of Exposures. Please contact foodnet@cdc.gov to request a printed copy; it is not available electronically.
This survey was conducted in English in seven FoodNet sites (California, Connecticut, Georgia, Maryland, Minnesota, New York, and Oregon) for 12 consecutive months, from February 1998 through January 1999. In 1998, the population of these sites was 29 million people, representing 11% of the U.S. population.
Information from the survey was published in the 1998–1999 Atlas of Exposures. Please contact foodnet@cdc.gov to request a printed copy; it is not available electronically.
This survey was conducted in English in five FoodNet sites (California, Connecticut, Georgia, Minnesota, and Oregon) for 12 consecutive months from July 1996 through June 1997. In 1996, the population in the sites was 14 million people, representing 8% of the U.S. population.
Information from the survey was published in the 1996–1997 Atlas of Exposures. Please contact foodnet@cdc.gov to request a printed copy; it is not available electronically.