Asthma Attacks among People with Current Asthma, 2014–2017
Nearly half the people with current asthma had one or more asthma attacks in the past 12 months
Percentage with Asthma Attacks
Children

Prevalence of Asthma Attacks among those with Current Asthma by State, Children -- 2014-2017 NHIS
Adults
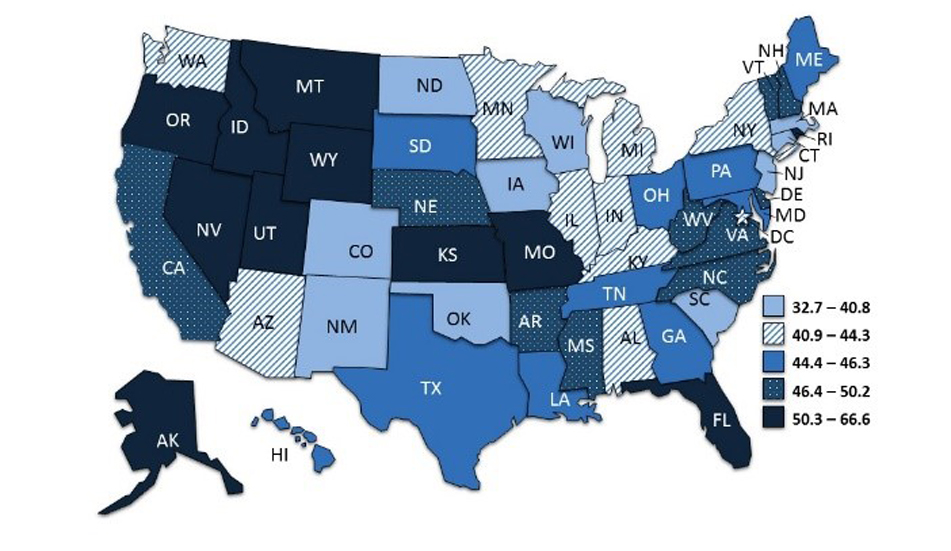
Prevalence of Asthma Attacks among those with Current Asthma by State, Adults -- 2014-2017 NHIS
In an asthma attack, the airways become inflamed, making breathing difficult. On average, 50.2% of children and 44.7% of adults with current asthma had one or more asthma attacks during 2014–2017. The percentage of asthma attacks varied by state. Among children, the median percentage was 51.0%, but it ranged from 23.1% in Nebraska to 81.7% in Wyoming. Among adults, the median percentage was 44.8%, but it ranged from 32.7% in North Dakota to 66.6% in Alaska.
CDC’s National Asthma Control Program (NACP) was created in 1999 to help the millions of people with asthma in the United States gain control over their disease. The NACP conducts national asthma surveillance and funds states to help them improve their asthma surveillance and to focus efforts and resources where they are needed.
| State | Total Asthma Attack (%) | Child Asthma Attack (%) | Adult Asthma Attack (%) |
|---|---|---|---|
| Total* | 46.0 | 50.2 | 44.7 |
| AL | 49.0 | 63.8 | 41.7 |
| AK | 66.9 | 68.1 | 66.6 |
| AZ | 38.7 | 30.9 | 40.9 |
| AR | 48.2 | 45.4 | 49.5 |
| CA | 48.0 | 53.2 | 46.4 |
| CO | 38.1 | 47.1 | 35.4 |
| CT | 41.0 | 53.4 | 34.1 |
| DE | 50.6 | 61.6 | 47.3 |
| DC | 45.0 | 50.8 | 43.2 |
| FL | 50.8 | 49.6 | 51.2 |
| GA | 48.7 | 55.7 | 45.5 |
| HI | 43.7 | 41.5 | 44.7 |
| ID | 57.3 | 61.7 | 55.9 |
| IL | 45.8 | 53.5 | 43.3 |
| IN | 44.5 | 47.1 | 43.6 |
| IA | 41.6 | 52.1 | 39.1 |
| KS | 52.2 | 54.2 | 51.3 |
| KY | 43.3 | 44.3 | 43.0 |
| LA | 46.0 | 49.6 | 44.8 |
| ME | 46.5 | 55.5 | 44.4 |
| MD | 45.6 | 49.3 | 44.5 |
| MA | 42.1 | 48.5 | 40.4 |
| MI | 42.6 | 44.2 | 42.1 |
| MN | 43.6 | 42.3 | 44.0 |
| MS | 51.6 | 57.5 | 49.1 |
| MO | 54.7 | 51.0 | 56.0 |
| MT | 57.2 | 70.0 | 53.8 |
| NE | 43.0 | 23.1† | 49.4 |
| NV | 46.7 | 26.6† | 51.5 |
| NH | 52.6 | 62.8 | 50.0 |
| NJ | 42.9 | 50.0 | 40.0 |
| NM | 40.6 | 56.4 | 36.2 |
| NY | 44.4 | 49.3 | 42.8 |
| NC | 49.2 | 52.5 | 47.7 |
| ND | 35.5 | 46.1 | 32.7 |
| OH | 44.5 | 44.8 | 44.5 |
| OK | 33.4 | 33.4 | 33.3 |
| OR | 52.2 | 59.8 | 50.3 |
| PA | 47.4 | 54.1 | 45.3 |
| RI | 51.3 | 48.3 | 52.1 |
| SC | 37.6 | 42.3 | 36.4 |
| SD | 47.6 | 65.2 | 44.8 |
| TN | 48.4 | 61.2 | 45.3 |
| TX | 45.4 | 47.2 | 44.7 |
| UT | 51.9 | 56.8 | 50.4 |
| VT | 51.9 | 66.9 | 48.8 |
| VA | 51.8 | 56.1 | 50.2 |
| WA | 46.2 | 64.6 | 42.4 |
| WV | 46.1 | 37.2 | 48.6 |
| WI | 36.8 | 46.8 | 34.6 |
| WY | 64.8 | 81.7 | 56.9 |
*Total includes the listed states
†Relative standard error of the estimate is ≥30%; the estimate is unreliable
Download this AsthmaStats Factsheet [PDF – 380 KB]
Source: National Health Interview Survey (NHIS), 2014–2017