Asthma as the Underlying Cause of Death
Asthma deaths have decreased over time and varied by demographic characteristics.
Deaths due to asthma are rare and are thought to be largely preventable, particularly among children and young adults. National asthma guidelines recommend early treatment and supportive efforts that focus on providing quality health care and patient education to patients who are at high risk of asthma-related death.
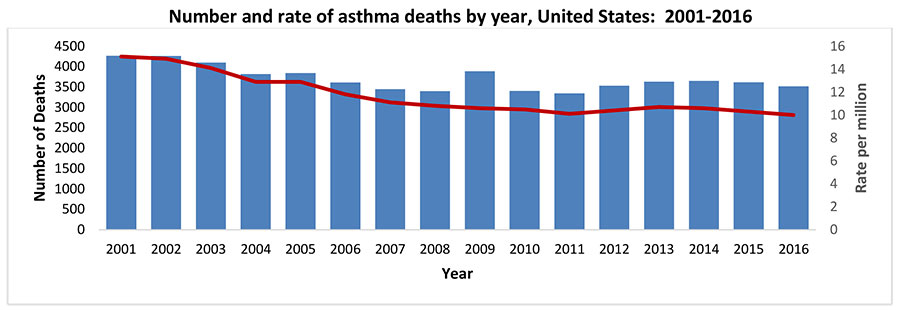
The rate of asthma deaths decreased from 15 per million in 2001 (n=4,269) to 10 per million (n=3,518) in 2016. Adults were nearly five times more likely than children to die from asthma. The asthma death rate was highest among the 65 years and older age group compared with all other age groups. Females had a higher death rate and non-Hispanic blacks were two to three times more likely to die from asthma compared with other race groups (non-Hispanic white and non-Hispanic other) as well as Hispanics. Among children, boys and non-Hispanic blacks were more likely to die from asthma. The same is true for adults.
CDC’s National Asthma Control Program (NACP) was created in 1999 to help the millions of people with asthma in the United States gain control over their disease. The NACP conducts national asthma surveillance and funds states to help them improve their asthma surveillance and to focus efforts and resources where they are needed.
Asthma Deaths by Demographic Characteristics
| Total | Child | Adult | |
|---|---|---|---|
| Rate*(SE) | Rate*(SE) | Rate*(SE) | |
| Total | 10.0 (0.2) | 2.8 (0.2) | 13.3 (0.2) |
| Sex | |||
| Male | 8.5 (0.2) | 3.4 (0.3) | 10.1 (0.3) |
| Female | 11.2 (0.3) | 2.2 (0.2) | 16.3 (0.4) |
| Race | |||
| White (NH) | 8.2 (0.2) | 1.2 (0.2) | 12.3 (0.3) |
| Black (NH) | 22.3 (0.8) | 11.4 (1.0) | 26.6 (0.9) |
| Other (NH) | 8.5 (0.7) | – | 9.9 (0.8) |
| Ethnicity | |||
| Hispanic | 7.8 (0.5) | 1.7 (0.3) | 7.7 (0.4) |
| Not Hispanic | 10.5 (0.2) | 3.2 (0.2) | 14.2 (0.3) |
| Age Group | |||
| 0-4 years† | – | 1.8 (0.3) | – |
| 5-17 years† | – | 3.2 (0.2) | – |
| 18-34 years† | – | – | 5.8 (0.3) |
| 35 – 64 years† | – | – | 11.5 (0.3) |
| 65+ years† | – | – | 29.2 (0.8) |
Note: NH = Non-Hispanic, SE = Standard Error
*Rates are age-adjusted to the 2000 standard population
†Rates are not age-adjusted, Source: CDC WONDER