Suicide Data and Statistics
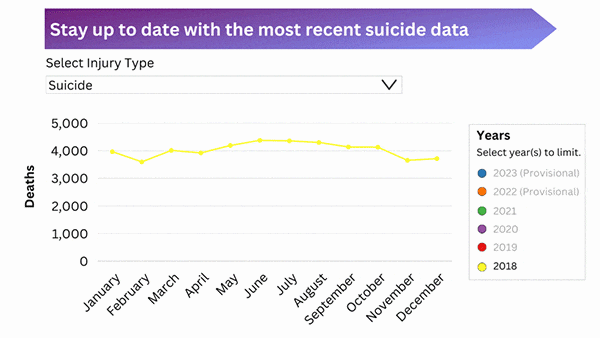
Suicide is one of the leading causes of death in the United States. This chart shows the number of suicide deaths by month and year, including the most recent provisional data available. You can access the full interactive chart by clicking on the image or the button below.
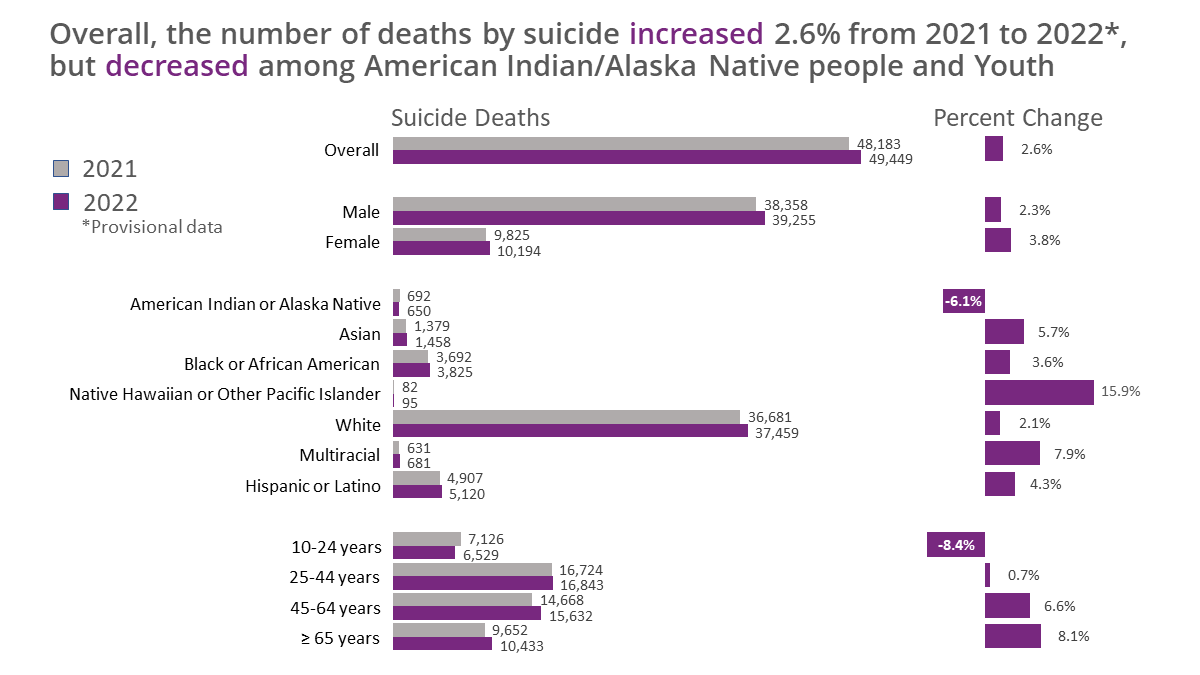
Suicide Deaths in the United States Overall and By Select Demographic Characteristics, 2021-2022
| 2021 Final Deaths |
2022 Provisional Deaths |
2021-2022 Percent Change |
|
|---|---|---|---|
| Overall | 48,183 | 49,449 | 2.6 |
| Gender | |||
| Male | 38,358 | 39,255 | 2.3 |
| Female | 9,825 | 10,194 | 3.8 |
| Race/Ethnicity | |||
| Not Hispanic or Latino | |||
| American Indian or Alaska Native | 692 | 650 | -6.1 |
| Asian | 1,379 | 1,458 | 5.7 |
| Black or African American | 3,692 | 3,825 | 3.6 |
| Native Hawaiian or Other Pacific Islander | 82 | 95 | 15.9 |
| White | 36,681 | 37,459 | 2.1 |
| Multiracial | 631 | 681 | 7.9 |
| Hispanic or Latino | 4,907 | 5,120 | 4.3 |
| Age Group | |||
| 10-24 years | 7,126 | 6,529 | -8.4 |
| 25-44 years | 16,724 | 16,843 | 0.7 |
| 45-64 years | 14,668 | 15,632 | 6.6 |
| ≥ 65 years | 9,652 | 10,433 | 8.1 |
Footnotes
-Suicide deaths were identified by using International Classification of Diseases, Tenth Revision underlying cause-of-death codes U03, X60–X84, and Y87.0.
-Data for race and Hispanic or Latino (Hispanic) origin should be interpreted with caution; studies comparing race and Hispanic origin on death certificates and on U.S. Census Bureau surveys have shown inconsistent reporting. This might lead to underestimates for certain racial groups.
-Relative change was calculated using the following equation: (2022 Provisional count – 2021 count) / 2021 count x 100
-Provisional data are based on death certificate data received, but not yet fully reviewed, by CDC’s National Center for Health Statistics (NCHS). Provisional data provide an early estimate of deaths before the release of final data. Complete documentation may be found at https://wonder.cdc.gov/mcd-icd10-provisional.html.
-Data were accessed on CDC WONDER on August 10, 2023 and represent data received as of August 6, 2023.
Source: SAMHSA
Some groups have disproportionately high rates of suicide.
The racial/ethnic groups with the highest rates in 2021 were non-Hispanic American Indian and Alaska Native people and non-Hispanic White people.
Race/ethnicity
Race/ethnicity
Rate per 100,000
Rate per 100,000
Non-Hispanic American Indian/Alaska Native
Non-Hispanic American Indian/Alaska Native
28.1
28.1
Non-Hispanic White
Non-Hispanic White
17.4
17.4
Non-Hispanic Native Hawaiian/Other Pacific Islander
Non-Hispanic Native Hawaiian/Other Pacific Islander
12.6
12.6
Non-Hispanic Multiracial
Non-Hispanic Multiracial
9.7
9.7
Non-Hispanic Black
Non-Hispanic Black
8.7
8.7
Hispanic
Hispanic
7.9
7.9
Non-Hispanic Asian
Non-Hispanic Asian
6.8
6.8
The suicide rate among males in 2021 was approximately four times higher than the rate among females. Males make up 50% of the population but nearly 80% of suicides.
Sex
Sex
Rate per 100,000
Rate per 100,000
Males
Males
22.8
22.8
Females
Females
5.7
5.7
People ages 85 and older have the highest rates of suicide.
Age range
Age range
Rate per 100,000
Rate per 100,000
85+
85+
22.4
22.4
75-84
75-84
19.6
19.6
65-74
65-74
15.3
15.3
55-64
55-64
17.0
17.0
45-54
45-54
18.2
18.2
35-44
35-44
18.1
18.1
25-34
25-34
19.5
19.5
15-24
15-24
15.2
15.2
10-14
10-14
2.8
2.8
Source: CDC WONDER
Learn more about disparities in suicide.
Firearms are the most common method used in suicides. Firearms are used in more than 50% of suicides.
Method
Method
Percent
Percent
Count
Count
Firearm
Firearm
54.6%
54.6%
26,328
26,328
Suffocation
Suffocation
25.8%
25.8%
12,431
12,431
Poisoning
Poisoning
11.6%
11.6%
5,568
5,568
Other
Other
8%
8%
3,856
3,856
Source: CDC Vital Statistics
Learn more about firearm violence.
Suicide rates increased 37% between 2000-2018 and decreased 5% between 2018-2020. However, rates nearly returned to their peak in 2021.
Year
Year
Rate per 100,000
Rate per 100,000
Count
Count
2000
2000
10.4
10.4
29,350
29,350
2001
2001
10.7
10.7
30,622
30,622
2002
2002
10.9
10.9
31,655
31,655
2003
2003
10.8
10.8
31,484
31,484
2004
2004
11.0
11.0
32,439
32,439
2005
2005
10.9
10.9
32,637
32,637
2006
2006
11.0
11.0
33,300
33,300
2007
2007
11.3
11.3
34,598
34,598
2008
2008
11.6
11.6
36,035
36,035
2009
2009
11.8
11.8
36,909
36,909
2010
2010
12.1
12.1
38,364
38,364
2011
2011
12.3
12.3
39,518
39,518
2012
2012
12.6
12.6
40,600
40,600
2013
2013
12.6
12.6
41,149
41,149
2014
2014
13.0
13.0
42,826
42,826
2015
2015
13.3
13.3
44,193
44,193
2016
2016
13.5
13.5
44,965
44,965
2017
2017
14.0
14.0
47,173
47,173
2018
2018
14.2
14.2
48,344
48,344
2019
2019
13.9
13.9
47,511
47,511
2020
2020
13.5
13.5
45,979
45,979
2021
2021
14.1
14.1
48,183
48,183
Source: CDC Vital Statistics