Healthy People 2010
Progress Review Focus Area 26 – Substance Abuse Presentation
PowerPoint Presentation [PPT – 1.7 MB]
Slide 1
Focus Area 26: Substance Abuse Progress Review
Richard Klein, National Center for Health Statistics
October 2, 2008
Slide 2
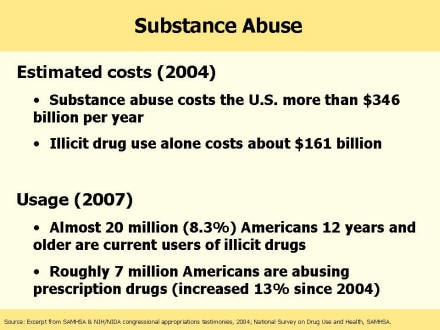
Substance Abuse
Estimated costs (2004)
Substance abuse costs the U.S. more than $346 billion per year
Illicit drug use alone costs about $161 billion
Usage (2007)
-
Almost 20 million (8.3%) Americans 12 years and older are current users of illicit drugs
-
Roughly 7 million Americans are abusing prescription drugs (increased 13% since 2004)
Slide 3
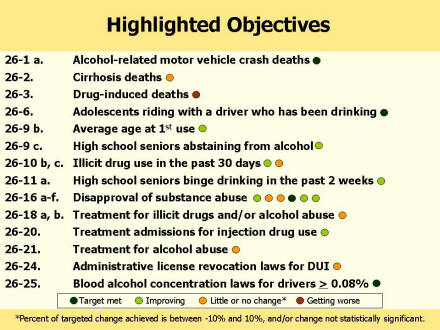
Highlighted objectives
Highlighted objectives with colored dots indicating status with regards to Healthy People target.
26-1 a. Alcohol-related motor vehicle crash deaths (met)
26-2. Cirrhosis deaths (little or no change)
26-3. Drug-induced deaths (getting worse)
26-6. Adolescents riding with a driver who has been drinking (met)
26-9 b. Average age at 1st use (improving)
26-9 c. High school seniors abstaining from alcohol (improving)
26-10 b, c. Illicit drug use in the past 30 days (b – improving, c – little or no change)
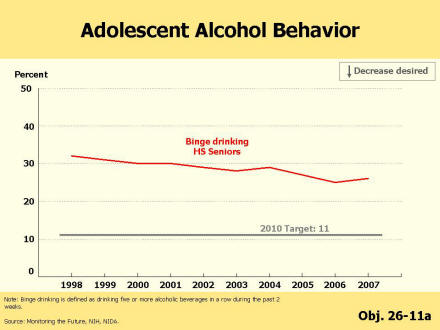
26-11 a. High school seniors binge drinking in the past 2 weeks (improving)
26-16 a-f. Disapproval of substance abuse (a, e, f – improving, d – met, b, c –little or no change)
26-18 a, b. Treatment for illicit drugs and/or alcohol abuse (a&b – little or no change)
26-20. Treatment admissions for injection drug use (improving)
26-21. Treatment for alcohol abuse (little or no change)
26-24. Administrative license revocation laws for DUI (little or no change)
26-25. Blood alcohol concentration laws for drivers > 0.08% (met)
Little or no change is indicated when the percent of targeted change achieved is between -10% and 10%, and/or change not statistically significant.
Slide 4
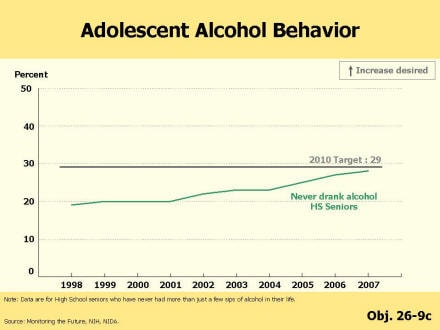
Adolescent Alcohol Behavior
Trend line shows the changes in the percent of High School seniors who never drank alcohol from the baseline year (1998) through the most recent data year available (2007).
Slide 5
Adolescent Alcohol Behavior
Trend line shows the changes in the percent of High School seniors who engaged in binge drinking from the baseline year (1998) through the most recent data year available (2007).
Slide 6
Adolescent Alcohol Behavior
Trend line shows the changes in the percent of High School seniors who engaged in binge drinking and those who never drank alcohol from the baseline year (1998) through the most recent data year available (2007).
Slide 7
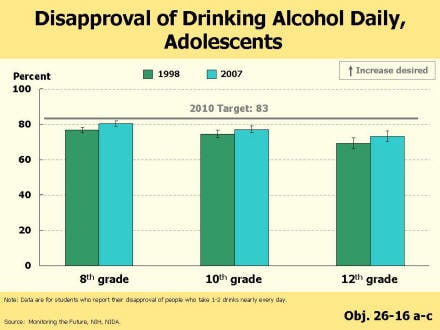
Disapproval of Drinking Alcohol Daily, Adolescents
Percent of 8th, 10th and 12th graders in 1998 (baseline) and 2007 (most recent data year) who report their disapproval of people who take 1-2 drinks of alcohol nearly every day.
Slide 8
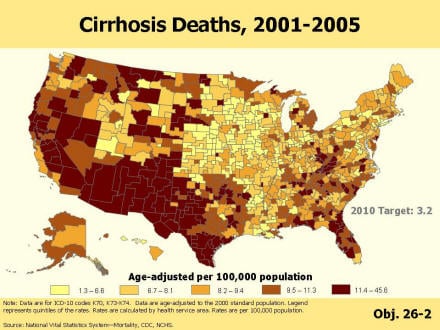
Cirrhosis Deaths, 2001-2005
Map showing cirrhosis death rate quintiles by health service areas.
Slide 9
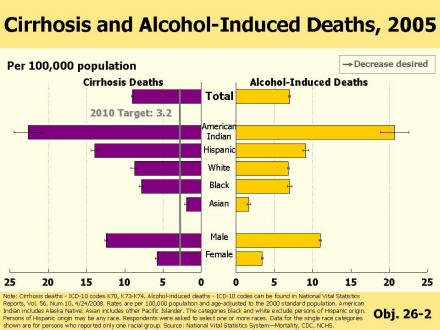
Cirrhosis and Alcohol-Induced Deaths, 2005
The age-adjusted rate (per 100,000 population) of cirrhosis and alcohol induced deaths are shown for 2005 (most recent data year). Data are shown for the total population, by racial/ethnic groups – American Indian, Black, White, Hispanic, and Asian, and gender – male and female.
Slide 10
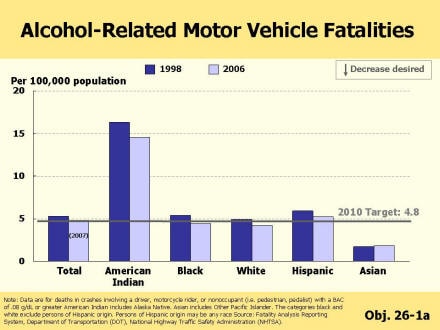
Alcohol-Related Motor Vehicle Fatalities
The rate (per 100,000 population) of alcohol related motor vehicle deaths are shown for 1998 (baseline) and the most recent data year. A fatal crash is defined ‘alcohol-related’ if either a driver or a nonmotorist has a measurable or estimated blood alcohol concentration (BAC) of 0.08 g/dL or above. Data are shown for the total population (most recent year – 2007) and by racial/ethnic groups (most recent year – 2006) – American Indian, Black, White, Hispanic, and Asian.
Slide 11
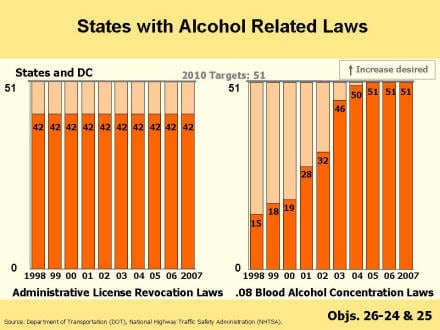
States with Alcohol Related Laws
Percent of States and DC with ALR Laws (Administrative License Revocation) are shown for 1998 (baseline) through 2007 (most recent data year). Percent of States and DC with .08 BAC Laws (Blood Alcohol Concentration) are shown for 1998 (baseline) through 2007 (most recent data year).
Slide 12
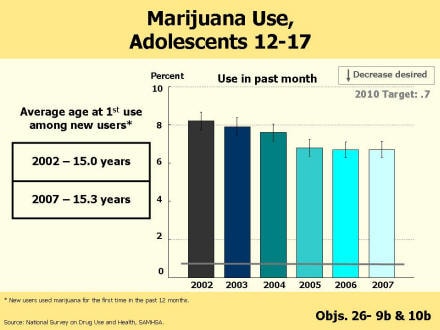
Marijuana Use, Adolescents 12-17
A table shows the average age at first use of marijuana among adolescents aged 12-17 years who used marijuana for the first time during the past 12 months for 2002 (baseline) and 2007 (most recent data year).
Slide 13
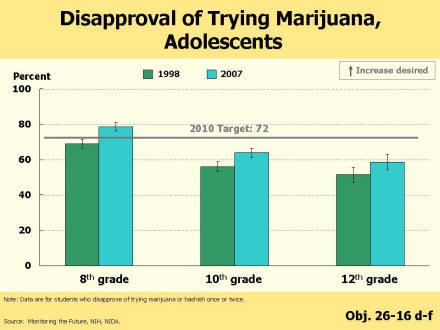
Disapproval of Trying Marijuana, Adolescents
Percent of 8th, 10th and 12th graders in 1998 (baseline) and 2007 (most recent data year) who report their disapproval of trying marijuana or hashish once or twice.
Slide 14
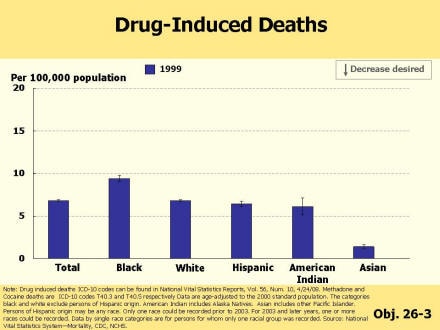
Drug-Induced Deaths
The age-adjusted rates (per 100,000 population) for drug-induced deaths are shown for 1998 (baseline). Data are shown for the total population and by racial/ethnic groups – American Indian, Black, White, Hispanic, and Asian.
Slide 15
Drug-Induced Deaths
The age-adjusted rates (per 100,000 population) for drug-induced deaths are shown for 1998 (baseline) and 2005 (most recent data year). Data are shown for the total population and by racial/ethnic groups – American Indian, Black, White, Hispanic, and Asian.
Slide 16
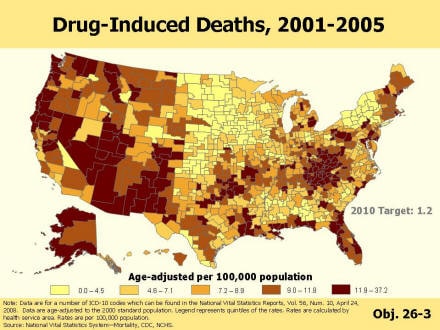
Drug-Induced Deaths, 2001-2005
Map showing drug-induced death rate quintiles by health service areas.
Slide 17
Needing and Receiving Treatment
A table shows the number of admissions for injection drug use for 1997 (baseline) and 2006 (most recent data year). 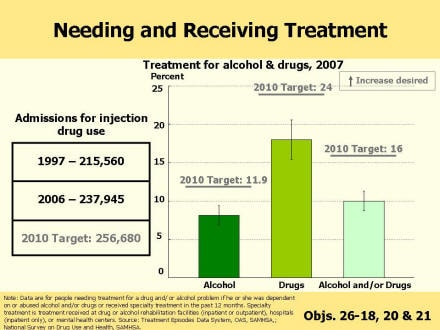
Slide 18
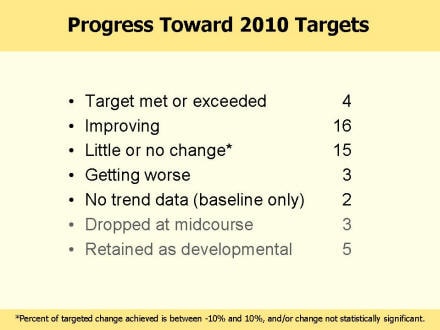
Progress Toward 2010 Targets
-
Target met or exceeded 4
-
Improving 16
-
Little or no change* 15
-
Getting worse 3
-
No trend data (baseline only) 2
-
Dropped at midcourse 3
-
Retained as developmental 5
*Percent of targeted change achieved is between -10% and 10%, and/or change not statistically significant.
Slide 19
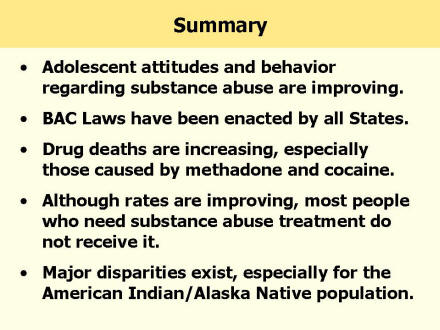
Summary
-
Adolescent attitudes and behavior regarding substance abuse are improving.
-
BAC Laws have been enacted by all States.
-
Drug deaths are increasing, especially those caused by methadone and cocaine.
-
Although rates are improving, most people who need substance abuse treatment do not receive it.
-
Major disparities exist, especially for the American Indian/Alaska Native population.
Slide 20
Acknowledgements
Elizabeth Jackson
Health Statistician
CDC/NCHS
Contributors:
Nancy Brady, SAMHSA
Deepthi Kandi, CDC/NCHS
Jeffrey Pearcy, CDC/NCHS
Carter Roeber, LTG Associate
Asel Ryskulova, CDC/NCHS
Slide 21
This slide indicates that Progress Review data and slides can be found at the Healthy People website.