Healthy People 2000 Progress Review
Oral Health
Date: December 15, 1999
Time: 2-4:00 p.m. EST
This progress review will be broadcast on the Public Health Training Network. Details on how to review the broadcast are provided on the Public Health Training Network home page.
Dr. David Satcher, Assistant Secretary for Health and Surgeon General, will be joined by a panel of experts representing the public and private health sectors. Dr. Harold C. Slavkin, Director, National Institute of Dental and Craniofacial Research, National Institutes of Health (NIH); Dr. Claude Earl Fox, Administrator, Health Resources and Services Administration (HRSA); Dr. William Maas, Director, Division of Oral Health, National Center for Chronic Disease Prevention and Health Promotion, Centers for Disease Control and Prevention (CDC); and Dr. Edward Sondik, Director, National Center for Health Statistics, Centers for Disease Control and Prevention (CDC), will review progress toward the targets for the objectives in priority area 13, Oral Health, of Healthy People 2000. The meeting will 1) provide a progress review of Healthy People 2000 objectives on oral health; 2) offer an opportunity for those gathered in participating states to discuss key issues with Dr. Satcher and the panel; and, 3) explore actions that might be taken in your state to improve the health of all Americans through prevention and early detection during the next decade.
The primary objectives of this meeting are to:
- Assess progress made in achieving the Healthy People 2000 objectives for oral health.
- Highlight effective programs that have made an impact on progress and identify barriers that have hindered improvement.
- Gain an understanding of how these national objectives are translated into opportunities for action.
Briefing Book Materials
- Objective Charts (in black and white) [PDF – 159 KB]
- Objective Charts (in color) [PDF – 85 KB]
- Disparity Charts [PPT – 144 KB]
Data Section
- Summary tables [PDF – 20 KB]
- Individual objective tables [PDF – 45 KB]
- Dispartiy Tables [PDF – 60 KB]
Presentation
Presented by Diane K. Wagener, Ph.D.
for Edward J. Sondik, Ph.D.
Thank you, Dr. Satcher. The improvement in the oral health of the U.S. population has been one of the Public Health successes of the 20th century. In particular, fluoridation of drinking water has been the principal intervention that has improved the teeth of Americans. Although the overall news for the century has been good, improvements in the last decade have been small and have not been uniform across the population. The effective implementation of other interventions, such as dental visits and use of tooth sealants, remains to be accomplished.
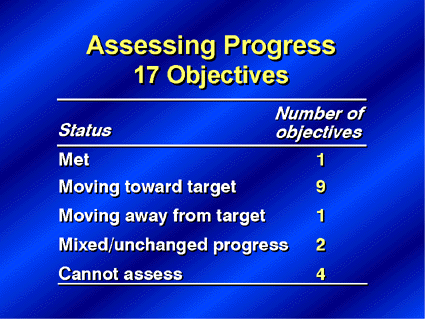
There are 17 objectives in the area of Oral Health. One objective, oral cancer deaths, has met its Year 2000 target. Nine of the objectives are moving toward their targets. But, the objective related to gingivitis is moving away from its target. Two other objectives are showing either mixed results or no change and for four objectives we still don’t have the data to assess their progress.
This afternoon, I’ll focus first on children, and then follow up with objectives for adults.
Dental caries is the most common chronic disease of childhood. Studies have shown that more than 80 percent of children are affected by age 17 and that the prevalence of caries is not evenly distributed among all children. In fact, twenty-five percent of children account for 80 percent of all caries. Oral disease at this stage of life can affect a child’s development, their nutritional status, and quality of life for years to come.
These first slides will detail the extent of dental problems among children and adolescents. Data from several sources show that about half the population of 6-8 year olds have experienced caries – at least one cavity – either treated or untreated. Limited progress has been made toward the year 2000 target for the total age group and for each sub-population. Approximately 90 percent of American Indian and Alaska Native children have had caries. Remember, though, this is the total caries experience and includes teeth that have already been treated. How have children fared with untreated caries?

Well, with untreated caries, the prevalence ranges from 25 percent of white children to about 70 percent for American Indian and Alaska Native children and Asian and Pacific Island children. Mexican American children are in midrange with almost half having untreated cavities. Although there has been little change from baseline, the disparities among groups are significant. For those populations that were identified by Healthy People as having an increased risk, the percent of children with untreated decay remains extremely high.
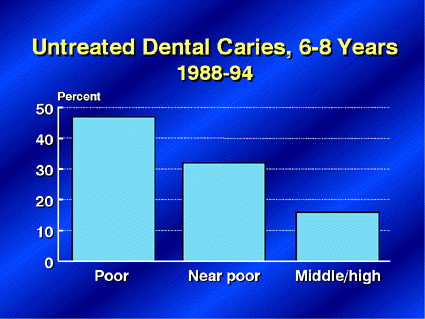
As I indicated, the variations by race and ethnicity are striking. When we look at the same data in another way, that is by family income, the percent of children with untreated caries is almost 3 times as high for those in the lowest income group compared to those in the middle to high income group. A regression analysis performed on these data indicate that a substantial portion of the racial and ethnic disparities are accounted for by income. Since the cost of dental care may be prohibitive to some families, it is hoped that the Children’s Health Insurance Program will begin to improve access to dental care for near-poor children; those who are not eligible for Medicaid, but whose parents have no insurance or cannot afford dental care. The Inspector General recently stated that improvements in access must also be achieved for the Medicaid population.
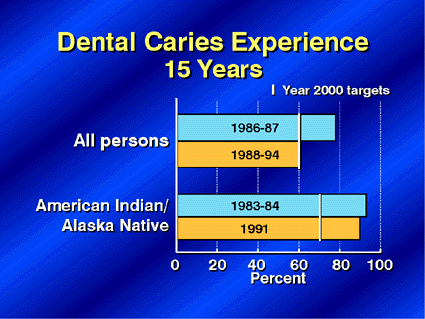
Now, turning to adolescents, the 15 year olds as a group have almost met their target in reducing caries experience that is, both treated and untreated caries. As with younger children, American Indian and Alaska Native adolescents have higher rates and show little improvement.
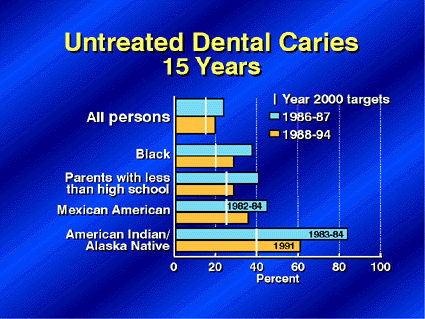
For untreated caries, progress has been made for the total population and for each selected subpopulation. Although here again, the American Indian and Alaska Native adolescents have far to go to reach the lower caries levels of other 15 year olds.
Now let’s turn to the objectives that measure care received by children. Early visits to a dentist are extremely important for caries prevention, and the beginning of school is a time when many parents are encouraged or required to take their children for a check-up. By one measure there’s been an increase in the past decade in the number of 5 year old children who visit a dentist. These data, however, are based on parental reports of dental visits and do not indicate the reason for the visit, so we currently don’t know if it was an emergency visit or part of a planned visit to provide on-going preventive care for their children’s teeth. This area will be investigated in more detail for Healthy People 2010.
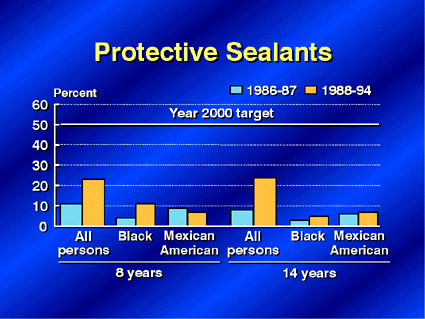
Another caries prevention measure – in addition to actually seeing the dentist – is the application of protective sealants to permanent molars. Data collected by NIDCR as well as NCHS indicate that the percents of both children and adolescents receiving sealants have doubled from baseline, but remain far below the target. Data on Mexican-American children, however, show little or no improvement.

When we analyze these data by socio-economic status, only 3 percent of children of poor parents received sealants compared with 35 percent of middle and high income children.
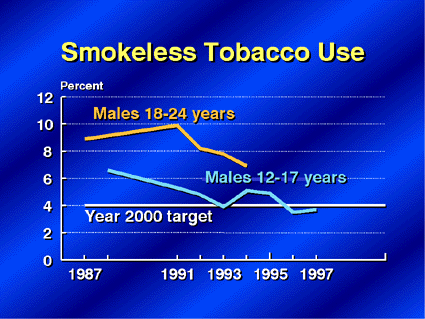
The final issue for children describes a completely different topic – the use of smokeless tobacco, an area that the Surgeon General reported on in 1998. I am pleased to report that for boys 12-17 years old, there has been a large decline in the use of smokeless tobacco and the year 2000 target has been met. These data are from SAMHSA’s National Household Survey on Drug Abuse. In the slightly older population of 18-24-year-old males, the National Health Interview Survey data document that there has also been a decline in smokeless tobacco use, but for this group the target has not yet been reached.
Now let’s turn to adults. Again you’ll notice that many of the oral health indicators are significantly impacted by income as well as education.
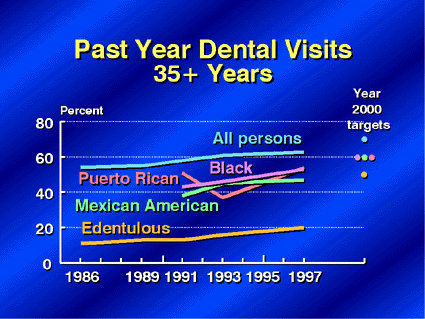
Progress is being made in increasing the percent of people 35 years and older who have visited a dentist within the past year, with the exception of Puerto Ricans, who showed no progress. About 2/3 of all persons in this age group have seen a dentist, while for most at-risk groups the percentages are closer to one-half. Only 20 percent of people without teeth – that is, edentulous people – have seen a dentist in the past year. In fact, edentulous persons are a targeted group because they are at risk of having other oral problems that may go undetected and untreated if they are no longer seen by a dentist.

Again there is a strong social and economic component to adults visiting dentists -the blue bars. The most educated adults are almost twice as likely to have visited a dentist in the past year compared with adults who have less than a high school education. In this chart, comparison data on child and adolescent visits by parent’s education is also displayed as the orange bars. It’s interesting to note that at each education level, a higher proportion of children than adults visited the dentist.
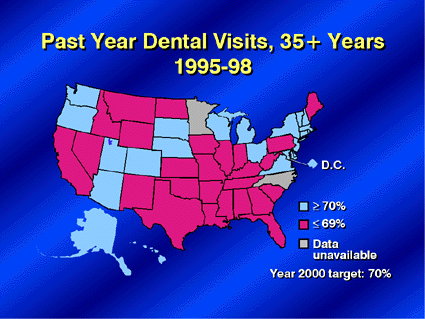
The percent of adults visiting a dentist clusters somewhat by region. The States shown in blue are those States which have met the Year 2000 goal of 70 percent of adults having seen a dentist in the past year. A number of the States with lower rates are clustered in the south and Midwest. From a data point of view, it is encouraging to note that almost every state is now collecting information on dental visits through the CDC-sponsored Behavioral Risk Factor Surveillance System, known as BRFSS.
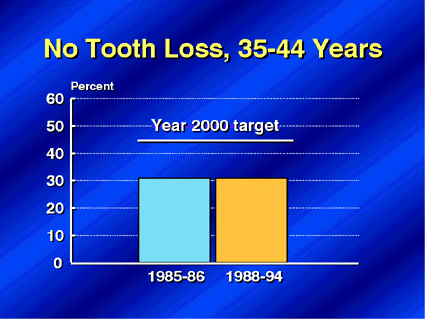
Healthy People set as a national goal to reduce the number of people who lose any of their natural teeth. Only 30 percent of people 35-44 years of age currently have all their permanent teeth. No recent progress has been made in this area, which is undoubtedly one that changes slowly and may take decades to show significant improvement.
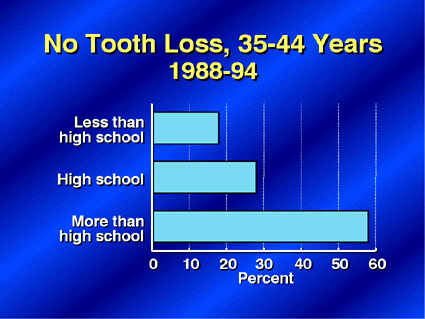
Again, socio-economic status differences are evident in the distribution of people who retain all of their teeth. Almost 60 percent of persons with the highest levels of education have all their permanent teeth, compared to fewer than 20 percent of those with less than a high school education.

Gingivitis, or inflammation of the gums, is the one objective that I mentioned that has been moving away from the Year 2000 target, at least for the country as a whole. The percent of the population with gingivitis is increasing among all persons 35-44 years, American Indian and Alaska Native persons, and low-income persons. But the numbers suggest that gingivitis may be decreasing among Mexican Americans.
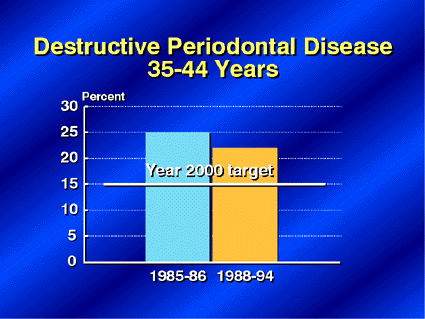
Given the rise in gingivitis, it was unexpected that destructive periodontal disease declined somewhat in the same age group. Here again, there is also a clear socioeconomic gradient – more than 40 percent of poor people have destructive periodontal disease compared to less than 20 percent of people with middle to high income.
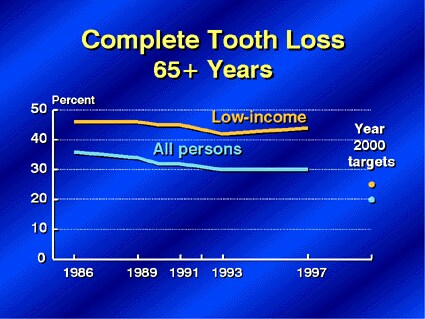
Oral health is an important and often overlooked component of an older person’s overall health and well-being. The percent of older people who have no teeth has been slowly declining over the past decade. The rate now stands at 30 percent, although it is more than 40 percent of low-income persons.
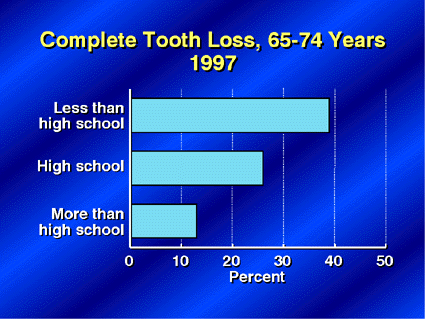
The gradient we saw for “no tooth loss” by education mirrors itself again here with “total tooth loss”. Clearly, education is a very important factor that has life-long effects on oral health. The percent of persons 65-74 years with complete tooth loss varies significantly by educational attainment, from almost 40 percent with no teeth for those with less than a high school education to less than 15 percent for those with at least some college.

Like dental visits, edentulism is not evenly distributed across the country. The highest rates are clustered in many of the same States that had the lowest rates of dental visits among adults. As more older people are keeping their natural teeth, the percent of those with cavities become more important. A lack of dental insurance may become more of an issue among this age group.
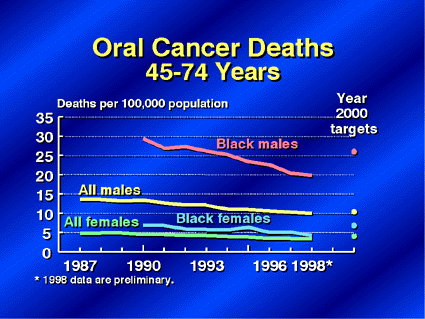
Now, we’ll look at cancer of the oral cavity and pharynx. There has been a significant decline in the death rate from this cancer, and the Year 2000 targets have been surpassed by all targeted populations, but the death rate for black males is still twice the rate for all males.
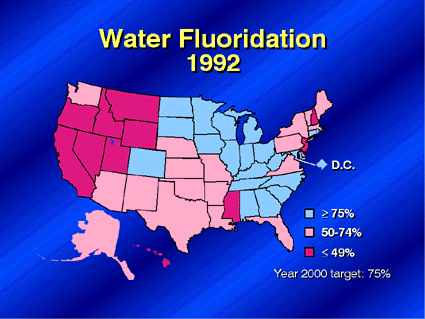
(Fluoridation map) . Lastly, turning to the issue of water fluoridation, 20 States and the District of Columbia exceed the Healthy People 2000 target. These States represent over 60 percent of the U.S. population. The West currently has the lowest percent of the population with optimally fluoridated water, but recent legislation in three States to require widespread water fluoridation – in California, Nevada, and Delaware – may improve the outlook.
As you can see, progress has been made over the past decade. More than half of the 17 Healthy People 2000 objectives have shown progress. One, oral cancer deaths, met its target. An objective that we haven’t discussed but which has shown improvement focuses on infants with cleft palate. But, there are still four objectives for which we do not have data.
The data we do have reflect many areas of the Department working together to provide a picture of oral health. If anything, we need more clinical measurement data and more analysis of the data that are already available to help us understand the role of socio-economic status – both education and income – as well as the role of race and ethnicity in obtaining health care and improving oral health. More data on barriers to dental care, such as the lack of insurance, would also be helpful in charting a course for the future.
The United States as a whole has accomplished so much in the area of oral health in the last decades that continued progress is often slow and difficult. It is also obvious that all Americans have not been moving forward at the same rate. Disparities remain in the oral health experience between segments of the population. The goal of the next set of national objectives – Healthy People 2010 – is to eliminate these disparities. We review data like the Healthy People objectives to identify these differences. This tells us what is achievable for all Americans.