Healthy People 2000 Progress Review
Clinical Preventive Services
“Setting Priorities for the Delivery, Quality, Measurement, and Coverage of Clinical Preventive Services”
Date: January 20, 1999
Time: 2-4:30 p.m.
A live broadcast from Wilson Auditorium on the campus of the National Institutes for Health Public Health Training Network Announcement
Dr. David Satcher, Assistant Secretary for Health and Surgeon General will be joined by a panel of experts representing purchasers of preventive services, health plans, consumers, national provider organizations, local health departments, quality measurement organizations, Federal agencies funding health care services, State Medicaid agencies, health professions schools, and other stakeholders. Participants will review the progress made on meeting the goals and targets for the Clinical Preventive Services priority area of Healthy People 2000, and to enable the policy planners, educators, and providers of health care services to set priorities for the delivery, quality, measurement, and coverage of clinical preventive services.
Briefing Book Materials


Data Section
- Summary tables [PDF – 18 KB]
- Individual objectives table [PDF – 35 KB]
- Objective charts [PDF – 1.1 MB]
- Statistical Note No. 17 [PDF – 75 KB]
Presentation
Edward J. Sondik, Ph.D.
Director, National Center for Health Statistics
January 20, 1998
Wilson Auditorium
National Institutes of Health
Thank you. This afternoon, we’re focusing on the Nation’s use of clinical preventive services. As in past Healthy People reviews, we’ll examine where progress has been made, where progress has lagged, and where disparities still remain. The investment in preventive services has truly paid off, so we’ll also highlight a few examples of the impact of these services over the past decade.
The data we are using come from several key data sets. National data are primarily from the National Health Interview Survey which gathers data on health promotion and disease prevention, through a household interview survey. We just completed the 1998 survey which will provide data for the final assessment on Healthy People 2000. While these estimates for the nation as a whole tell us a great deal, they can’t illustrate and highlight critical differences which emerge as we examine the data state-by-state. So we use complementary data on states from the Behavioral Risk Factor Surveillance System, a collection of state surveys based on telephone interviews, coordinated by our CDC colleagues.
Now let’s take a look at some of the specific objectives. First, those where we’re making progress.
SLIDE 1 (Progress) – We have done well in raising levels of childhood immunization and seeing that the elderly receive flu shots. And more Americans than ever before are being screened for high cholesterol and breast and cervical cancer. The next series of slides focus on these objectives.
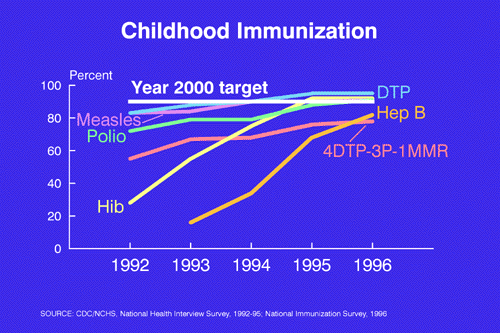
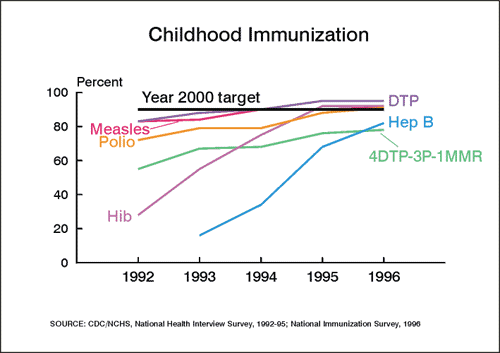
SLIDE 2 (Child Immunization) – For the year 2000, we set a target that at least 90 percent of our children, ages 19-35 months old, receive a recommended set of childhood immunizations. I am pleased to report that progress in this area has been impressive, with all of the recommended immunizations nearing or exceeding the target.
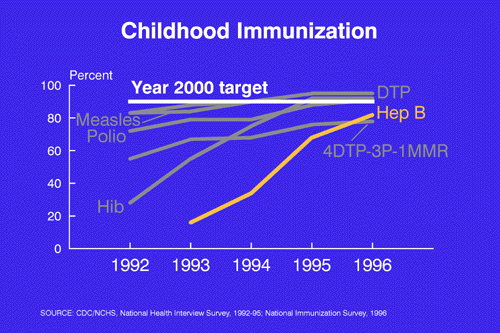
SLIDE 2A. Even the newly recommended vaccination for hepatitis B has increased four-fold, going from 16 percent of children immunized in 1993 to 82 percent by 1996.
Now for the elderly. . . .
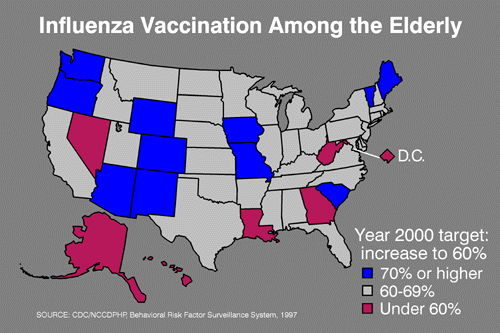
SLIDE 3 (Flu shots) – A vaccination can prevent what often could be a fatal bout of the flu or lessen its severity. In 1997, vaccination rates among the elderly had reached or exceeded the goal of 60 percent in all but the six states and the District of Columbia, shown in red. States that have met the target are in gray and blue; those in blue have achieved a 70 percent vaccination rate. Turning now to cholesterol screening . . .
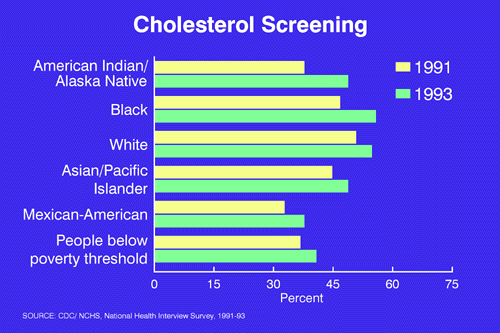
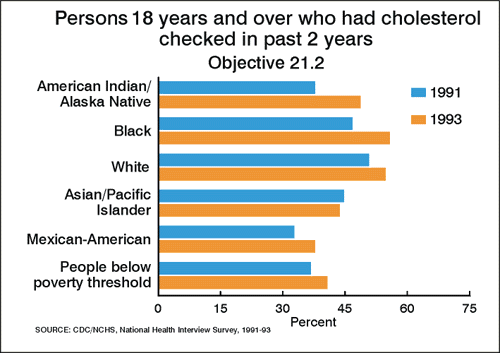
SLIDE 4 (Chol screen) – High cholesterol is an important risk factor for cardiovascular disease. Cholesterol can be lowered through diet and, if necessary, medication, but first individuals and their health care providers need to screen and take appropriate action. These data show an improvement in the percent of adults who have been screened in the past two years.
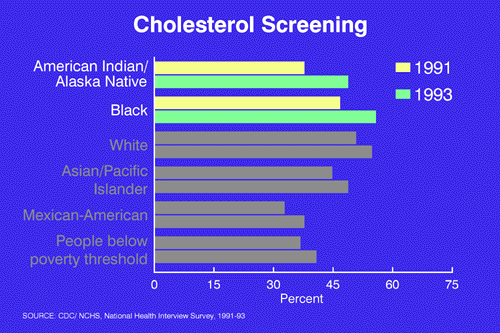
SLIDE 4A. Looking at the two top groups shown on this chart, note that from 1991 to 1993, 19 percent more black Americans and 30 percent more American Indian and Alaska Natives reported being screened for cholesterol–a very significant improvement.
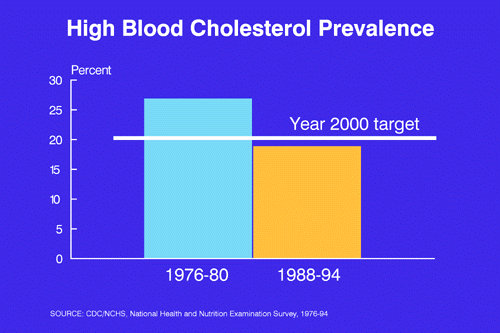
SLIDE 5. (Chol prev) – In fact that increase in screening has paid off. As shown here, by the mid-1990s, fewer than 20 percent of the population had elevated cholesterol levels, surpassing the Year 2000 target.
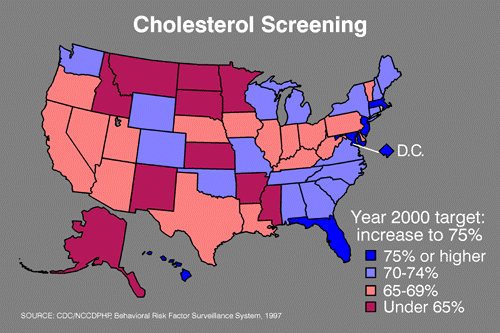
SLIDE 6. (Chol screen – map) – Using 1997 data from the Behavioral Risk Factor Surveillance System, we see that screening varies across the country. In that year, only five states and DC–shown in dark blue–had reached the target of 75 percent of the population screened in the past 5 years, and 10 states, in red, are still below 65 percent. So we can and need to do more.
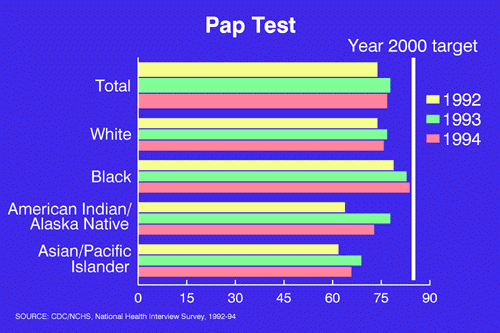
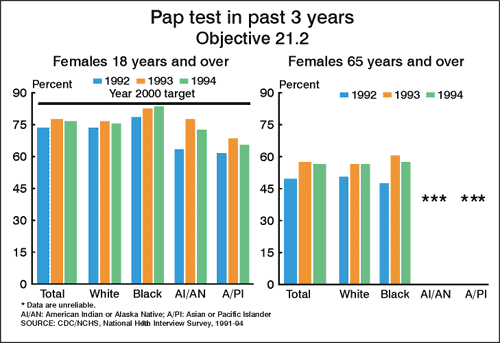
SLIDE 7. (Pap test) Two of the objectives in this chapter address cancer. Let’s look first at pap smears which are the principal reason that cervical cancer death rates have fallen 75 percent in the past 40 years. The data show that screening rates vary considerably by race.
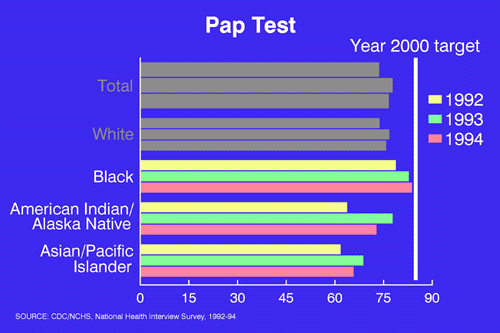
SLIDE 7A. African American women 18 and over had a screening rate of 84 percent in 1994, compared to 73 percent for American Indian and Alaska Native, and a low of 66 percent for Asian and Pacific Islander women. These disparities are cause for concern, and, in fact, cervical cancer screening has been made a component of the Secretary’s Initiative to Eliminate Health Disparities.
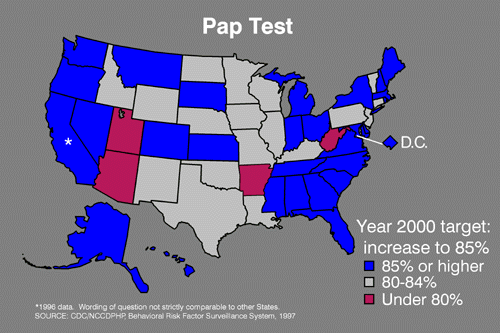
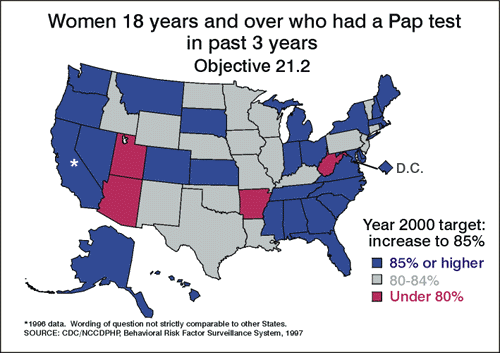
SLIDE 8. (Pap test – map) When we look at screening by state, a majority of states — shown here in blue — have reached the target of 85 percent of adult women having had a pap test in the past 3 years. That’s good news, but still four states, the ones you see in red, are under 80 percent.
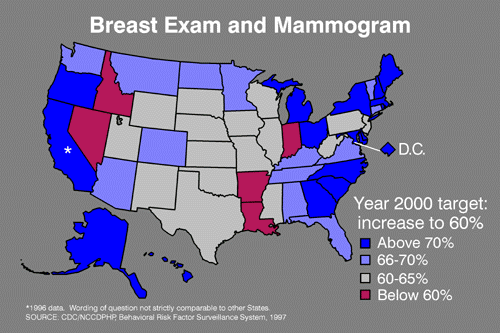
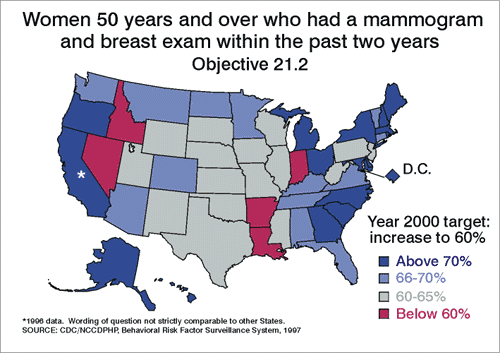
SLIDE 9. (Mam – map) Another service which can reduce cancer deaths is mammography coupled with breast exams. In 1987, only 25 percent of women aged 50 and older were regularly screened. These data from 1997 show that all but five states–those in red–met the Year 2000 target of 60 percent of women ages 50 and over having had a mammogram and clinical breast exam in the past two years. This progress in screening and advances in treatment have paid off. In fact, after remaining constant for almost 40 years, death rates for breast cancer have fallen 17 percent over the past decade.
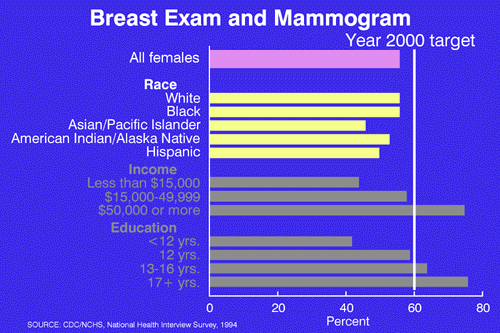
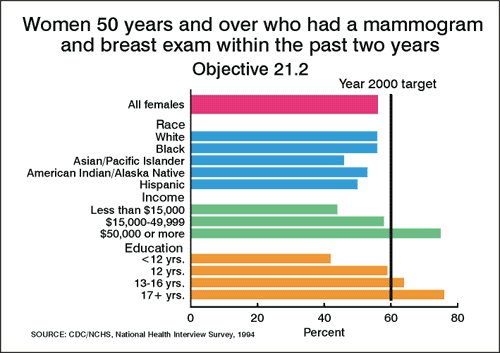
SLIDE 10 (Mam – race/eth) – When we look at mammography by race and ethnicity, there is very little difference among white, black and Hispanic women.
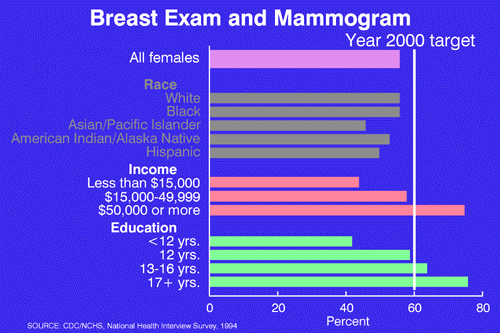
SLIDE 10A. However, the differences by income and education in breast cancer screening are quite dramatic. Women at the highest education or income levels are twice as likely to have had a mammogram than women at the lower end of the socioeconomic scale.
Now, I’d like to turn now to some objectives where our progress has fallen far short of the Healthy People targets:
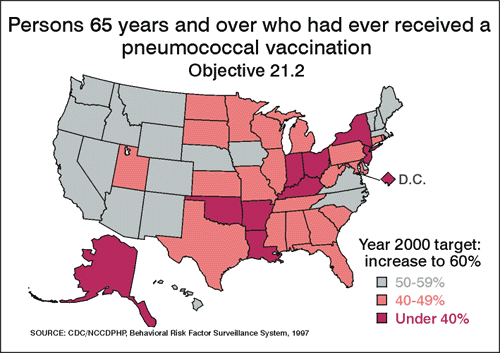
SLIDE 11. (Pneumo elderly) – For pneumonococcal vaccinations, the goal of 60 percent of persons 65 and over ever having received a vaccination is far from a reality. Although there is some modest progress for all of the groups shown in this chart, we need to substantially increase the rate in all race and ethnic groups in order to reach the goal.
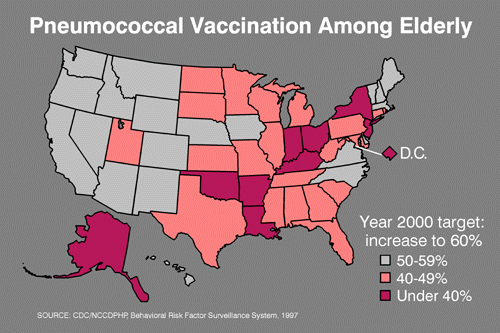
SLIDE 12. (Pneumo Map) And, not a single state has met the 60 percent vaccination target. The western and northeastern states rank higher on this measure, but if we are to reach this target it is going to require a concerted effort across the country.
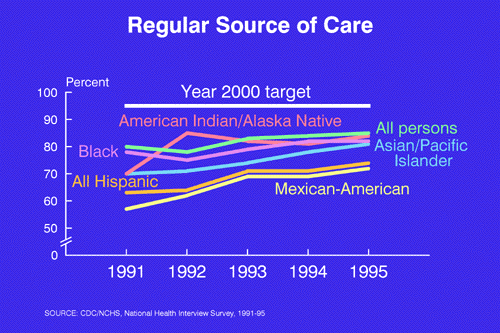
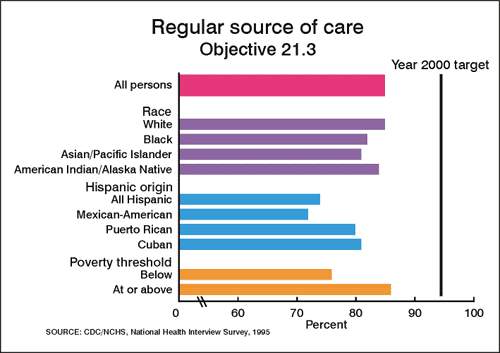
SLIDE 13. (Reg care) – To receive preventive services, it’s important to have a regular source of health care. A regular source of care means doctors, nurses and other health professionals who know their patients. They inform their patients about testing, they schedule them for regular screening, and they assist them in obtaining preventive services. While there was some improvement in this measure, most recently there’s been very little change and no group has reached the target of 95 percent.

SLIDE 14. (Blank) Progress is also weak for other recommended preventive service objectives related directly to having a regular source of care. By the way, we have included data for those objectives as well as the rest of the objectives in this area in your briefing book. And for all of you the data are available over the Internet. Let me just mention a couple of these services now. For example, there has been little improvement in the percentage of adult Americans who’ve had a routine checkup in the past three years. And we’ve also seen no increase in the percent who report that their doctor has asked them about health habits, such as diet and exercise at their last visit.
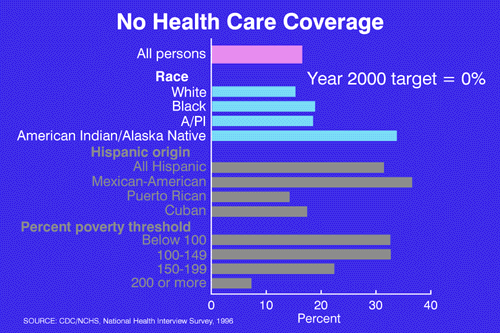
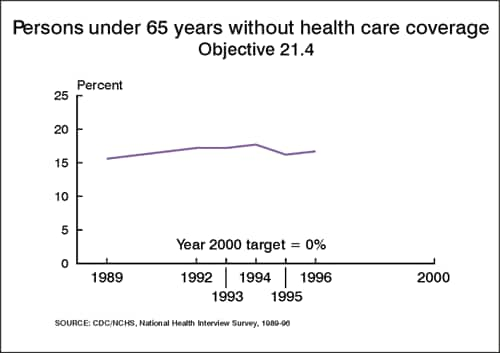
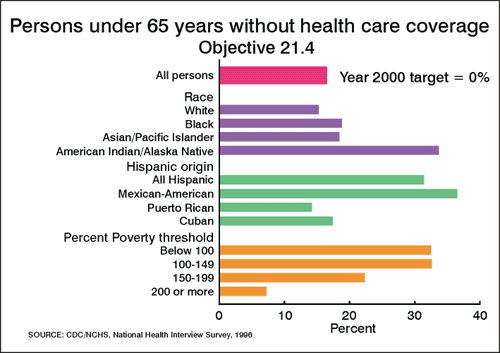
SLIDE 15. (No coverage) – Having regular health care is strongly associated with having health care coverage. An ambitious goal for the nation is for no one to be without health care coverage, but as this chart shows, we are a long way from achieving that goal. Overall some 16 percent of the population under 65 years of age–that’s one in every 6–had no health care coverage in 1996.
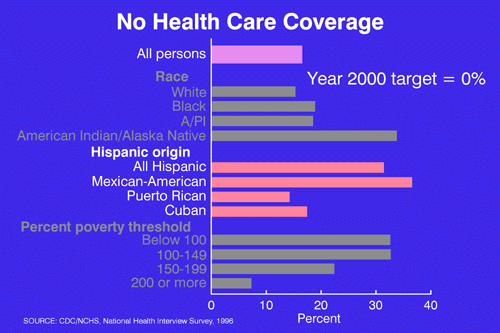
SLIDE 15A. And for Mexican Americans, more than one in three is without private health insurance or coverage under public programs.
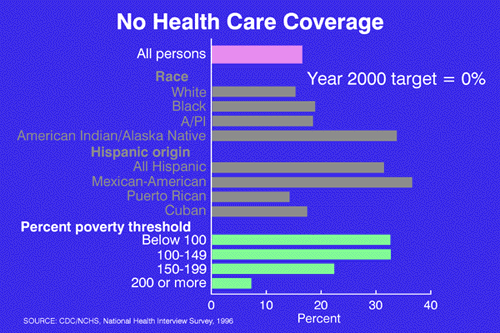
SLIDE 15B. The income gradient–certainly not unexpected–shows that those in the lower income groups are far less likely to have health care coverage. In fact, 33 percent of the lowest income group lacks health care coverage compared to only 8 percent of those with the highest income.
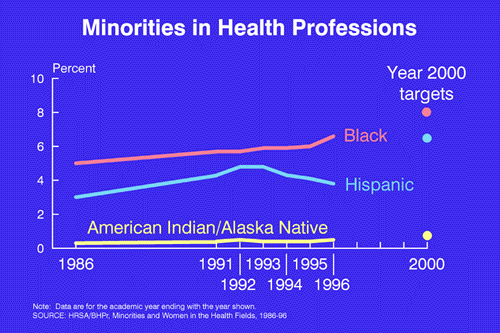
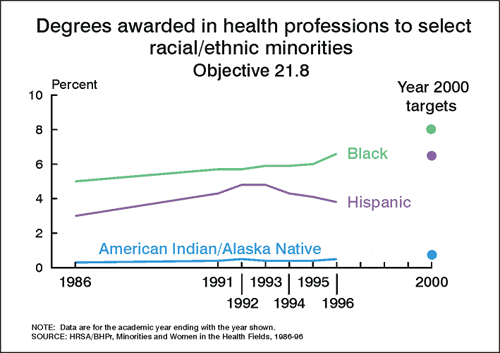
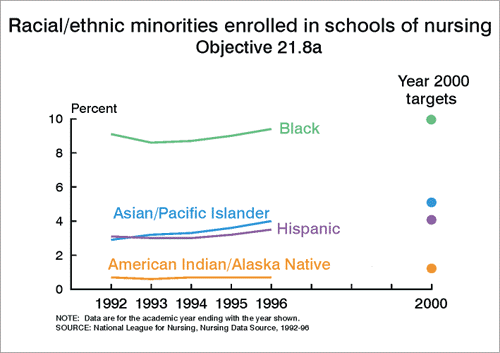
SLIDE 16. (Minorities) – Objective 21.8 looks not at specific clinical services but at the health care system itself. Healthy People 2000 calls for an increase in minority participation in the health professions, targeted to more closely reflect the diversity of our society. There has been some improvement as measured by an increase in the proportion of degrees awarded to black health professionals. However, African Americans received only 6 percent of the health professional degrees in 1996, although they comprise about 12 percent of the population. For Hispanics, the gap is even greater, with only about 4 percent of degrees awarded to a group which makes up about 11 percent of our population today. Clearly, there’s a need to change this pattern in order to improve the diversity of our health care.
SLIDE 17. (Conclusions) – To conclude: We certainly have made progress. More Americans now receive preventive clinical services than a decade ago. And disparities–by race, ethnicity, income and education–have surely been reduced for some objectives. For other objectives, challenges persist. Many of you have been involved in the process of setting the goals and objectives for Healthy People 2010. One of these goals will be the elimination of all health disparities–clearly a major challenge.
Our future progress will also be challenged by changes in our health care system. The various health care plans, which include or exclude certain preventive services, and barriers based on level or type of coverage may create new disparities in our health and health care. To meet those challenges we need new data sources — sources to provide data on service coverage and to monitor the quality as well as the receipt of such services. The Medical Expenditures Panel Survey, conducted by AHCPR, is one of those new data systems which surely will be important for Healthy People 2010.

SLIDE 18. BLANK Indeed, data are at the core of Healthy People, and adequate data to evaluate progress and identify problems will also be a challenge for the entire Healthy People effort. With your help, we are working to find the ways to meet those challenges — not only for the Clinical Preventive Services we’ve talked about today — but for all of the Healthy People objectives, now and in the future.