2010 Pregnancy Rates Among U.S. Women
by Sally C. Curtin, M.A., and Joyce C. Abma, Ph.D., Division of Vital Statistics, NCHS; and Kathryn Kost, Ph.D., Guttmacher Institute
PDF Version (349 KB)
The drop in birth rates from 2007 through 2013 has been well documented (1). However, it is also important to examine total rates of pregnancy and other pregnancy outcomes (abortion and fetal loss) to provide a comprehensive picture of current reproductive trends. This NCHS Health E-Stat uses data from 2010 to update a previous NCHS report on pregnancy rates (2). Data on pregnancy outcomes by age and race and Hispanic origin are presented.
The pregnancy rate for women in the United States continued to decline in 2010, to 98.7 per 1,000 women aged 15–44 (Table 1), a record low for the 1976–2010 period. This level was 15% below the 1990 peak (115.8). The decline in the overall pregnancy rate during 1990–2010 included reductions in birth and abortion rates, with the percent decline greater for abortions (35%) than births (10%) over this period. The 2010 abortion rate (17.7) was a record low. Fetal loss rates fluctuated over the period and were 3% lower in 2010 than in 1990. The estimated number of pregnancies dropped to 6.155 million in 2010, the lowest number since 1986. Pregnancies in 2010 included 3.999 million (65.0%) live births, 1.103 million (17.9%) induced abortions, and 1.053 million (17.1%) fetal losses.
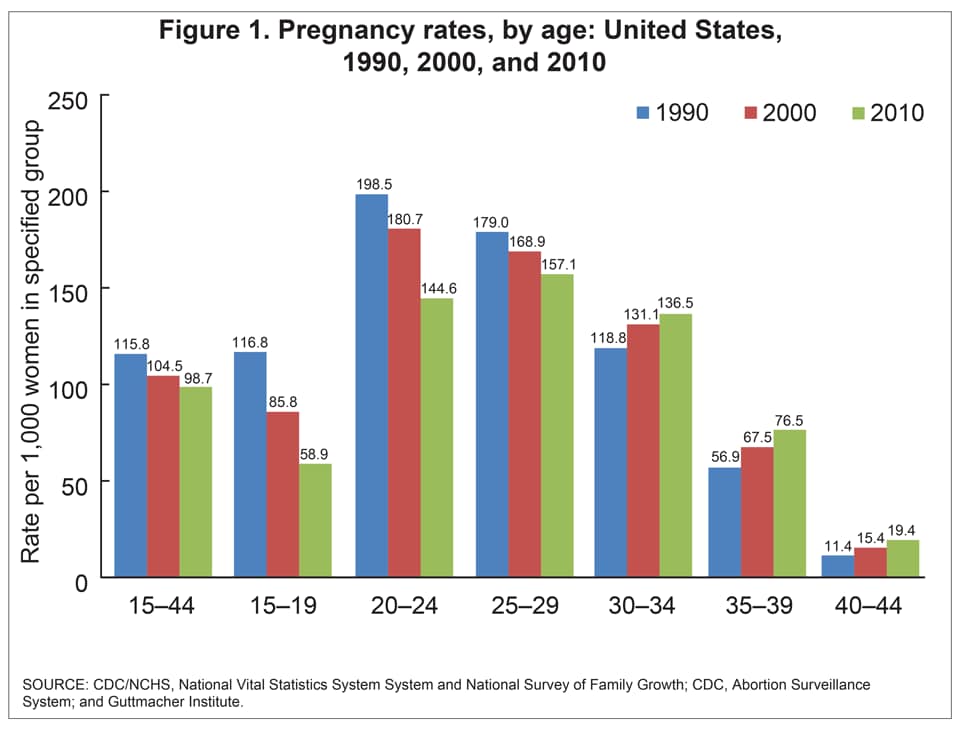
Compared with 1990, pregnancy rates were lower in 2010 for women under age 30, with the largest percent decline occurring among teenage subgroups, including a 67% reduction for teenagers aged 14 and under, and a 50% reduction for teenagers aged 15–19 (Figure 1, Table 2). Pregnancy rates in 2010 were highest for women aged 25–29 (157.1 per 1,000 women) followed by women aged 20–24 (144.6), with declines of 12% and 27%, respectively, since 1990. Rates for women aged 30 and over increased over the 20-year period, with women aged 40 and over having the largest percent increase (70%). However, rates for women in their 30s have declined since 2006–2007.
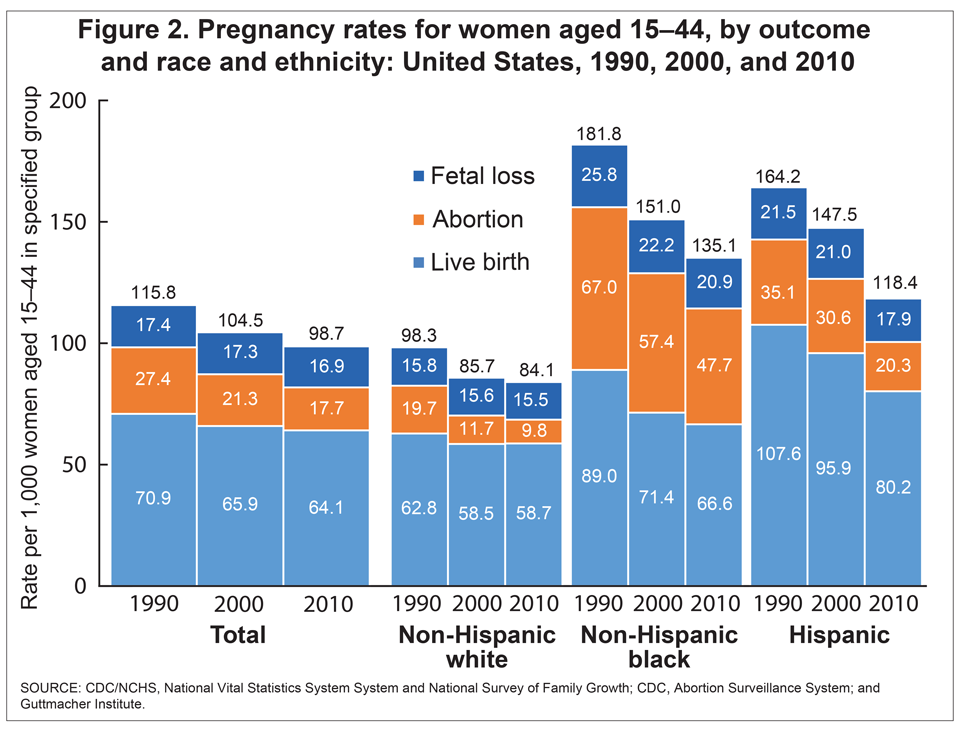
Pregnancy rates in 2010 were highest for non-Hispanic black women (135.1 per 1,000 women aged 15–44), intermediate for Hispanic women (118.4), and lowest for non-Hispanic white women (84.1) (Figure 2). Substantial differences were seen by race and ethnicity in rates by pregnancy outcome, with Hispanic women having the highest birth rate in 2010 (80.2) and non-Hispanic black women having the highest abortion rate (47.7). During the 1990–2010 period, pregnancy rates dropped more for non-Hispanic black (26% decline) and Hispanic women (28% decline) than for non-Hispanic white women (14% decline), thus narrowing the differences between the groups (Figure 2). All groups had larger percent reductions in abortion than birth rates over the 1990–2010 period.
While pregnancy estimates are constrained by the availability of data for all three outcomes, births comprise the majority (almost two-thirds) of all pregnancy outcomes, and birth rates continued to drop during 2011–2013 (1). The most recent national abortion estimates also show the number and rate of abortions dropped between 2010 and 2011 (3).
Data source and methods
This analysis combines data on births from the National Vital Statistics System, data on abortions from the Abortion Surveillance System and Guttmacher Institute, and data on fetal losses from several cycles of the National Survey of Family Growth. Numbers and rates of these pregnancy outcomes are computed separately and added together to derive total pregnancy numbers and rates. The methodology has been discussed in detail elsewhere (4, 5). Estimates of fetal losses depend on the degree to which losses at very early gestations are detected. Detailed tables with number of pregnancies by outcome for 2010 by age and race and ethnicity, pregnancy rates by outcome for 1990–2010 by age and race and ethnicity, and pregnancy rates by marital status and race and ethnicity are available by request from Births@cdc.gov.
References
- Martin JA, Hamilton BE, Osterman MJK, et al. Births: Final data for 2013. National vital statistics reports; vol 64 no 1. Hyattsville, MD: National Center for Health Statistics. 2015. Available from: https://www.cdc.gov/nchs/data/nvsr/nvsr64/nvsr64_01.pdf.
- Curtin SC, Abma JC, Ventura SJ, Henshaw SK. Pregnancy rates for U.S. women continue to drop. NCHS data brief, no 136. Hyattsville, MD: National Center for Health Statistics. 2013. Available from: https://www.cdc.gov/nchs/data/databriefs/db136.pdf.
- Jones RK, Jerman J. Abortion incidence and service availability in the United States, 2011. Perspect Sex Reprod Health 46(1):3–14. 2014.
- Ventura SJ, Curtin SC, Abma JC, Henshaw SK. Estimated pregnancy rates and rates of pregnancy outcomes for the United States, 1990–2008. National vital statistics reports; vol 60 no 7. Hyattsville, MD: National Center for Health Statistics. 2012. Available from: https://www.cdc.gov/nchs/data/nvsr/nvsr60/nvsr60_07.pdf.
- Ventura SJ, Mosher WD, Curtin SC, et al. Trends in pregnancies and pregnancy rates by outcome: Estimates for the United States, 1976–96. Vital Health Stat 21(56). Hyattsville, MD: National Center for Health Statistics. 2000. Available from: https://www.cdc.gov/nchs/data/series/sr_21/sr21_056.pdf.
Suggested citation: Curtin SC, Abma JC, Kost K. 2010 pregnancy rates among U.S. women. NCHS health e-stat. 2015.
Figures
Figure 1. Pregnancy rates by age: United States, 1990, 2000, and 2010
SOURCE: CDC/NCHS, National Vital Statistics System and National Survey of Family Growth; CDC, Abortion Surveillance System; and Guttmacher Institute
Figure 2. Pregnancy rates for women aged 15-44 by outcome and race and ethnicity: United States, 1990, 2000, and 2010
SOURCE: CDC/NCHS, National Vital Statistics System and National Survey of Family Growth; CDC, Abortion Surveillance System; and Guttmacher Institute
Tables
Table 1. Numbers and rates (per 1,000 women aged 15–44) of pregnancies and
pregnancy outcomes and number of women: United States, 1976–2010
| Year | All pregnancies | Women aged 15–44 |
|||||||
|---|---|---|---|---|---|---|---|---|---|
| Total | Live births | Induced abortions | 1Fetal losses | Total | Live births | Induced abortions | 1Fetal losses | ||
| Number (thousands) |
2Rate per 1,000 women aged 15–44 years |
Number (thousands) | |||||||
| 2010 | 6,155 | 3,999 | 1,103 | 1,053 | 98.7 | 64.1 | 17.7 | 16.9 | 62,375 |
| 2009 | 6,369 | 4,131 | 1,152 | 1,087 | 102.1 | 66.2 | 18.5 | 17.4 | 62,373 |
| 2008 | 6,578 | 4,248 | 1,212 | 1,118 | 105.5 | 68.1 | 19.4 | 17.9 | 62,360 |
| 2007 | 6,663 | 4,316 | 1,210 | 1,137 | 107.0 | 69.3 | 19.4 | 18.2 | 62,292 |
| 2006 | 6,632 | 4,266 | 1,242 | 1,124 | 106.6 | 68.6 | 20.0 | 18.1 | 62,190 |
| 2005 | 6,435 | 4,138 | 1,206 | 1,091 | 103.7 | 66.7 | 19.4 | 17.6 | 62,071 |
| 2004 | 6,424 | 4,112 | 1,222 | 1,090 | 103.7 | 66.4 | 19.7 | 17.6 | 61,969 |
| 2003 | 6,415 | 4,090 | 1,250 | 1,075 | 103.7 | 66.1 | 20.2 | 17.4 | 61,888 |
| 2002 | 6,347 | 4,022 | 1,269 | 1,056 | 102.6 | 65.0 | 20.5 | 17.1 | 61,856 |
| 2001 | 6,374 | 4,026 | 1,291 | 1,057 | 103.1 | 65.1 | 20.9 | 17.1 | 61,795 |
| 2000 | 6,438 | 4,059 | 1,313 | 1,066 | 104.5 | 65.9 | 21.3 | 17.3 | 61,577 |
| 1999 | 6,286 | 3,959 | 1,315 | 1,011 | 102.2 | 64.4 | 21.4 | 16.5 | 61,475 |
| 1998 | 6,266 | 3,942 | 1,319 | 1,006 | 102.2 | 64.3 | 21.5 | 16.4 | 61,326 |
| 1997 | 6,205 | 3,881 | 1,335 | 989 | 101.6 | 63.6 | 21.9 | 16.2 | 61,041 |
| 1996 | 6,240 | 3,891 | 1,360 | 988 | 102.8 | 64.1 | 22.4 | 16.3 | 60,704 |
| 1995 | 6,245 | 3,900 | 1,359 | 986 | 103.5 | 64.6 | 22.5 | 16.3 | 60,368 |
| 1994 | 6,370 | 3,953 | 1,423 | 994 | 106.1 | 65.9 | 23.7 | 16.6 | 60,020 |
| 1993 | 6,494 | 4,000 | 1,495 | 999 | 108.8 | 67.0 | 25.0 | 16.7 | 59,712 |
| 1992 | 6,603 | 4,065 | 1,529 | 1,009 | 111.1 | 68.4 | 25.7 | 17.0 | 59,417 |
| 1991 | 6,682 | 4,111 | 1,557 | 1,014 | 112.7 | 69.3 | 26.2 | 17.1 | 59,305 |
| 1990 | 6,786 | 4,158 | 1,609 | 1,019 | 115.8 | 70.9 | 27.4 | 17.4 | 58,619 |
| 1989 | 6,527 | 4,041 | 1,567 | 919 | 111.8 | 69.2 | 26.8 | 15.7 | 58,367 |
| 1988 | 6,393 | 3,910 | 1,591 | 893 | 110.0 | 67.3 | 27.4 | 15.4 | 58,120 |
| 1987 | 6,183 | 3,809 | 1,559 | 815 | 106.8 | 65.8 | 26.9 | 14.1 | 57,901 |
| 1986 | 6,129 | 3,757 | 1,574 | 798 | 106.7 | 65.4 | 27.4 | 13.9 | 57,430 |
| 1985 | 6,144 | 3,761 | 1,589 | 795 | 108.3 | 66.3 | 28.0 | 14.0 | 56,716 |
| 1984 | 6,019 | 3,669 | 1,577 | 773 | 107.4 | 65.5 | 28.1 | 13.8 | 56,031 |
| 1983 | 5,977 | 3,639 | 1,575 | 763 | 108.0 | 65.7 | 28.5 | 13.8 | 55,359 |
| 1982 | 6,024 | 3,681 | 1,574 | 769 | 110.1 | 67.3 | 28.8 | 14.1 | 54,700 |
| 1981 | 5,958 | 3,629 | 1,577 | 751 | 110.5 | 67.3 | 29.3 | 13.9 | 53,926 |
| 1980 | 5,912 | 3,612 | 1,554 | 746 | 111.9 | 68.4 | 29.4 | 14.1 | 52,833 |
| 1978 | 5,714 | 3,494 | 1,498 | 722 | 109.9 | 67.2 | 28.8 | 13.9 | 52,016 |
| 1978 | 5,433 | 3,333 | 1,410 | 690 | 106.7 | 65.5 | 27.7 | 13.5 | 50,921 |
| 1977 | 5,331 | 3,327 | 1,317 | 687 | 107.0 | 66.8 | 26.4 | 13.8 | 49,814 |
| 1976 | 5,002 | 3,168 | 1,179 | 655 | 102.7 | 65.0 | 24.2 | 13.4 | 48,721 |
1Spontaneous fetal losses from recognized pregnancies of all gestational periods as reported by women in the 1982, 1988, 1995, 2002, and 2006–2010 National Surveys of Family Growth, conducted by the National Center for Health Statistics. The rate of pregnancy loss depends on the degree to which losses at very early gestations are detected.
2Computed by relating the number of events to women of all ages to women aged 15–44.
NOTES: Due to rounding, figures may not add to totals. Rates for 2001–2005 have been revised using intercensal population estimates based on the 2000 and 2010 censuses and may differ from rates previously published.
Table 2. Pregnancy rates, by age of woman: United States, 1990-2010
[Rates are pregnancy per 1,000 women in specified group, estimated as of
April 1 for 1990, 2000, and 2010 and as of July 1 for all other years.]
| Year | 1Total | Age of woman | ||||||||
|---|---|---|---|---|---|---|---|---|---|---|
| 2Under 15 years | 15-19 years | 20-24 years | 25-29 years | 30-34 years | 35-39 years | 340-44 years | ||||
| Total | 15-17 years | 18-19 years | ||||||||
| 2010 | 98.7 | 1.1 | 58.9 | 32.2 | 96.8 | 144.6 | 157.1 | 136.5 | 76.5 | 19.4 |
| 2009 | 102.1 | 1.2 | 65.3 | 36.4 | 106.3 | 153.8 | 162.0 | 138.0 | 77.0 | 19.2 |
| 2008 | 105.5 | 1.4 | 69.8 | 39.5 | 114.2 | 163.0 | 167.9 | 141.2 | 78.5 | 18.8 |
| 2007 | 107.0 | 1.5 | 71.9 | 40.6 | 119.6 | 167.5 | 171.8 | 142.5 | 79.5 | 18.3 |
| 2006 | 106.6 | 1.5 | 72.1 | 40.9 | 120.2 | 169.0 | 172.9 | 140.8 | 79.7 | 18.0 |
| 2005 | 103.7 | 1.6 | 70.2 | 40.2 | 116.2 | 163.4 | 170.5 | 137.5 | 77.7 | 17.5 |
| 2004 | 103.7 | 1.6 | 71.9 | 41.4 | 117.6 | 164.8 | 174.5 | 135.1 | 77.2 | 17.3 |
| 2003 | 103.7 | 1.6 | 73.6 | 42.9 | 119.9 | 166.6 | 172.0 | 136.6 | 73.7 | 16.8 |
| 2002 | 102.6 | 1.7 | 76.3 | 44.5 | 124.4 | 168.9 | 170.0 | 133.0 | 70.4 | 16.2 |
| 2001 | 103.1 | 1.8 | 80.8 | 47.1 | 130.8 | 173.7 | 169.1 | 131.9 | 68.8 | 15.7 |
| 2000 | 104.5 | 2.0 | 85.8 | 51.6 | 135.8 | 180.7 | 168.9 | 131.1 | 67.5 | 15.4 |
| 1999 | 102.2 | 2.1 | 86.9 | 53.1 | 136.6 | 177.8 | 166.0 | 125.1 | 64.7 | 14.6 |
| 1998 | 102.2 | 2.3 | 90.1 | 56.7 | 140.3 | 178.9 | 164.7 | 122.4 | 63.3 | 14.4 |
| 1997 | 101.6 | 2.4 | 92.7 | 59.5 | 144.3 | 178.7 | 162.5 | 119.5 | 61.4 | 13.9 |
| 1996 | 102.8 | 2.7 | 97.0 | 63.4 | 149.0 | 180.5 | 163.2 | 118.4 | 60.6 | 13.5 |
| 1995 | 103.5 | 2.9 | 101.1 | 67.4 | 153.4 | 179.8 | 162.8 | 117.0 | 59.1 | 13.1 |
| 1994 | 106.1 | 3.2 | 106.1 | 71.1 | 159.6 | 184.8 | 166.1 | 116.7 | 58.5 | 12.9 |
| 1993 | 108.8 | 3.2 | 109.4 | 72.7 | 164.1 | 190.4 | 169.8 | 116.6 | 57.7 | 12.4 |
| 1992 | 111.1 | 3.3 | 112.3 | 73.5 | 169.3 | 194.3 | 173.1 | 116.6 | 57.4 | 12.0 |
| 1991 | 112.7 | 3.3 | 116.4 | 76.1 | 172.1 | 196.8 | 174.9 | 116.2 | 56.8 | 11.3 |
| 1990 | 115.8 | 3.4 | 116.8 | 77.1 | 167.7 | 198.5 | 179.0 | 118.8 | 56.9 | 11.4 |
| % change 2010 compared with 1990 | -15 | -68 | -50 | -58 | -42 | -27 | -12 | 15 | 34 | 70 |
1Rates computed by relating the number of events to women of all ages to women aged 15-44 years.
2Rates computed by relating the number of events to women under age 15 years to women aged 10-14 years.
3Rates computed by relating the number of events to women aged 40 years and over to women aged 40-44 years.