Alcohol-induced Deaths in Adults Aged 65 and Over: United States, 2019 and 2020
by Ellen A. Kramarow, Ph.D., and Betzaida Tejada-Vera, M.S.
In 2020, alcohol-induced causes were recorded as the underlying cause of death for 11,616 adults aged 65 and over (1). Although these deaths comprise less than 1% of all deaths in this age group, age-adjusted death rates for alcohol-induced causes have been increasing since 2011 and rose by 18.2% from 2019 (17.0 deaths per 100,000 standard population) to 2020 (20.1) (1). This report presents death rates for alcohol-induced deaths in 2019 and 2020 for the population aged 65 and over by age group, sex, and race and Hispanic origin.
From 2019 to 2020, alcohol-induced death rates increased for both men and women aged 65–74 and 75 and over (Figure 1). For men aged 65–74, rates increased from 36.5 deaths per 100,000 population to 43.4, while rates for men aged 75 and over increased from 19.8 to 21.5. Death rates for women increased from 10.2 to 12.9 for those aged 65–74, and from 4.4 to 5.3 for those aged 75 and over. Alcohol-induced death rates were higher for men than women in 2020—3.4 times higher for age group 65–74 and 4.1 times higher for 75 and over.
In 2020, age-adjusted rates of alcohol-induced deaths in adults aged 65 and over were highest for non-Hispanic American Indian or Alaska Native (AIAN) adults (55.1 deaths per 100,000 standard population), followed by rates for Hispanic (23.1), non-Hispanic White (20.7), non-Hispanic Black (17.6), and non-Hispanic Asian (4.7) adults (Figure 2). From 2019 to 2020, age-adjusted rates increased by 9.5% for Hispanic adults, 46.5% for non-Hispanic AIAN adults, 19.7% for non-Hispanic Black adults, and 19.0% for non-Hispanic White adults. The change in death rates for non-Hispanic Asian adults was not statistically significant.
Data sources and methods
Estimates in this report are based on the National Vital Statistics System underlying cause-of-death files, accessed via CDC WONDER (1). Alcohol-induced deaths include dependent and nondependent use of alcohol, and deaths from accidental poisoning by alcohol. Deaths are identified using the International Classification of Diseases, 10th Revision underlying cause-of-death codes E24.4, Alcohol-induced pseudo-Cushing syndrome; F10, Mental and behavioral disorders due to alcohol use; G31.2, Degeneration of nervous system due to alcohol; G62.1, Alcoholic polyneuropathy; G72.1, Alcoholic myopathy; I42.6, Alcoholic cardiomyopathy; K29.2, Alcoholic gastritis; K70, Alcoholic liver disease; K85.2, Alcohol-induced acute pancreatitis; K86.0, Alcohol-induced chronic pancreatitis; R78.0, Finding of alcohol in blood; X45, Accidental poisoning by and exposure to alcohol; X65, Intentional self-poisoning by and exposure to alcohol; and Y15, Poisoning by and exposure to alcohol, undetermined intent (2). Alcohol-induced causes exclude unintentional injuries, homicides, and other causes of death from conditions either indirectly or partially related to alcohol use, such as heart disease or cancer. Age-adjusted death rates were calculated using the direct method and the 2000 U.S. standard population (3). Pairwise comparisons of rates were conducted using a z test with an alpha level of 0.05 (4). Data for categories other than non-Hispanic White and non-Hispanic Black should be interpreted with caution because of inconsistencies in reporting race and ethnicity on death certificates, censuses, and surveys (5,6).
References
- Centers for Disease Control and Prevention. CDC WONDER. About underlying cause of death, 2018–2020, single race. 2021. Available from: https://wonder.cdc.gov/ucd-icd10-expanded.html.
- World Health Organization. International statistical classification of diseases and related health problems, 10th revision (ICD–10). 5th ed. 2016.
- Anderson RN, Rosenberg HM. Age standardization of death rates: Implementation of the year 2000 standard. National Vital Statistics Reports; vol 47 no. 3. Hyattsville, MD: National Center for Health Statistics. 1998.
- Xu JQ, Murphy SL, Kochanek KD, Arias E. Deaths: Final data for 2019. National Vital Statistics Reports; vol 70 no 8. Hyattsville, MD: National Center for Health Statistics. 2021. DOI: https://dx.doi.org/10.15620/cdc:106058.
- Arias E, Heron M, Hakes JK. The validity of race and Hispanic-origin reporting on death certificates in the United States: An update. National Center for Health Statistics. Vital Health Stat 2(172). 2016. Available from: https://www.cdc.gov/nchs/data/series/sr_02/sr02_172.pdf.
- Arias E, Xu JQ, Curtin S, Bastian B, Tejada-Vera B. Mortality profile of the non-Hispanic American Indian or Alaska Native population, 2019. National Vital Statistics Reports; vol 70 no 12. Hyattsville, MD: National Center for Health Statistics. 2021. DOI: https://dx.doi.org/10.15620/cdc:110370.
Suggested citation
Kramarow EA, Tejada-Vera B. Alcohol-induced deaths in adults aged 65 and over: United States, 2019 and 2020. NCHS Health E-Stats. 2022. DOI: https://dx.doi.org/10.15620/cdc:122045.
Figures
Figure 1. Rate of alcohol-induced death for adults aged 65 and over, by age group, sex, and year: United States, 2019 and 2020
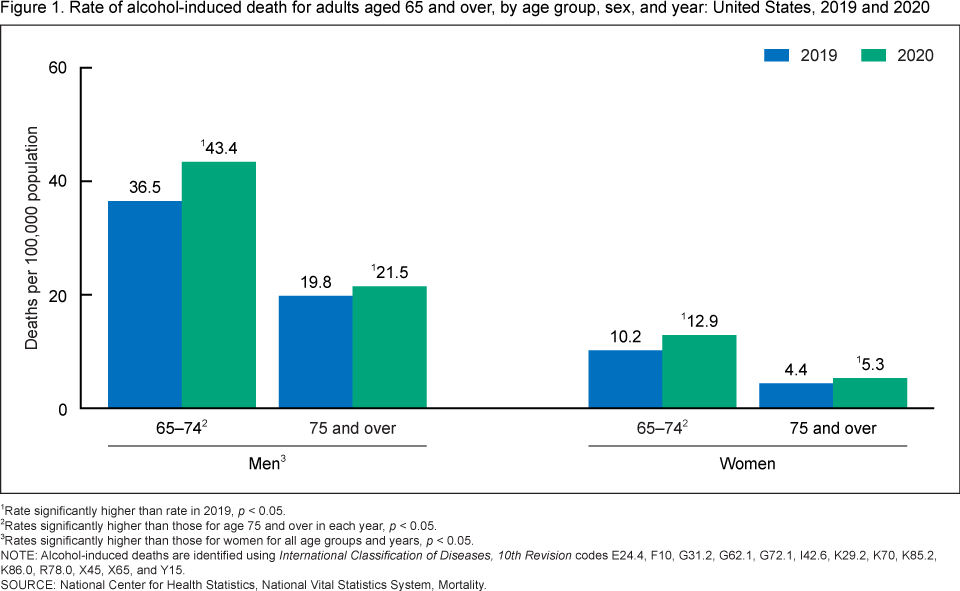
1Rate significantly higher than rate in 2019, p < 0.05.
2Rates significantly higher than those for age 75 and over in each year, p < 0.05.
3Rates significantly higher than those for women for all age groups and years, p < 0.05.
NOTE: Alcohol-induced deaths are identified using International Classification of Diseases, 10th Revision codes E24.4, F10, G31.2, G62.1, G72.1, I42.6, K29.2, K70, K85.2, K86.0, R78.0, X45, X65, and Y15.
SOURCE: National Center for Health Statistics, National Vital Statistics System, Mortality.
Figure 2. Age-adjusted rate of alcohol-induced death for adults aged 65 and over, by race and Hispanic origin and year: United States, 2019 and 2020
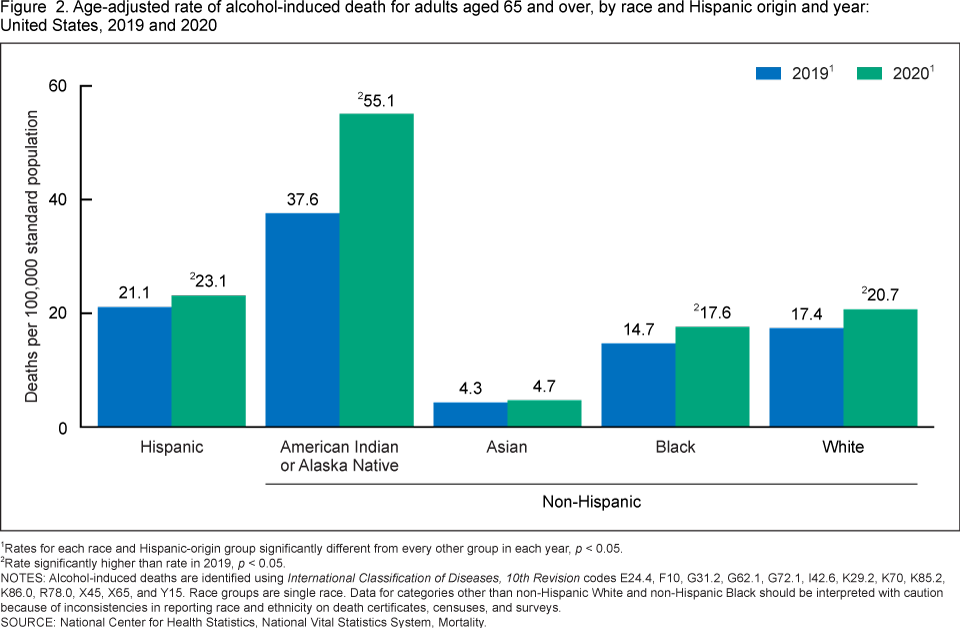
1Rates for each race and Hispanic-origin group significantly different from every other group in each year, p < 0.05.
2Rate significantly higher than rate in 2019, p < 0.05.
NOTES: Alcohol-induced deaths are identified using International Classification of Diseases, 10th Revision codes E24.4, F10, G31.2, G62.1, G72.1, I42.6, K29.2, K70, K85.2, K86.0, R78.0, X45, X65, and Y15. Race groups are single race. Data for categories other than non-Hispanic White and non-Hispanic Black should be interpreted with caution because of inconsistencies in reporting race and ethnicity on death certificates, censuses, and surveys.
SOURCE: National Center for Health Statistics, National Vital Statistics System, Mortality.