 An official website of the United States government



Use of Nowcasting to Estimate Real-Time Transmission Trends During a Measles Outbreak — South Carolina, October 2025–March 2026
Weekly / August 27, 2026 / 75(33);516–521
Paige B. Miller, PhD1,*; Isobel Routledge, PhD2,3,*; Emily D. Pollock, PhD1,*; Adria D. Mathis, MSPH4; Kelley Raines, MPH4; Dina Mistry, PhD1; Laureen Mitchell, MSN5; Taidy Perez, MPH5; LaKita Johnson, MPH5; Isaac Ghinai, MBBS2; Matthew Biggerstaff, ScD6; Katelyn M. Gostic, PhD1; Rebecca Kahn, PhD2; Marco Tori, MD5,7 (View author affiliations)
View suggested citationSummary
What is already known about this topic?
Measles is a highly infectious, vaccine-preventable disease. During October 2025–March 2026, South Carolina experienced a large measles outbreak. Reporting delays can complicate real-time assessments of outbreak trends. Nowcasting uses models to adjust for incomplete reported data based on historical reporting delays, to estimate current trends in disease metrics. CDC has applied nowcasting to routine respiratory surveillance data, but rarely in an outbreak setting.
What is added by this report?
CDC developed a nowcast model that corrected for reporting delays to estimate real-time case counts and the effective reproduction number (Rt). Although accuracy depended on the stability of case reporting patterns, the model improved situational awareness and provided more reliable real-time signals than did provisional case counts alone.
What are the implications for public health practice?
When surveillance data are timely and consistently reported, nowcasting can help support public health decision-making in outbreak response.
Altmetric:
Abstract
During October 2025–March 2026, South Carolina experienced the largest measles outbreak in the United States in approximately 30 years, with 997 cases reported. The South Carolina Department of Public Health reported confirmed measles cases to CDC through regular updates of provisional (initially reported) line-list data, including essential date fields for each case (rash onset and public health report dates). As in all disease surveillance systems, because provisional data are subject to reporting delays, determining current transmission trends is challenging. CDC developed a nowcasting estimation model to generate real-time estimates that correct for reporting delays. Real-time estimates were generated for the final case counts and time-varying effective reproduction number (Rt), an indicator of whether the rate of new infections is increasing or decreasing. Whether case reporting during an active measles outbreak would be stable enough to support accurate real-time nowcasting was unknown before the data in this report were analyzed. During this outbreak, nowcasts improved estimates of cumulative outbreak size compared with provisional data, and Rt estimates generally captured underlying transmission trends. Nowcast estimates of daily cases were generally accurate, although accuracy declined in January when provisional data were less complete than expected because of a rapid increase in cases. These results demonstrate that if essential date fields are consistently collected, nowcasting can support situational awareness and decisions about response capacity by providing real-time estimates of daily case counts and transmission trends.
Introduction
Measles is a highly contagious viral disease (1). Large measles outbreaks are becoming increasingly common in the United States, often affecting communities with low vaccination coverage (2). During October 2025–March 2026, South Carolina experienced the largest measles outbreak in the United States in 3 decades: 997 cases were reported (3). Measles is a nationally notifiable disease, and although the South Carolina Department of Public Health (SCDPH) reported cases to CDC approximately twice weekly, provisional (initially reported) data are subject to lags in reporting, even in robust surveillance systems. Cases with recent rash onset might not yet be reported because of delays in seeking health care, specimen testing, and case investigation. As a result, incomplete reporting can result in the appearance that an outbreak is waning when it is actually growing.
Nowcasting models can correct for these routine reporting delays and enable real-time estimation of crucial metrics based on available but incomplete data and historical reporting patterns, including the effective reproduction number (Rt). Rt measures the average number of secondary infections caused by a single infected person at a given time and indicates whether an outbreak is growing (Rt >1), stable (Rt = approximately 1), or decreasing (Rt <1). Adjusting for reporting delays is most accurate when delays are relatively stable over time. CDC has applied nowcasting to routine respiratory surveillance data (4). However, it was not known whether reporting delays would be sufficiently consistent or provisional data sufficiently complete to support nowcasting during measles outbreak responses. This report describes an evaluation of nowcasting models used during the South Carolina measles outbreak response.
Methods
Data Source
At the start of the outbreak, SCDPH provided deidentified line-list data containing rash onset date for each case reported to CDC. Beginning on December 19, 2025, SCDPH added the public health report date for each case to line-list updates. This was the date that SCDPH was notified of the case, either from laboratory reporting, clinical provider reporting, or contact investigation. The reporting delay was defined as the interval between rash onset and public health report date, accounting for both the delay in seeking medical care and the delay in reporting to a public health authority. Cases in some patients had been reported to SCDPH as contacts of a measles case before rash onset; reporting delays from these cases (which were negative) were not included in estimates of reporting delay distributions. Cases with a report date but missing rash onset date were excluded from real-time analyses; rash onset dates were often backfilled by SCDPH in subsequent line lists.
Statistical Analyses
EpiNow2 (5) (version 1.9.9; R package) was used to build the nowcast model. The model generated estimates by adjusting provisional data for reporting delays: 1) the true number of recent case counts, with prediction intervals (PIs), which are the range of values with a stated probability of including the final case count and 2) Rt, with associated credible intervals (CIs), which represent the probability that the true value exceeded 1. CDC estimated the reporting delay distribution by fitting a nonparametric distribution to observed delays. Rt was estimated using a renewal model, which assumes that each case generates future cases based on the generation interval† (6) and the incubation period§ (6,7). Outbreak trends were categorized using CIs for Rt >1.¶ The code for these models is publicly available for use by jurisdictional and academic partners (GitHub |CDC Measles Nowcasting 2026).
Nowcasts and Rt estimates were generated for each provisional dataset, and estimates were compared with final daily and cumulative case counts. Performance of nowcasted case counts was assessed using coverage of PIs (i.e., the proportion of final daily case counts within the PI during the nowcast period)** (8). Coverage of PIs was calculated for estimates of case counts during the observation period, which was defined as the 2-week period leading up to each line-list receipt date, when provisional data were most likely to be affected by reporting delays. Rt categories were qualitatively evaluated by visually comparing their categorization with trends evident in the final, fully reported daily case-count series.
Results
Characteristics of Provisional and Nowcast Data
The estimated median delay (interval) between rash onset and public health report date was 2–3 days (Supplementary Table 1), with an average of 92.8% of cases reported within 14 days of rash onset. Provisional counts were less complete at the end of the observation period and demonstrated an apparent decline in reported cases that updated datasets revealed to be an artifact of reporting delays and backfilling (updating missing rash onset dates for cases once case investigations were complete) (Supplementary Figure). The percentage of cases in provisional line lists that were missing rash onset date and therefore excluded from the analysis ranged from 0% (no cases) to 10% (66 cases). In addition, 362 (36.7%) cases were identified through contact tracing before rash onset, meaning their report date preceded their symptom onset date; thus, the interval from symptom onset to public health report date appeared negative for certain cases. These cases were included in the analysis; however, they were excluded from estimates of delay distributions.
Accuracy of the Nowcast Model
The first two nowcasts were produced using line lists from December 19 and 23, 2025, when provisional data contained 76.5%–77.2% of final counts (Table) and indicated declining trends. Nowcasts included final daily and cumulative counts within 90% PIs and indicated a likely increasing trend (Figure 1). Partially because of these estimates, SCDPH maintained high staffing levels during the winter holiday period and began hiring additional staff members. After the holiday period, case counts increased rapidly (final cumulative counts increased from 185 to 424 from December 23, 2025, to January 6, 2026), with backfilling of cases throughout January. On January 6, provisional data only contained 25.7% of final counts, reflecting a lower than expected rate of reporting. Nowcasts of the January 6 data underestimated final values and fell outside 90% PIs (Table) (Supplementary Table 2); however, they still improved the real-time estimate of cumulative daily case counts relative to provisional counts and provided an accurate estimate of whether the trend was increasing or decreasing. Rt trends continued to indicate that the outbreak was increasing or likely increasing during this time.
The number of cases peaked on January 13–14 (Figure 1). The model did not detect the decline in the January 16 or 23 data (Supplementary Table 2). Despite missing this shift, nowcasts improved estimates of total outbreak size by 10.5%–11.3% compared with provisional counts (Figure 2). On January 27, the model estimated that the outbreak was likely decreasing.
After January 23, 2026, nowcasts captured cumulative and daily case counts within 90% PIs, coinciding with high reporting (72.1%–88.5% of final cases). Nowcasts indicated that cases were decreasing or likely decreasing, although median estimates remained below final counts (Supplementary Table 2), consistent with ongoing efforts to backfill cases from earlier in January (Supplementary Figure). Nowcasts provided reassurance that the declines observed in late January were true declines rather than artifacts of delayed reporting, enabling deescalation of SCDPH response efforts during February and March.
Discussion
During this measles outbreak, nowcasting improved situational awareness by correcting for reporting lags. Accuracy was highest during periods of sustained transmission and decline, when reporting patterns remained relatively stable. During periods of rapidly increasing case counts and temporary declines in reporting completeness, nowcasts underestimated final case counts. Nevertheless, this outbreak highlights that nowcasting can provide a useful indicator of outbreak trends, even when surveillance data are incomplete.
The nowcasting model produced estimates within minutes of receiving updated line lists and integrated outputs into automated reports shared with SCDPH. Inclusion of rash onset and public health report dates enabled nowcasting with little additional effort from frontline staff members. Nowcasting was bolstered by SCDPH contact tracing efforts and investment in disease surveillance, which likely contributed to shorter and more consistent reporting patterns. Because this nowcasting method relies primarily on surveillance data, it can be readily deployed during outbreaks when granular data are not yet available, although estimates might be less stable during periods of rapid increases in case counts or changes in reporting completeness. In practice, these estimates complemented provisional data and other surveillance indicators to support the hiring of additional response staff members.
Although nowcasting has been applied to outbreaks retrospectively (9) and to routine surveillance data (4), this report describes the first CDC implementation of nowcasting during an active measles outbreak. As analytic methods and the underlying surveillance data improve, these tools could become more reliable and provide more actionable results.
Limitations
The findings in this report are subject to at least three limitations. First, transmission increased rapidly at the end of December, likely because of changes in contact patterns around holiday gatherings. The nowcast model did not account for this. Relatedly, provisional data completeness decreased in January because of backfilling and backlogging (case counts missing from provisional data despite being later reported). Accordingly, nowcasts were least accurate and cases were underestimated during these weeks. Nevertheless, nowcasts accurately reflected the general trend, whereas the provisional data did not. Second, although estimates from this nowcasting approach were sufficient to support situational awareness, other nowcasting methods might perform better by incorporating epidemiologic changes or allowing for more rapid changes in Rt. EpiNow2 was selected because it jointly estimates case counts and Rt and could be quickly applied to this outbreak. During estimation of the reporting delay, right truncation was not accounted for,†† potentially contributing to underestimation of cases during periods of outbreak growth (10). Furthermore, more than one third of cases (36.7%) in this outbreak were identified through contact tracing before the rash onset. Because this early identification does not represent the reporting delay that the model is intended to correct for, these cases were excluded when estimating reporting delay distributions. Finally, no objective reference exists against which to validate Rt trends. This absence posed challenges to quantitatively evaluating the accuracy of estimated Rt trends. Given the short period during which this measles outbreak peaked and declined, contemporaneous Rt estimates were visually compared with final data.
Implications for Public Health Practice
During a disease outbreak, all surveillance data are subject to reporting delays. Nowcasting can help correct for these delays and provide more accurate, real-time information. In this response, SCDPH used nowcasts to interpret provisional measles case counts, distinguish true declines from reporting artifacts, and support decisions to hire additional staff members. With these systems in place, nowcasting can provide a practical tool for real-time estimation of case counts and epidemic trends.
Acknowledgments
South Carolina Department of Public Health Measles Response Team; Damon Bayer, Zachary Susswein, Predict Division, Center for Forecasting and Outbreak Analytics, CDC; Inga Holmdahl, Inform Division, Center for Forecasting and Outbreak Analytics, CDC.
Corresponding author: Paige B. Miller, pmiller3@cdc.gov.
1Predict Division, Center for Forecasting and Outbreak Analytics, CDC; 2Inform Division, Center for Forecasting and Outbreak Analytics, CDC; 3Goldbelt C6, Washington, DC; 4Division of Viral Diseases, National Center for Immunization and Respiratory Diseases, CDC; 5South Carolina Department of Public Health; 6Influenza Division, National Center for Immunization and Respiratory Diseases, CDC; 7Division of State and Local Readiness, Office of Readiness and Response, CDC.
All authors have completed and submitted the International Committee of Medical Journal Editors form for disclosure of potential conflicts of interest. No potential conflicts of interest were disclosed.
* These authors contributed equally to this report.
† The time between date of infection for primary and secondary case pairs, assumed to be gamma distributed with a mean of 11.7 days and a variance of 9 days.
§ The time between infection to rash onset, assumed to be gamma distributed with a mean of 10 days and a variance of 9 days.
¶ The trend thresholds used for the posterior probability that Rt exceeded 1 were as follows: ≥95% (increasing), 60% to <95% (likely increasing), 40% to <60% (stable), 5% to <40% (likely decreasing), and <5% (decreasing).
** The coverage describes the percentage of final observations that fall within a given range. The 90% PI of a well-calibrated model should include the true value approximately 90% of the time (i.e., should be 90% coverage).
†† Right truncation of reporting delays means that long reporting delays that were not yet observed were not accounted for in estimation of the reporting delay distribution.
References
- CDC. Measles (rubeola): clinical overview of measles. Atlanta, GA: US Department of Health and Human Services, CDC; 2026. https://www.cdc.gov/measles/hcp/clinical-overview/index.html
- CDC. Measles (rubeola): measles cases and outbreaks. Atlanta, GA: US Department of Health and Human Services, CDC; 2026. https://www.cdc.gov/measles/data-research/index.html
- South Carolina Department of Public Health. 2025 measles outbreak. Cayce, SC: South Carolina Department of Public Health; 2026. https://dph.sc.gov/diseases-conditions/infectious-diseases/measles-rubeola/2025-measles-outbreak
- Richard DM, Susswein Z, Connolly S, et al. Detection of real-time changes in direction of COVID-19 transmission using national- and state-level epidemic trends based on Rt estimates—United States overall and New Mexico, April–October 2024. MMWR Morb Mortal Wkly Rep 2024;73:1058–63. https://doi.org/10.15585/mmwr.mm7346a3 PMID:39570787
- Abbott S, Hellewell J, Sherratt K, et al. EpiForecasts. EpiNow2: estimate real-time case counts and time-varying epidemiological parameters. London, England: London School of Hygiene & Tropical Medicine; 2024. https://epiforecasts.io/EpiNow2/
- Klinkenberg D, Nishiura H. The correlation between infectivity and incubation period of measles, estimated from households with two cases. J Theor Biol 2011;284:52–60. https://doi.org/10.1016/j.jtbi.2011.06.015 PMID:21704640
- CDC. Health Alert Network (HAN): expanding measles outbreak in the United States and guidance for the upcoming travel season. Atlanta, GA: US Department of Health and Human Services, CDC; 2025. https://www.cdc.gov/han/php/notices/han00522.html
- Gneiting T, Balabdaoui F, Raftery AE. Probabilistic forecasts, calibration and sharpness. J R Stat Soc Series B Stat Methodol 2007;69:243–68. https://doi.org/10.1111/j.1467-9868.2007.00587.x
- Charniga K, Madewell ZJ, Masters NB, Asher J, Nakazawa Y, Spicknall IH. Nowcasting and forecasting the 2022 U.S. mpox outbreak: support for public health decision making and lessons learned. Epidemics 2024;47:100755. https://doi.org/10.1016/j.epidem.2024.100755 PMID:38452454
- Charniga K, Park SW, Akhmetzhanov AR, et al. Best practices for estimating and reporting epidemiological delay distributions of infectious diseases. PLOS Comput Biol 2024;20:e1012520. https://doi.org/10.1371/journal.pcbi.1012520 PMID:39466727

Abbreviation: PI = prediction interval.
* Provisional cases are the cumulative number of cases with rash onset date reported at the time of each line list. The percentage of cases with a missing rash onset date that were excluded ranged from 0% to 10% across all line lists. Final cases are the cumulative number of cases at each previous line-list date as reported in the final March 17, 2026, line list.
† Number of incident cases reported relative to final case counts during the nowcast period (14 days before line-list date). The absolute percent improvement is the difference between the percentage of final cases estimated by median cumulative nowcast and the proportion of cumulative cases in provisional data.
§ Coverage indicates the proportion of final daily case counts within PI during the nowcast period for each line list. The 90% PI of a well-calibrated model should include the true value approximately 90% of the time (i.e., coverage should be 90%).
 FIGURE 1. Measles outbreak transmission trends* estimated by nowcast modeling† — South Carolina, September 20, 2025–March 17, 2026
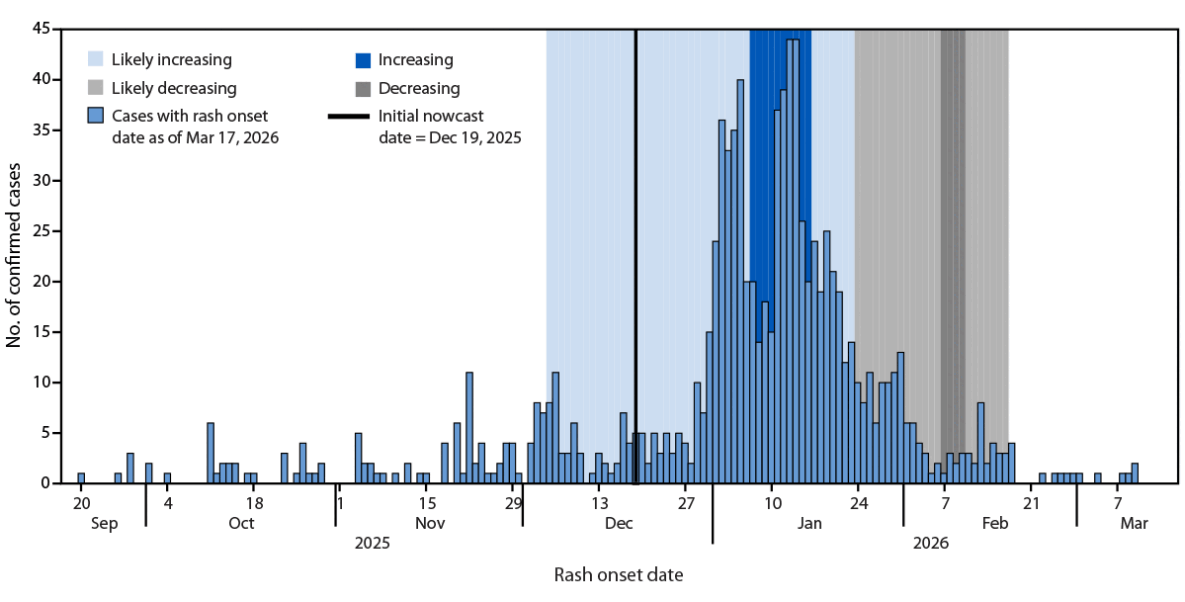
* The trend thresholds used for the posterior probability that the effective reproduction number exceeded 1 were as follows: ≥95% (increasing), 60% to <95% (likely increasing), 40% to <60% (stable), 5% to <40% (likely decreasing), and <5% (decreasing).
† The model was first run using line-list data from December 19, 2025. Outbreak trend estimates before this date were generated retrospectively from the first line list received.
FIGURE 2. Nowcast estimated number of measles cases compared with provisional* and final numbers of cases, by rash onset date — South Carolina, 2025–2026
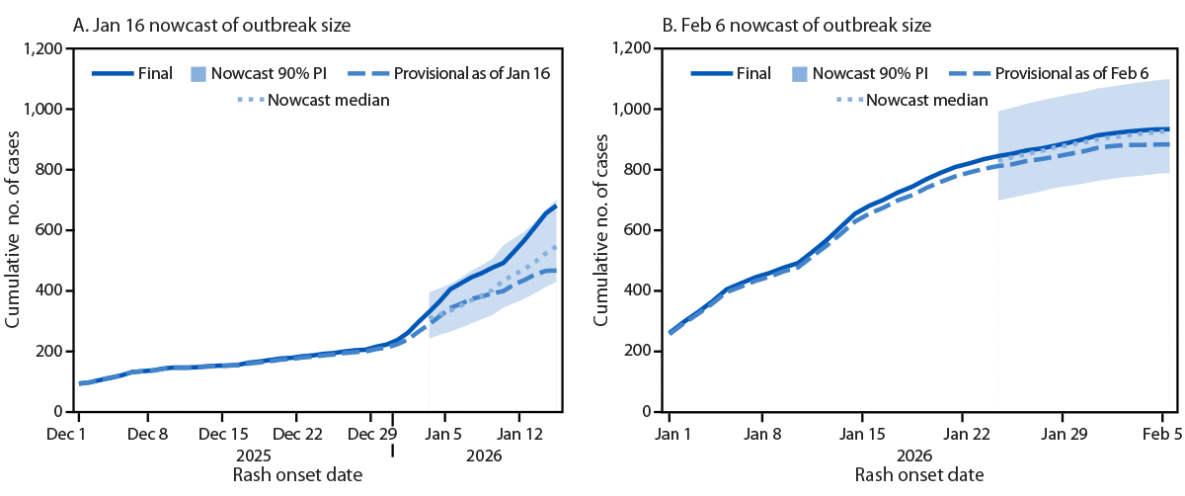
Abbreviation: PI = prediction interval.
* Provisional cases are the cumulative number of cases with rash onset date reported at the time of each line list. Final cases are the cumulative number of cases at each previous line-list date as reported in the final March 17, 2026, line list.
Suggested citation for this article: Miller PB, Routledge I, Pollock ED, et al. Use of Nowcasting to Estimate Real-Time Transmission Trends During a Measles Outbreak — South Carolina, October 2025–March 2026. MMWR Morb Mortal Wkly Rep 2026;75:516–521. DOI: http://dx.doi.org/10.15585/mmwr.mm7533a1.
MMWR and Morbidity and Mortality Weekly Report are service marks of the U.S. Department of Health and Human Services.
Use of trade names and commercial sources is for identification only and does not imply endorsement by the U.S. Department of
Health and Human Services.
References to non-CDC sites on the Internet are
provided as a service to MMWR readers and do not constitute or imply
endorsement of these organizations or their programs by CDC or the U.S.
Department of Health and Human Services. CDC is not responsible for the content
of pages found at these sites. URL addresses listed in MMWR were current as of
the date of publication.
All HTML versions of MMWR articles are generated from final proofs through an automated process. This conversion might result in character translation or format errors in the HTML version. Users are referred to the electronic PDF version (https://www.cdc.gov/mmwr) and/or the original MMWR paper copy for printable versions of official text, figures, and tables.
Questions or messages regarding errors in formatting should be addressed to mmwrq@cdc.gov.