Notes from the Field: Increase in Reported Adverse Health Effects Related to Synthetic Cannabinoid Use — United States, January–May 2015
, MPH1; , MD1; , MSPH1; , MD1; , DrPH1 (Author affiliations at end of text)
On April 6, 2015, CDC received notification of an increase in telephone calls to U.S. poison centers related to synthetic cannabinoid use. Monthly calls to all poison centers are tracked by the National Poison Data System, which reported that adverse health effects or concerns about possible adverse health effects related to synthetic cannabinoid use increased 330% from 349 in January 2015 to 1,501 in April 2015. Synthetic cannabinoids include various psychoactive chemicals or a mixture of such chemicals that are sprayed onto plant material, which is then often smoked or ingested to achieve a "high." These products are sold under a variety of names (e.g., synthetic marijuana, spice, K2, black mamba, and crazy clown) and can be sold in retail outlets as herbal products. Law enforcement agencies have regulated a number of these substances; however, manufacturers of synthetic cannabinoids frequently change the formulation to avoid detection and regulation. After the initial notification, CDC analyzed information from the National Poison Data System on reported adverse health effects related to synthetic cannabinoid use for the period January–May 2015.
During the 2015 study period, poison centers reported 3,572 calls related to synthetic cannabinoid use, a 229% increase from the 1,085 calls during the same January–May period in 2014 (Figure). The number of calls spiked notably in mid-April before decreasing nearly to 2014 levels by the end of May (Figure). Most calls concerned use among males (2,882 [80.7%]). Among 3,442 (96.4%) calls where age of the user was recorded, the median age was 26 years (range = 7 months–72 years).
The most commonly reported adverse health effects were agitation (1,262 [35.3%]), tachycardia (1,035 [29.0%]), drowsiness or lethargy (939 [26.3%]), vomiting (585 [16.4%]), and confusion (506, [4.2%]). Among 2,961 calls for which a medical outcome was reported, 335 (11.3%) callers had a major adverse effect (signs or symptoms that are life-threatening or result in substantial residual disability or disfigurement); 1,407 (47.5%) had a moderate effect (signs or symptoms that are not life-threatening and do not result in residual disability or disfigurement, but usually require some form of treatment). A total of 1,095 (37.0%) had a minor effect (signs or symptoms that are minimally bothersome and generally resolve rapidly with no residual disability or disfigurement), and 109 (3.7%) had no effect (1). A total of 15 (0.5%) deaths were reported.
Inhalation by smoking was the most common means of consumption (2,870 [80.3%]), followed by ingestion (698 [19.5%]). Most reported use was intentional (3,310 [92.7%]). Among 626 calls reporting use of synthetic cannabinoids with multiple substances, the most commonly reported other substances included alcohol (144 [23.0%]), plant-derived marijuana (103 [16.5%]), and benzodiazepines (69 [11.0%]). Only one of the deaths included reports of multiple substance use.
Calls indicating severe medical outcomes (major effect and death) were compared with calls indicating less severe outcomes (moderate effect, minor effect, and no effect). Results of a chi-square test demonstrated a significant association between sex and degree of severity. Males were significantly more likely to have a severe outcome (88.6%) than a less severe outcome (80.1%) (p<0.001). A significant association also was found between age group and severity (p<0.001); pairwise comparisons (adjusted by the stepdown Bonferroni procedure) indicated that persons aged 30–39 years and aged >40 years were significantly more likely than those aged 10–19 years to report a severe outcome (p = 0.001 and p<0.001, respectively).
The findings in this report are subject to at least two limitations. First, in some states, poison centers acted as central reporting centers for hospitals that evaluated persons experiencing a health effect associated with synthetic cannabinoid use. Situations in which a poison center was not contacted were not recorded, thus possibly underestimating the number of persons who were evaluated after synthetic cannabinoid use. Second, calls involving multiple substances were included in the analysis; therefore, adverse health effects might have resulted from use of other substances or a combination of substances.
The increasing number of synthetic cannabinoid variants available, higher toxicity of new variants, and the potentially increased use as indicated by calls to poison centers (2–3) might suggest that synthetic cannabinoids pose an emerging public health threat. Multiple other recent outbreaks (2–4) suggest a need for greater public health surveillance and awareness, targeted public health messaging, and enhanced efforts to remove these products from the market.
1Division of Environmental Hazards and Health Effects, National Center for Environmental Health, CDC.
Corresponding author: Royal Law, hua1@cdc.gov, 770-488-3416.
References
- Mowry JB, Spyker DA, Cantilena LR Jr, McMillan N, Ford M. 2013 annual report of the American Association of Poison Control Centers' National Poison Data System (NPDS): 31st annual report. Clin Toxicol (Phila) 2014;52:1032–283.
- CDC. Acute kidney injury associated with synthetic cannabinoid use—multiple states, 2012. MMWR Morb Mortal Wkly Rep 2013;62:93–8.
- CDC. Notes from the field: severe illness associated with synthetic cannabinoid use—Brunswick, Georgia, 2013. MMWR Morb Mortal Wkly Rep 2013;62:939.
- CDC. Notes from the field: severe illness associated with reported use of synthetic marijuana—Colorado, August–September 2013. MMWR Morb Mortal Wkly Rep 2013;62:1016–7.
FIGURE. Number of telephone calls to poison centers reporting adverse health effects related to synthetic cannabinoid use, by week — National Poison Data System, United States, January–May 2014 and 2015
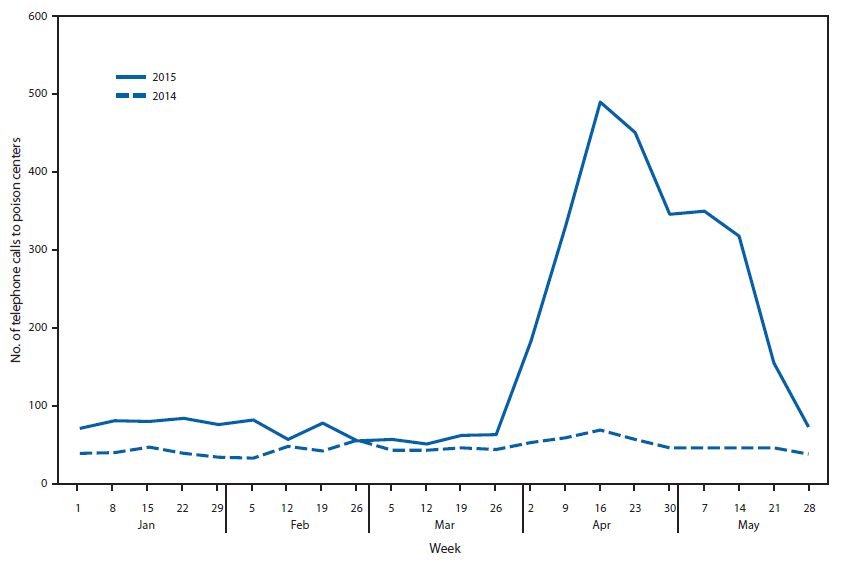
Alternate Text: The figure above is a line graph comparing the number of weekly telephone calls to poison centers in the United States reporting adverse health effects related to synthetic cannabinoid use during January-May 2014 and the same period in 2015.
Use of trade names and commercial sources is for identification only and does not imply endorsement by the U.S. Department of
Health and Human Services.
References to non-CDC sites on the Internet are
provided as a service to MMWR readers and do not constitute or imply
endorsement of these organizations or their programs by CDC or the U.S.
Department of Health and Human Services. CDC is not responsible for the content
of pages found at these sites. URL addresses listed in MMWR were current as of
the date of publication.
All MMWR HTML versions of articles are electronic conversions from typeset documents.
This conversion might result in character translation or format errors in the HTML version.
Users are referred to the electronic PDF version (http://www.cdc.gov/mmwr)
and/or the original MMWR paper copy for printable versions of official text, figures, and tables.
An original paper copy of this issue can be obtained from the Superintendent of Documents, U.S.
Government Printing Office (GPO), Washington, DC 20402-9371;
telephone: (202) 512-1800. Contact GPO for current prices.
**Questions or messages regarding errors in formatting should be addressed to
mmwrq@cdc.gov.
