Persons using assistive technology might not be able to fully access information in this file. For assistance, please send e-mail to: mmwrq@cdc.gov. Type 508 Accommodation and the title of the report in the subject line of e-mail.
Evolution of Varicella Surveillance — Selected States, 2000–2010
Varicella surveillance practices have evolved since varicella first became nationally notifiable in 1972 (1) (Table 1). Because national surveillance data were not adequate for monitoring the impact of varicella vaccine when it became available in the United States, active surveillance for varicella was established in sentinel sites in 1995 (1,2). With declines in varicella incidence after 1 dose of varicella vaccine was added to the routine childhood vaccination schedule in 1996 (3) and a second dose was recommended in 2006 (4), the number of cases of varicella in the active surveillance sites became insufficient to monitor further impact of vaccination. CDC evaluated varicella surveillance data reported via the National Notifiable Diseases Surveillance System (NNDSS) during 2000–2010 to determine whether these data might now be adequate for monitoring vaccination impact. By 2010, a total of 39 states required reporting of varicella cases, 38 states were conducting passive case-based surveillance, and 31 met CDC's ad hoc criteria for adequate and consistent reporting. Varicella incidence in the states that met these criteria declined 79% overall, from 43 per 100,000 population in 2000 to nine in 2010. While 1 dose of varicella vaccine was recommended, incidence declined 43% during 2000–2005, and after a second dose was added to the routine childhood schedule, incidence declined 72% during 2006–2010. State varicella surveillance data reported to CDC through NNDSS are now adequate for monitoring trends in varicella incidence, but continued strengthening of the surveillance system and participation of all states is needed.
Demographic data from cases of varicella reported through passive surveillance to states and local health departments are transmitted to CDC via NNDSS. Because varicella reporting has not been consistent over time, CDC established ad hoc criteria for inclusion of state NNDSS data in its analysis. A state's data reported to NNDSS were included if the state reported to CDC a minimum of one case per 100,000 population each year (considered adequate reporting by CDC) for ≥3 consecutive years (considered consistent reporting by CDC) during 2000–2010. To calculate national incidence rates from passive surveillance data using the CDC criteria, the total number of cases classified as confirmed, probable, or unknown reported from states meeting CDC's inclusion criteria were aggregated and divided by the aggregate population of the same states using U.S. Census data. Age-specific incidence rates for states with adequate and consistent reporting and age data were calculated for 2000 through 2010.
In 2009, CDC began receiving case-based varicella-specific data from states via Health Level Seven (HL7) messages. These data were analyzed to evaluate vaccination status, disease severity (measured by number of lesions), and hospitalizations in cases reported in 2009 and 2010.
In 2000, a total of 12 states required reporting of varicella cases to the state, two states were conducting passive case-based surveillance, and 10 were conducting aggregate reporting; 10 states had adequate and consistent reporting. By 2010, a total of 39 states had made varicella reportable to the state, 38 states were conducting passive case-based surveillance, and 31 had adequate and consistent reporting.* Overall incidence in the states that met adequate and consistent reporting criteria declined 79.4%, from 43.2 per 100,000 in 2000 to 8.9 in 2010. During 2000–2005, when a single dose of varicella vaccine was recommended, incidence declined 43.3%; during 2006–2010, when 2 doses were recommended routinely, incidence declined a further 71.6% (Figure 1).
As an additional criterion, states were asked in 2010 when they first considered their varicella reporting to CDC to be reliable (i.e., considered reliable by the reporting state). Twenty-six of the 31 states with adequate and consistent reporting responded; all 26 stated that they considered their varicella data reported to CDC in 2010 to be reliable. Overall incidence in these 26 states declined 81.8% from 2000 to 2010, 45.4% from 2000 to 2005, and 77.4% from 2006 to 2010.
In 2000, case data from three states, representing 33.6% of varicella cases reported to CDC through NNDSS, included age. By 2010, the number of states reporting age had increased to 28, representing 86.1% of cases. Based on data from these states, from 2000 to 2010, varicella incidence declined most among children aged 1–4 years (69.7%) and 5–9 years (86.2%), the age groups for whom 1 dose of vaccine was routinely recommended during 2000–2005 and 2 doses were recommended during 2006–2010 (Figure 2). During 2000–2005, age-specific incidence declined 37.4% and 49.8% among children aged 1–4 and 5–9 years, respectively. Declines continued during 2006–2010, when 2 doses were recommended, with incidence in children aged 1–4 and 5–9 years decreasing 59.3% and 82.3%, respectively (Table 2).
During 2009–2010, 15, 12, and 11 states reported to CDC data on varicella vaccination status, disease severity, and hospitalizations, respectively, through HL7 messaging; 64.2% (7,906 of 12,313) of the cases were in persons who had received varicella vaccine, 52.3% (2,062 of 3,942) were in persons who had fewer than 50 lesions, and 1.6% (146 of 9,068) were in persons who were hospitalized. Of the cases occurring in vaccinated persons, 64.9% (1,638 of 3,517) were in persons who had fewer than 50 lesions.
Reported by
Erica Din, Emory Univ School of Nursing, Atlanta, GA. Stephanie R. Bialek, MD, Adriana S. Lopez, MHS, Div of Viral Diseases, National Center for Immunization and Respiratory Diseases, CDC. Corresponding contributor: Adriana S. Lopez, alopez@cdc.gov, 404-639-8369.
Editorial Note
National varicella surveillance has improved greatly since 1996, when varicella vaccine was first recommended for use in the United States, with 31 states having adequate and consistent reporting to CDC as of 2010. In the states with adequate and consistent reporting, overall varicella incidence decreased 79% from 2000 to 2010. Since 2 doses of varicella vaccine were recommended for routine use in 2006, varicella incidence decreased approximately 70% overall, with the greatest declines observed among children aged 5–9 years, the age group targeted for 2 doses. Although state varicella surveillance data are now adequate to monitor trends in varicella incidence, challenges remain in improving data quality.
When a single dose of varicella vaccine was first recommended, varicella surveillance consisted of passive aggregate reporting and was conducted in only 17 states. Before universal surveillance could be implemented in all states, CDC, in collaboration with selected state and local health departments, established the varicella active surveillance project (VASP). From 1995 to 2005, when routine vaccination included a single dose, two VASP sites documented a 90% decline in varicella incidence that coincided with varicella vaccination coverage surpassing 90% in both sites by 2005 (5). From 2000 to 2005, declines in incidence reported by the states (43%) mirrored declines observed in the VASP sites (54%–60%). The differences in the decline in varicella incidence observed in the state and active surveillance site data might be attributed, in part, to differences in vaccination coverage in the areas under surveillance. The impact of the second routine dose recommended in 2006 is demonstrated with decreases in varicella incidence ranging from 72% in the state surveillance data to approximately 79% in VASP sites (6). Although the VASP sites provided unique data on the changing epidemiology of varicella during the routine 1-dose varicella vaccination program, the number of cases reported by the sites has decreased, so that it is no longer feasible to use VASP to continue monitoring the impact of the vaccination program.
A total of 39 states were reporting varicella data to CDC as of 2010, with 38 conducting passive varicella case-based surveillance and one conducting aggregate reporting. However, of the states conducting case-based surveillance, only 15 were reporting their varicella-specific data to CDC. Although data from these states were consistent with data reported from one of the VASP sites, reporting of varicella-specific data by more states will be critical for ensuring that the impact of the 2-dose varicella vaccine recommendation is fully monitored. For states not yet reporting their varicella-specific case-level data to CDC, data can be sent via HL7 messaging.†
Reporting of case-based surveillance variables is necessary so that national passive varicella surveillance data can be used to monitor the changing epidemiology of varicella and vaccine effectiveness over time. The variables of most importance include age, vaccination status and number of doses, and disease severity (1). However, at this stage of the vaccination program, reporting complete case information, including outcomes such as complications, hospitalizations, and deaths, is needed and increasingly feasible to collect because varicella incidence has declined 97% since the start of the varicella vaccination program (from an average 7.2 per 1,000 in 1995 to 0.2 per 1,000 in 2010).
Varicella-related deaths, which were made reportable in 1999 (7), also are important for tracking disease severity and missed opportunities for vaccination. Four varicella-related deaths were reported in 2010, none of which were in patients with a documented history of varicella vaccination. As 2-dose varicella vaccination coverage increases and circulation of the varicella-zoster virus declines, a greater proportion of varicella cases are expected among vaccinated persons. Breakthrough varicella generally is mild and can be difficult to diagnose clinically (8). Consequently, laboratory confirmation of disease is increasingly important to ensure accurate diagnosis and management of suspected cases of varicella. Polymerase chain reaction testing of lesion or scab specimens is recommended for laboratory confirmation of varicella cases.§
The findings in this report are subject to at least four limitations. First, the validity of the ad hoc definitions of adequate and consistent reporting was not assessed. The minimum incidence requirement of one reported case per 100,000 population for the adequacy criterion was selected because this incidence was much lower than what was reported in VASP. Coupled with the consistent criterion of reporting for at least 3 consecutive years, these criteria seemed reasonable to CDC varicella experts and corresponded fairly closely with the qualitative judgments of reporting quality provided by the states. Second, not all states reported varicella data to CDC. Without information from all states, it is impossible to understand varicella trends completely, especially if states that did not report have varicella vaccination coverage that differs from states that did report or if they have populations in whom varicella disease epidemiology differs. However, among the 39 states reporting data to CDC as of 2010, varicella epidemiology does not appear to differ. Third, because varicella data included in this report are collected through passive reporting to the state, case ascertainment likely is incomplete, and these results might underestimate actual varicella incidence. Finally, some proportion of reported cases might not actually be varicella, resulting in an overestimate of incidence.
With the cessation of active surveillance for varicella, national passive surveillance will be critical for monitoring changes in the epidemiology of varicella, detecting gaps in protection of specific populations (e.g., those for whom catch-up vaccination is recommended or populations who refuse vaccination), assessing vaccine effectiveness, and monitoring the impact of the current 2-dose vaccination recommendation. Further declines in varicella incidence since those reported shortly after implementation of the 2-dose vaccination program (6,9) are expected as 2-dose varicella vaccination coverage increases. However, to continue monitoring the implementation and impact of the 2-dose program effectively, it is increasingly important for all states to move toward case-based varicella surveillance. These data will be critical for informing vaccination policy moving forward.
References
- CDC. Varicella surveillance practices—United States, 2004. MMWR 2006;55:1126–9.
- CDC. Evaluation of varicella reporting to the National Notifiable Diseases Surveillance System—United States, 1972–1997. MMWR 1999;48:55–8.
- CDC. Decline in annual incidence of varicella—selected states, 1990–2001. MMWR2003;52:884–5.
- CDC. Prevention of varicella: recommendations of the Advisory Committee on Immunization Practices (ACIP). MMWR 2007;56(No. RR-4).
- Guris D, Jumaan AO, Mascola L, et al. Changing varicella epidemiology in active surveillance sites—United States, 1995–2005. J Infect Dis 2008;197(Suppl 2):S71–5.
- Bialek S, Zhang J, Jackson C, et al. Changing varicella epidemiology since implementation of routine 2-dose varicella vaccination for children, active surveillance areas, United States, 2006–2010. Presented at the 49th Infectious Disease Society of America Annual Meeting, Boston, MA; October 20–23, 2011. Abstract available at https://idsa.confex.com/idsa/2011/webprogram/Paper31182.html. Accessed August 2, 2012.
- Council of State and Territorial Epidemiologists. Inclusion of varicella-related deaths in the National Public Health Surveillance System (NPHSS). Position statement no. ID-10. Atlanta, GA: Council of State and Territorial Epidemiologists; 1998. Available at http://www.cste.org/ps/1998/1998-id-10.htm. Accessed August 2, 2012.
- Chaves SS, Zhang J, Civen R, et al. Varicella disease among vaccinated persons: clinical and epidemiological characteristics, 1997–2005. J Infect Dis 2008;197(Suppl 2):S127–31.
- Kattan JA, Sosa LE, Bohnwagner HD, Hadler JL. Impact of 2-dose vaccination on varicella epidemiology: Connecticut, 2005–2008. J Infect Dis 2011;203:509–12.
* Alabama, Alaska, Arkansas, Colorado, Connecticut, District of Columbia, Delaware, Florida, Hawaii, Illinois, Kansas, Louisiana, Maine, Massachusetts, Michigan, Missouri, Montana, New Hampshire, New Mexico, North Dakota, Ohio, Pennsylvania, South Carolina, South Dakota, Texas, Utah, Vermont, Virginia, West Virginia, Wisconsin, and Wyoming. (For this report, the District of Columbia is counted as a state.)
† Additional information is available at http://www.cdc.gov/phin/library/guides/varicella_message_mapping_guide_v2_01.pdf.
§ Information on how to collect specimens is available at http://www.cdc.gov/chickenpox/lab-testing/collecting-specimens.html.
What is already known on this topic?
When 1 dose of the varicella vaccine was added to the childhood immunization schedule in 1996, national passive varicella surveillance was not adequate to monitor the impact of the vaccination program. Varicella surveillance during the first 10 years of the varicella vaccination program relied on active surveillance sites, which demonstrated substantial declines in varicella incidence during 1995–2005.
What is added by this report?
During 2000–2010, the number of states meeting criteria for inclusion in national passive surveillance analysis increased from 12 to 31. Varicella incidence in the states meeting these criteria declined 79% overall, from 43 cases per 100,000 population in 2000 to nine cases per 100,000 in 2010.
What are the implications for public health practice?
State varicella surveillance data reported to CDC are now adequate for monitoring national trends in varicella incidence. Continued strengthening of the surveillance system and participation from all states is needed to monitor fully the impact of the routine second dose of varicella vaccine recommended for children in 2006.
|
TABLE 1. History of national varicella surveillance and related events — United States, 1972–2006 |
|
|---|---|
|
Year |
Surveillance milestone |
|
1972 |
Varicella becomes a nationally notifiable disease. |
|
1981 |
Varicella is removed from the nationally notifiable diseases list.* |
|
1991 |
Council of State and Territorial Epidemiologists (CSTE) recommends that states develop or maintain sources of varicella surveillance data (e.g., active surveillance in health maintenance organizations or cities/counties/schools, sentinel reporting systems, notifiable disease reporting where feasible, death certificate data, or surveys) to monitor trends in disease incidence. |
|
1995 |
Varicella vaccine is licensed for use in the United States. |
|
1996 |
A single dose of varicella vaccine is recommended for routine childhood vaccination in the United States. |
|
1997 |
CSTE recommends that states and territories investigate all varicella-related deaths to monitor changes in varicella-related mortality and to understand why deaths occurred. |
|
1998 |
CSTE recommends that states establish some form of ongoing systematic morbidity surveillance (e.g., aggregate case reporting, hospital discharge data review, sentinel systems, or surveys). |
|
1998 |
Varicella deaths become nationally notifiable, with implementation on January 1, 1999. |
|
2002 |
CSTE recommends including varicella in the National Notifiable Disease Surveillance System by 2003 and establishing case-based surveillance in all states by 2005, with implementation on January 1, 2003. |
|
2006 |
Two doses of varicella vaccine are recommended routinely as part of the childhood vaccination schedule in the United States. |
|
Source: CDC. Varicella surveillance practices—United States, 2004. MMWR 2006;55:1126–9. Available at http://www.cdc.gov/mmwr/preview/mmwrhtml/mm5541a4.htm?s_cid=mm5541a4_e. * During 1972–1997, a total of 14 states maintained continuous varicella reporting to CDC. |
|
FIGURE 1. Incidence of varicella in states meeting the criteria for adequate and consistent reporting* and number of states reporting, by year — United States, 2000–2010
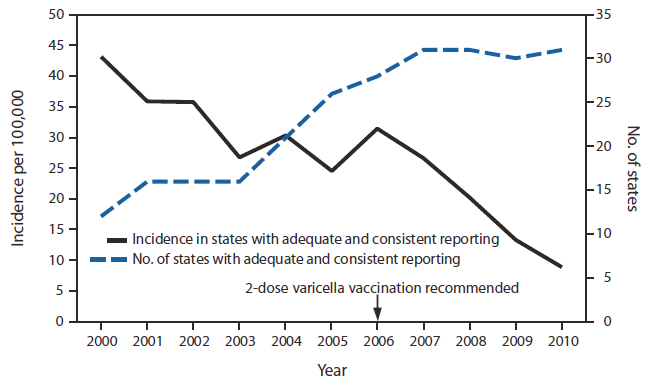
* Defined as reporting at least one varicella case per 100,000 population (considered adequate) for ≥3 consecutive years (considered consistent) to the National Notifiable Diseases Surveillance System. States meeting the criteria for adequate and consistent reporting in 2010: Alabama, Alaska, Arkansas, Colorado, Connecticut, District of Columbia, Delaware, Florida, Hawaii, Illinois, Kansas, Louisiana, Maine, Massachusetts, Michigan, Missouri, Montana, New Hampshire, New Mexico, North Dakota, Ohio, Pennsylvania, South Carolina, South Dakota, Texas, Utah, Vermont, Virginia, West Virginia, Wisconsin, and Wyoming. (For this report, the District of Columbia is counted as a state.)
Alternate Text: The figure above shows the incidence of varicella in states meeting the criteria for adequate and consistent reporting and the number of states reporting, by year, in the United States during 2000-2010. In 2000, a total of 12 states required reporting of varicella cases to the state, two states were conducting passive case-based surveillance, and 10 were conducting aggregate reporting; 10 states had adequate and consistent reporting. By 2010, a total of 39 states had made varicella reportable to the state, 38 states were conducting passive case-based surveillance, and 31 had adequate and consistent reporting. Overall incidence in the states that met adequate and consistent reporting criteria declined 79.4%, from 43.2 per 100,000 in 2000 to 8.9 in 2010. During 2000-2005, when a single dose of varicella vaccine was recommended, incidence declined 43.3%; during 2006-2010, when 2 doses were recommended routinely, incidence declined a further 71.6%.
FIGURE 2. Incidence of varicella* in states meeting the criteria for adequate and consistent reporting,† by age group§ — United States, 2000–2010
* Presented using a logarithmic scale.
† Defined as reporting at least one varicella case per 100,000 population (considered adequate) for ≥3 consecutive years (considered consistent) to the National Notifiable Diseases Surveillance System. States meeting the criteria for adequate and consistent reporting in 2010: Alabama, Alaska, Arkansas, Colorado, Connecticut, District of Columbia, Delaware, Florida, Hawaii, Illinois, Kansas, Louisiana, Maine, Massachusetts, Michigan, Missouri, Montana, New Hampshire, New Mexico, North Dakota, Ohio, Pennsylvania, South Carolina, South Dakota, Texas, Utah, Vermont, Virginia, West Virginia, Wisconsin, and Wyoming. (For this report, the District of Columbia is counted as a state.)
§ Reported varicella cases with missing age information decreased over time, from 66% in 2000 to 14% in 2010.
Alternate Text: The figure above shows the incidence of varicella in states meeting the criteria for adequate and consistent reporting, by age group, in the United States during 2000-2010. In 2000, case data from three states, representing 33.6% of varicella cases reported to CDC through the National Notifiable Diseases Surveillance System, included age. By 2010, the number of states reporting age had increased to 28, representing 86.1% of cases. Based on data from these states, from 2000 to 2010, varicella incidence declined most among children aged 1-4 years (69.7%) and 5-9 years (86.2%), the age groups for whom 1 dose of vaccine was routinely recom¬mended during 2000-2005 and 2 doses were recommended during 2006-2010.
Use of trade names and commercial sources is for identification only and does not imply endorsement by the U.S. Department of
Health and Human Services.
References to non-CDC sites on the Internet are
provided as a service to MMWR readers and do not constitute or imply
endorsement of these organizations or their programs by CDC or the U.S.
Department of Health and Human Services. CDC is not responsible for the content
of pages found at these sites. URL addresses listed in MMWR were current as of
the date of publication.
All MMWR HTML versions of articles are electronic conversions from typeset documents.
This conversion might result in character translation or format errors in the HTML version.
Users are referred to the electronic PDF version (http://www.cdc.gov/mmwr)
and/or the original MMWR paper copy for printable versions of official text, figures, and tables.
An original paper copy of this issue can be obtained from the Superintendent of Documents, U.S.
Government Printing Office (GPO), Washington, DC 20402-9371;
telephone: (202) 512-1800. Contact GPO for current prices.
**Questions or messages regarding errors in formatting should be addressed to
mmwrq@cdc.gov.
