Persons using assistive technology might not be able to fully access information in this file. For assistance, please send e-mail to: mmwrq@cdc.gov. Type 508 Accommodation and the title of the report in the subject line of e-mail.
Vital Signs: Prevalence, Treatment, and Control of High Levels of Low-Density Lipoprotein Cholesterol --- United States, 1999--2002 and 2005--2008
On February 1, this report was posted as an MMWR Early Release on the MMWR website (http://www.cdc.gov/mmwr).
ABSTRACT
Background: High levels of low-density lipoprotein cholesterol (LDL-C), a major risk factor for coronary heart disease (CHD), can be treated effectively.
Methods: CDC analyzed data from 1999--2002 and 2005--2008 to examine the prevalence, treatment, and control of high LDL-C among U.S. adults aged ≥20 years. Values were determined from blood specimens obtained from persons participating in the National Health and Nutrition Examination Survey (NHANES), a nationally representative cross-sectional, stratified, multistage probability sample survey of the U.S. civilian, noninstitutionalized population. The National Cholesterol Education Program Adult Treatment Panel-III guidelines set LDL-C goal levels of <100 mg/dL, <130 mg/dL, and <160 mg/dL for persons with high, intermediate, and low risk for developing CHD during the next 10 years, respectively. A person with high LDL-C was defined as either a person whose LDL-C levels were above the LDL-C goal levels or a person who reported currently taking cholesterol-lowering medication. Control of high LDL-C was defined as having a treated LDL-C value below the goal levels.
Results: Based on data from the 2005--2008 NHANES, an estimated 71 million (33.5%) U.S. adults aged ≥20 years had high LDL-C, but only 34 million (48.1%) were treated and 23 million (33.2%) had their LDL-C controlled. Among persons with uncontrolled LDL-C, 82.8% reported having some form of health insurance. The proportion of adults with high LDL-C who were treated increased from 28.4% to 48.1% between the 1999--2002 and 2005--2008 study periods. Among adults with high LDL-C, the prevalence of LDL-C control increased from 14.6% to 33.2% between the periods. The prevalence of LDL-C control was lowest among persons who reported receiving medical care less than twice in the previous year (11.7%), being uninsured (13.5%), being Mexican American (20.3%), or having income below the poverty level (21.9%).
Conclusions: The prevalence of control of high LDL-C in the United States, although improving, remains low, especially among low-income adults and those with limited access to health care. Strengthening the use of preventive services through improvement in health-care access and quality of care is expected to help achieve better control of high LDL-C in the United States.
Implications for Public Health Practice: To improve LDL-C control levels, a comprehensive approach that involves improved clinical care, as well as improved health-care access, sustainability, and affordability, is needed. A standardized system of patient care incorporating electronic health records, registries, and automated reminders for practitioners, focusing on achieving regular patient follow-up, has the potential to improve control of high LDL-C. Lower out-of-pocket costs and simplification of the drug regimen, as well as involvement of nurses, dietitians, health educators, pharmacists and other allied health-care professionals in direct patient care also could be used to improve patient adherence to prescribed regimens.
Introduction
Having a high level of low-density lipoprotein cholesterol (LDL-C) is a major risk factor for coronary heart disease (CHD), a major cause of death in the United States (1). Control of high LDL-C can reduce cardiovascular morbidity and mortality substantially (2), yet high LDL-C remains underdiagnosed and undertreated in the United States. Predictive modeling in one study suggested that every 10% increase in the prevalence of treatment among adults with high LDL-C could prevent approximately 8,000 deaths per year in those aged <80 years (3). Another study estimated that full adherence to the National Cholesterol Education Program Adult Treatment Panel III (NCEP ATP III) primary prevention guidelines* among adults aged 35--85 years could prevent 20,000 myocardial infarctions and 10,000 deaths from CHD and save $2.8 billion in CHD-related health care costs per year (4). Previous studies demonstrated that many U.S. adults with high LDL-C are not treated adequately (5). To assess the current status and recent trends in the prevalence, treatment, and control of high LDL-C among U.S. adults aged ≥20 years, data from the 1999--2002 and 2005--2008 National Health and Nutrition Examination Survey (NHANES) were analyzed.
Methods
NHANES is a continuous nationally representative cross-sectional survey of the health and nutritional status of the U.S. civilian, noninstitutionalized population. The survey has a complex, multistage probability design, which is intended to represent the U.S. population.† NHANES data are released in 2-year cycles. All NHANES cycles include a household interview and a detailed physical examination that includes anthropometric measurements. A subsample of NHANES is selected randomly and participants are instructed to fast before the physical examination. Participants are included in the fasting subsample if they have fasted at least 8 hours before blood specimens are taken for laboratory testing. As with other subsamples in the study, the data from the fasting subsample are weighted to account for the probability of selection and nonresponse.
To estimate trends in the prevalence of high LDL-C reliably in multiple strata of the population, data were analyzed from four survey periods; data from 1999--2000 and 2001--2002 were aggregated and compared with aggregated results from 2005--2006 and 2007--2008. The overall survey response rates for adults aged ≥20 years during 1999--2002 and 2005--2008 were 78.1% and 76.4%, respectively. During 1999--2002, a total of 9,471 adults aged ≥20 years took part in the home interviews and were examined at NHANES mobile examination centers; 10,480 participated in 2005--2008. Among those participants, 4,059 (1999--2002) and 4,341 (2005--2008) provided fasting blood samples for lipid profile testing. The final analytic samples were 3,550 (1999--2002) and 3,996 (2005--2008) after further exclusions were made for pregnant women (280 and 189) and participants missing data needed for determining high LDL-C status (229 and 156).
Current guidelines by NCEP ATP III recommend LDL-C goals based on level of risk for developing coronary heart disease (CHD) in the next 10 years. The guidelines set LDL-C goal levels of <100 mg/dL, <130 mg/dL, and <160 mg/dL for high, intermediate, and low risk groups, respectively. Participants with a self-reported history of CHD, angina, myocardial infarction, stroke, and/or diabetes, or participants with a fasting blood glucose level of ≥126 mg/dL or fasting hemoglobin A1c ≥6.5 were placed in the high NCEP ATP III risk category. After participants with high risk were identified, the remaining participants were assessed according to the number of major CHD risk factors they had. These risk factors included cigarette smoking (self-reported smoking every day or some days), hypertension (an average of up to three blood pressure measurements ≥140/90 mm Hg, determined by NHANES physical examination; or self-reported current use of antihypertensive medication), high-density lipoprotein cholesterol (HDL-C) <40 mg/dL, and age (men ≥45 years and women ≥55 years). In accord with the NCEP ATP III guidelines, if a person had an HDL-C ≥60 mg/dL, one risk factor was subtracted from the person's total number of risk factors. Participants with no more than one major CHD risk factor were placed in the low NCEP ATP III risk category. For participants with two or more risk factors, a 10-year CHD risk score was calculated using the Framingham risk equation, an assessment tool used in the NCEP ATP III. Those participants with a 10-year CHD risk greater than 20% were placed in the high NCEP ATP III risk category, and those with 20% or lower risk were placed in the intermediate category. Further details on classifications of the study participants into each of the NCEP ATP III risk categories are published elsewhere (5).
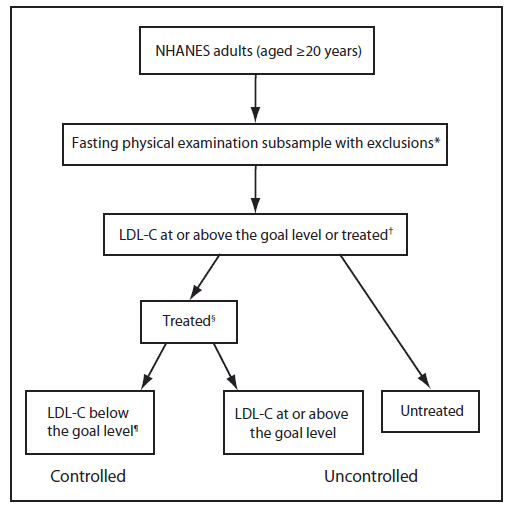
Persons who had levels at or above the LDL-C goal for their risk group or self-reported currently taking cholesterol-lowering medication were defined as having high LDL-C. A person who reported currently taking cholesterol-lowering medication was defined to be treated for high LDL-C. A person's cholesterol level was considered to be under control if their LDL-C level was below the risk-specific goal (Figure 1). Results are described as weighted prevalence, calculated using the survey statistical weight that was designated for the subgroup with LDL-C levels measured in the morning after fasting, to account for the additional probability of selection and nonresponse, with 95% confidence limits. Population counts were calculated using the Current Population Surveys.§
Results
Differences in prevalence, treatment, and control of high LDL-C in 2005--2008 were observed among demographic groups (Table). The prevalence of high LDL-C increased with age: 11.7%, 41.2%, and 58.2% for the age groups 20--39, 40--64, and ≥65 years, respectively. The lowest treatment prevalences occurred among persons aged 20--39 years (10.6%), those without a usual source of care (17.7%), those receiving medical care less than twice during the past year (17.7%), and those without health insurance (22.6%). However, in this study, 82.8% of persons with uncontrolled LDL-C reported having some form of health insurance. The highest treatment prevalences during the study period were observed among persons aged ≥65 years (64.4%), those insured under Medicare (63.4%), and those who received medical care at least four times during the previous year (61.4%). Factors associated with the highest and lowest levels of control of high LDL-C were similar to those observed for treatment.
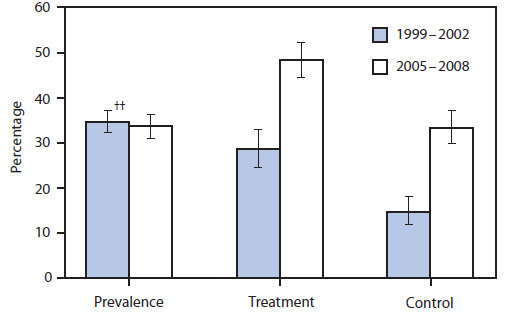
The overall population prevalence of high LDL-C did not change significantly from 1999--2002 (34.5%) to 2005--2008 (33.5%) (Figure 2). However, treatment of high LDL-C increased significantly, from 28.4% in 1999--2002 to 48.1% in 2005--2008. In addition, the prevalence of those under control more than doubled during the study period, from 14.6% to 33.2%.
Conclusions and Comment
High LDL-C can be managed and controlled successfully with lifestyle changes, medications, or a combination of these approaches. Implementing lifestyle modifications, such as a low-fat and high-fiber diet, increased physical activity, and weight control, might decrease LDL-C levels by up to 20%--30%. Results from a meta-analysis of 14 clinical trials showed that therapy with statins, the most common type of drug prescribed to lower cholesterol, can safely reduce the 5-year incidence of major coronary events, coronary revascularization, and stroke by about 20% for each mmol/L (about 39 mg/dL) reduction in LDL-C (6). Although this study documented that striking improvements in the prevalence of treatment and control of high LDL-C have occurred, an estimated 71 million (33.5%) U.S. adults aged ≥20 years have high LDL-C, and only one third of conditions are controlled.
These results demonstrate that the lowest prevalence of control of high LDL-C existed among participants who did not have health insurance and those who had received medical care less than twice in the previous year. In addition, the especially low prevalence of control among Mexican Americans warrants specific attention. This study and others illustrate that gaps in cholesterol control often are related to gaps in availability of, access to, or continuity of health care (7--9). The Affordable Care Act (ACA) is intended to reduce some of these gaps (10) by increasing insurance coverage among the nonelderly population from 82.5% in the first quarter of 2010 to 94% by 2019 and by providing coverage for cholesterol screening with no cost-sharing (11).
Access to care alone will not solve problems with cholesterol control completely. In this study, approximately 83% of persons with uncontrolled LDL-C reported having some form of health insurance. However, even among participants with private health insurance coverage, prevalence of control of high LDL-C was <35% in this study. These results are not surprising; up to half of patients discontinue lipid-lowering medication within 1 year of treatment initiation, and adherence rates generally decrease over time (12). Lower out-of-pocket costs (13) and simplification of the drug regimen (14) generally are associated with better adherence.
In addition to access to care and patient adherence, quality of care must be addressed. The continued development and widespread use of electronic health records will facilitate efforts to better control cholesterol; such efforts include patient registries, panel management (an innovative approach that incorporates provider and patient reminders for proactive follow-up appointments and additional treatment), and use of these systems in real-time to direct patient care. Another promising system improvement includes team-led care, which can improve preventive and chronic care delivery (15). Several programmatic initiatives promoted by ACA will contribute to health-care access and quality (15). Those include comprehensive, family-centered, coordinated primary care (patient-centered medical homes), health care provided by types of managed-care organizations that are accountable to patients and third-party payers for the overall care of beneficiaries (accountable care organizations), and health care targeted to underserved communities and vulnerable populations (the federally qualified health center program) (15).
The findings in this report are subject to at least four limitations. First, the prevalence of high LDL-C levels in the U.S. population might be underestimated because older persons residing in nursing homes and other institutions, who have a higher prevalence of age-related high LDL-C, are not included in the NHANES. Second, although data collection is standardized, the NHANES self-reported data from interviews and questionnaires might be subject to misunderstanding and/or recall bias. Third, the reported prevalence of high LDL-C treatment and control in this report might be underestimated for the following reasons. The Framingham risk score only assesses adults up to age 79 years, but the NHANES sample contained participants aged >79 years. Participants who were aged >79 years were assigned the same level of risk as those aged 70--79 years. Although family history of premature CHD is a risk factor, it could not be included in the assessment because it was not reported consistently through all study cycles. Finally, lifestyle modification factors were not examined in this report. Some of the participants in this study whose LDL-C levels were measured as normal might have been treated and successfully controlled with life-style modification measures; thus, they would not have been classified as having high LDL-C.
The prevalence of control of high LDL-C in the United States remains below 35% and is especially low (below 15%) among adults with limited access to health care. Although the development of targeted programs for low-income adults and those with limited access to health care is warranted, better control of high LDL-C cannot be achieved only with increased access to health care. Key elements for control also include improved clinical care and better patient adherence to treatment. The development of targeted programs for special groups (e.g., persons who are uninsured or whose income is below the poverty level) is warranted. Given the multicomponent nature of high LDL-C control, implementation of comprehensive strategies by federal, state, and local governments; health-care providers; employers; nonprofit organizations; and food, restaurant, and pharmaceutical industries is needed.
Reported by
EV Kuklina, MD, PhD, KM Shaw, MS, Y Hong, MD, PhD, Div for Heart Disease and Stroke Prevention, National Center for Chronic Disease Prevention and Health Promotion, CDC.
Acknowledgments
This report is based, in part, on contributions by P Briss, National Center for Chronic Disease Prevention and Health Promotion, and D Matson-Koffman, Div for Heart Disease and Stroke, National Center for Chronic Disease Prevention and Health Promotion, CDC.
References
- Xu JQ, Kochanek KD, Murphy SL, Tejada-Vera B. Deaths: final data for 2007. Hyattsville, MD: US Department of Health and Human Services, CDC, National Center for Health Statistics; 2010. National Vital Statistics Report, vol. 58, no. 19. Available at http://www.cdc.gov/nchs/data/nvsr/nvsr58/nvsr58_19.pdf. Accessed January 25, 2011.
- Ward S, Lloyd Jones M, Pandor A, et al. A systematic review and economic evaluation of statins for the prevention of coronary events. Health Technol Assess 2007;11:1--160, iii--iv.
- Farley TA, Dalal MA, Mostashari F, Frieden TR. Deaths preventable in the U.S. by improvements in use of clinical preventive services. Am J Prev Med 2010;38:600--9.
- Pletcher MJ, Lazar L, Bibbins-Domingo K, et al. Comparing impact and cost-effectiveness of primary prevention strategies for lipid-lowering. Ann Intern Med 2009;150:243--54.
- Kuklina EV, Yoon PW, Keenan NL. Trends in high levels of low-density lipoprotein cholesterol in the United States, 1999--2006. JAMA 2009;302:2104--10.
- Cholesterol Treatment Trialists' (CTT) Collaboration. Efficacy and safety of more intensive lowereing of LDL-cholesterol: a meta-analysis of data from 170,000 participants in 26 randomised trials. Lancet 2010; 376:1670-81.
- Winters P, Tancredi D, Fiscella K. The role of usual source of care in cholesterol treatment. J Am Board Fam Med 2010;23:179--85.
- Kang-Kim M, Betancourt JR, Ayanian JZ, Zaslavsky AM, Yucel RM, Weissman JS. Access to care and use of preventive services by Hispanics: state-based variations from 1991 to 2004. Med Care 2008;46:507--15.
- Jasek JP. Having a primary care provider and receipt of recommended preventive care among men in New York City. Am J Mens Health 2010 Aug 26 [Epub ahead of print].
- Congressional Budget Office. Letter from Douglas W. Elmendorf to the Honorable Nancy Pelosi, speaker of the U.S. House of Representatives, dated March 20, 2010. Available at http://www.cbo.gov/ftpdocs/113xx/doc11379/AmendReconProp.pdf. Accessed September 27, 2010.
- Cassidy A. Health policy brief: preventive services without cost sharing. Health Affairs, December 28, 2010. Available at http://www.rwjf.org/files/research/71628.pdf. Accessed January 24, 2011.
- Rublee DA, Chen SY, Mardekian J, Wu N, Rao P, Boulanger L. Evaluation of cardiovascular morbidity associated with adherence to atorvastatin therapy. Am J Ther 2010 Sep 10 [Epub ahead of print].
- Mann DM, Woodward M, Muntner P, Falzon L, Kronish I. Predictors of nonadherence to statins: a systematic review and meta-analysis. Ann Pharmacother 2010;44:1410--21.
- Schedlbauer A, Davies P, Fahey T. Interventions to improve adherence to lipid lowering medication. Cochrane Database Syst Rev 2010;3:CD004371.
- Kocher R, Emanual EJ, DeParle NA. The Affordable Care Act and the future of clinical medicine: the opportunities and challenges. Ann Intern Med 2010;153:536--9.
|
Key Points
|
-
Control of high levels of low-density lipoprotein cholesterol (LDL-C), a major risk factor for coronary heart disease that is asymptomatic, can reduce cardiovascular morbidity and mortality substantially.
-
An estimated 71 million U.S. adults aged ≥20 years, or 34% of the adult population, had high LDL-C during 2005--2008 (LDL-C levels above the recommended goal levels or reported current use of cholesterol-lowering medication).
-
The proportion of those treated for high LDL-C increased from 28% during 1999--2002 to 48% (34 million adults) during 2005--2008. The proportion of those who achieved control more than doubled, to 33%, or 23 million adults.
-
The prevalence of LDL-C control was lowest (<15%) among adults with limited access to health care. However, about 83% of persons with uncontrolled LDL-C reported having some form of health insurance.
-
Better control of high LDL-C cannot be achieved only with increased access to health care. Key elements for control also include improved clinical care and better patient adherence to treatment.
-
Additional information is available at
http://www.cdc.gov/vitalsigns.
|
FIGURE 1. Study definitions for high levels of low-density lipoprotein cholesterol (LDL-C) and treatment and control of high LDL-C --- National Health and Nutrition Examination Survey (NHANES), United States, 1999--2002 and 2005--2008.
Alternate Text: The figure above shows study definitions for high levels of low-density lipoprotein cholesterol (LDL-C) and treatment and control of high LDL-C in the United States from 1999-2002 and 2005-2008, according to the National Health and Nutrition Examination Survey (NHANES). Persons who had levels at or above the LDL-C goal for their risk group or self-reported currently taking cholesterol-lowering medication were defined as having high LDL-C. A person who reported currently taking cholesterol-lowering medication was defined to be treated for high LDL-C. A person's cholesterol level was considered to be under control if their LDL-C level was below the risk-specific goal.
|
Characteristic
|
High LDL-C (n = 3,996)
|
Treatment (n = 1,482)
|
Control (n = 1,486)
|
|
%††
|
(95% CI)
|
%
|
(95% CI)
|
%
|
(95% CI)
|
|
Total
|
33.5
|
(30.9--36.2)
|
48.1
|
(44.3--52.0)
|
33.2
|
(29.7--36.9)
|
|
Sex
|
|
Male
|
36.2
|
(32.7--39.8)
|
45.6
|
(41.2--50.1)
|
31.1
|
(27.2--35.4)
|
|
Female
|
31.0
|
(27.8--34.4)
|
50.8
|
(44.9--56.8)
|
35.5
|
(30.1--41.3)
|
|
Age group (yrs)
|
|
20--39
|
11.7
|
(9.6--14.4)
|
10.6
|
(6.0--17.9)
|
---§§§
|
|
|
40--64
|
41.2
|
(37.6--45.0)
|
47.7
|
(42.2--53.2)
|
33.8
|
(28.6--39.4)
|
|
≥65
|
58.2
|
(54.7--61.6)
|
64.4
|
(61.0--67.8)
|
44.7
|
(39.5--50.1)
|
|
Race/Ethnicity
|
|
White, non-Hispanic
|
34.5
|
(31.3--37.8)
|
50.3
|
(46.0--54.5)
|
35.4
|
(31.9--39.0)
|
|
Black, non-Hispanic
|
30.4
|
(26.5--34.6)
|
44.5
|
(37.3--51.8)
|
26.2
|
(19.8--33.7)
|
|
Mexican-American
|
27.7
|
(24.2--31.6)
|
34.1
|
(27.9--40.8)
|
20.3
|
(15.5--26.2)
|
|
Poverty status (%)§§
|
|
<100
|
35.6
|
(30.8--40.8)
|
41.0
|
(32.7--49.9)
|
21.9
|
(17.0--27.7)
|
|
100--199
|
36.1
|
(32.6--39.9)
|
48.1
|
(41.4--54.9)
|
26.4
|
(21.8--31.6)
|
|
200--399
|
32.8
|
(29.1--36.8)
|
49.9
|
(43.8--56.0)
|
35.2
|
(29.2--41.7)
|
|
400--499
|
29.8
|
(23.9--36.5)
|
42.2
|
(29.5--56.0)
|
29.2
|
(17.6--44.3)
|
|
≥500
|
32.8
|
(28.1--37.8)
|
49.3
|
(41.1--57.5)
|
39.8
|
(31.8--48.3)
|
|
Education (aged ≥25 yrs)
|
|
Less than high school
|
41.0
|
(36.7--45.4)
|
46.4
|
(40.7--52.3)
|
27.8
|
(22.4--34.0)
|
|
High school
|
42.3
|
(38.2--46.5)
|
51.5
|
(45.6--57.2)
|
35.8
|
(30.8--41.2)
|
|
Some college
|
35.7
|
(32.2--39.4)
|
47.2
|
(39.4--55.3)
|
31.8
|
(24.7--39.8)
|
|
College graduate
|
28.7
|
(24.0--34.0)
|
48.6
|
(39.7--57.5)
|
38.5
|
(30.2--47.4)
|
|
Usual source of care¶¶
|
|
Yes
|
35.7
|
(33.0--38.5)
|
50.7
|
(46.8--54.6)
|
35.7
|
(31.8--39.7)
|
|
No
|
20.0
|
(15.9--24.9)
|
17.7
|
(10.9--27.4)
|
---§§§
|
|
|
Times received health-care during last 12 months***
|
|
0--1
|
21.7
|
(19.0--24.7)
|
17.7
|
(13.3--23.0)
|
11.7
|
(8.0--16.7)
|
|
2--3
|
34.3
|
(29.9--39.0)
|
48.4
|
(42.6--54.2)
|
34.6
|
(29.6--40.0)
|
|
≥4
|
43.9
|
(40.7--47.1)
|
61.4
|
(56.4--66.2)
|
42.6
|
(37.1--48.3)
|
|
Insurance status†††
|
|
Medicare
|
58.9
|
(55.2--62.6)
|
63.4
|
(59.3--67.3)
|
41.8
|
(36.7--47.2)
|
|
Private
|
27.8
|
(25.0--30.8)
|
45.2
|
(38.3--52.3)
|
33.5
|
(27.9--39.6)
|
|
Public
|
38.6
|
(30.9--46.8)
|
47.5
|
(37.4--57.8)
|
30.6
|
(21.1--42.1)
|
|
Uninsured
|
25.0
|
(21.0--29.6)
|
22.6
|
(17.4--28.8)
|
13.5
|
(8.4--21.0)
|
FIGURE 2. Prevalence of high levels of low-density lipoprotein cholesterol (LDL-C)* and treatment† and control§ of high levels of LDL-C in adults¶ aged ≥20 years --- National Health and Nutrition Examination Survey, United States, 1999--2002 and 2005--2008**
Alternate Text: The figure above shows the prevalence of high levels of low-density lipoprotein cholesterol (LDL-C) and treatment and control of high levels of LDL-C in adults aged ≥20 years in the United States during 1999-2002 and 2005-2008, according to the National Health and Nutrition Examination Survey.