Key points
- Lyme disease cases are reported to CDC by state health departments and the District of Columbia through the National Notifiable Diseases Surveillance System (NNDSS).
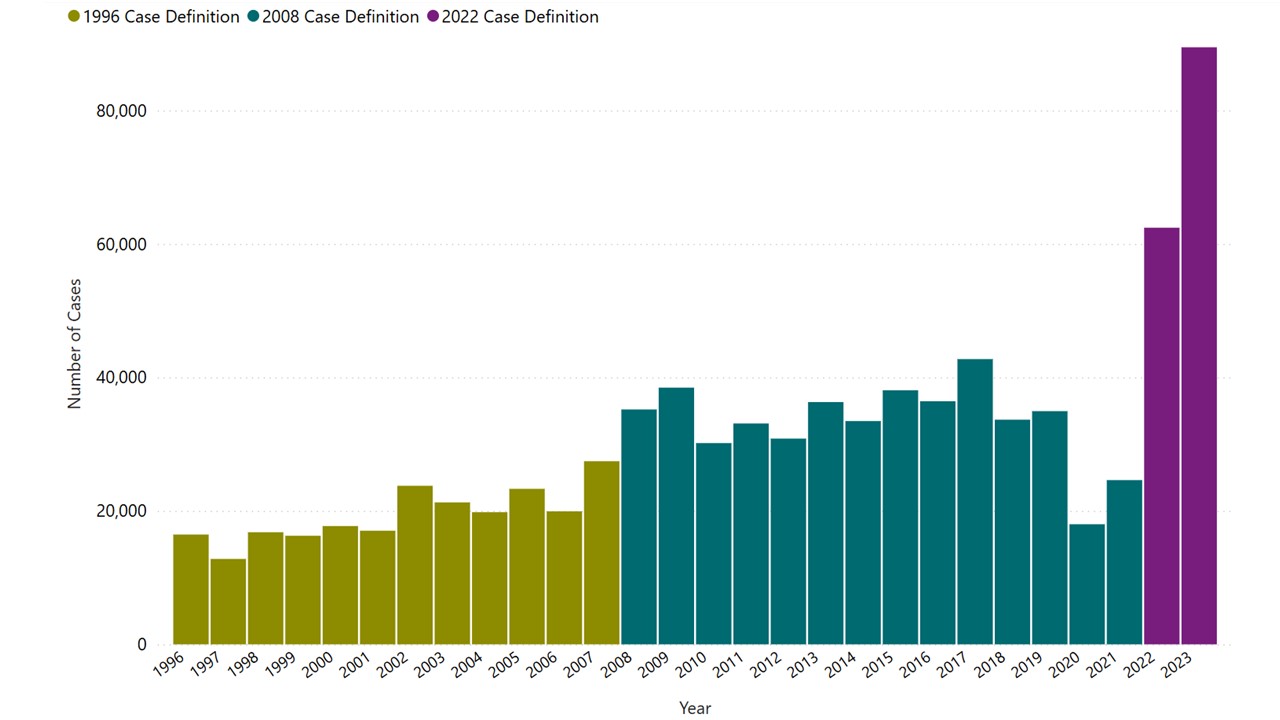
- Explore information on reported Lyme disease cases by year in the United States, including: total number of cases reported, rates, seasonality, and demographic data.
Interactive data
*Due to the coronavirus disease 2019 (COVID-19) pandemic, 2019 and 2020 data from some jurisdictions are incomplete.